
Houses for sale & to rent in ME2 1PA, Carroll Close, Cuxton And Halling, Rochester
House Prices in ME2 1PA, Carroll Close, Cuxton And Halling
Properties in ME2 1PA have no sales history available within the last 3 years. ME2 1PA is a postcode in Carroll Close located in Cuxton And Halling, an area in Rochester, Medway, with 3 households².
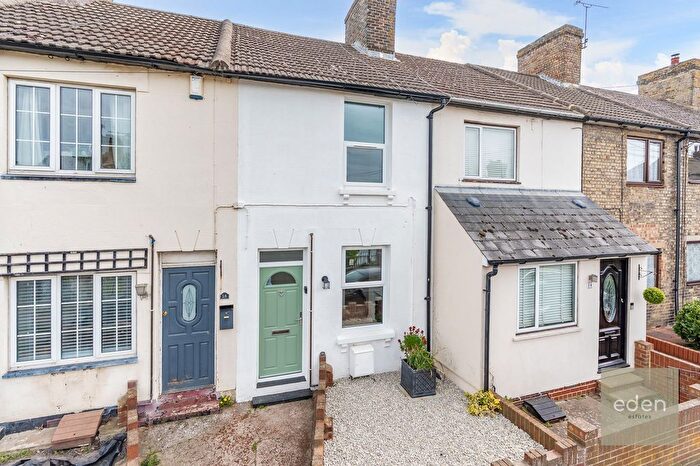
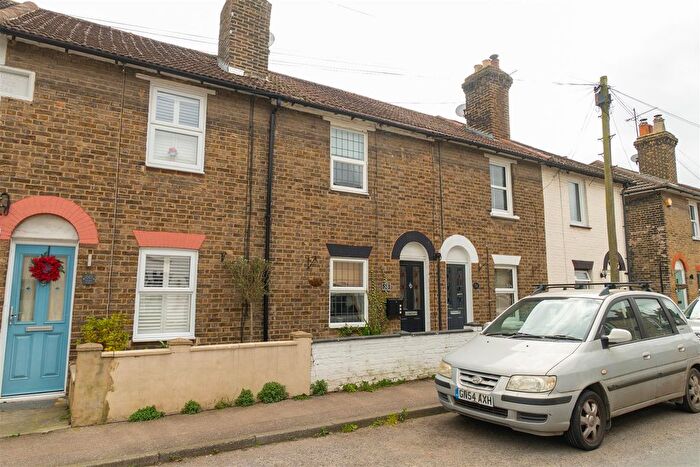
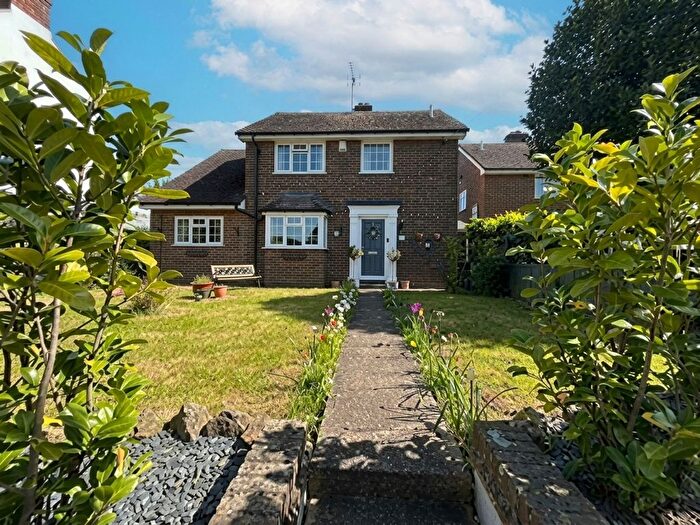
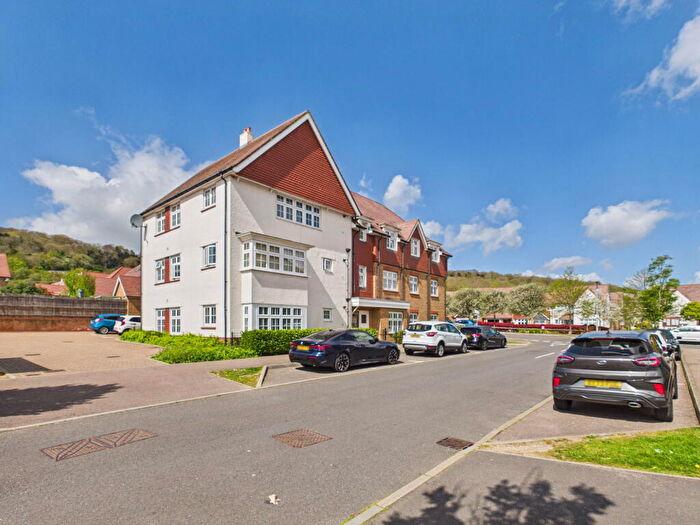
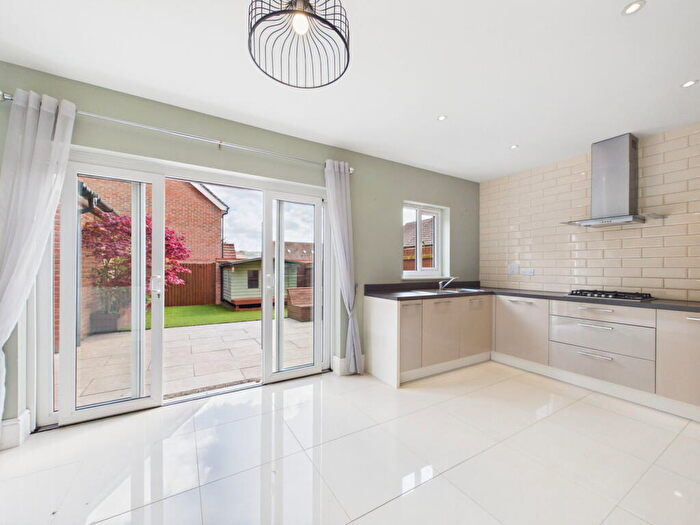
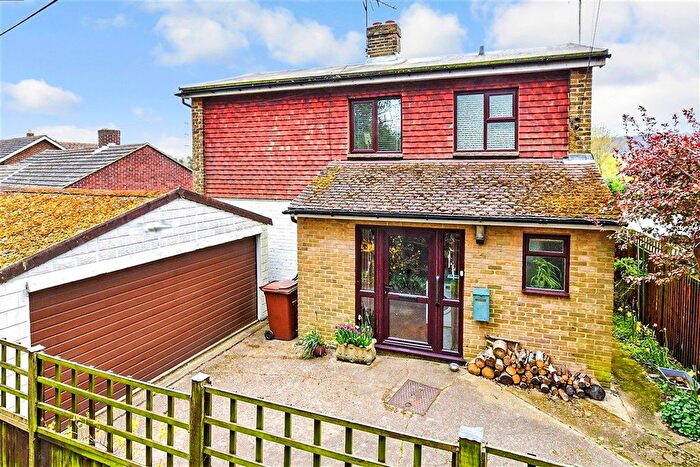
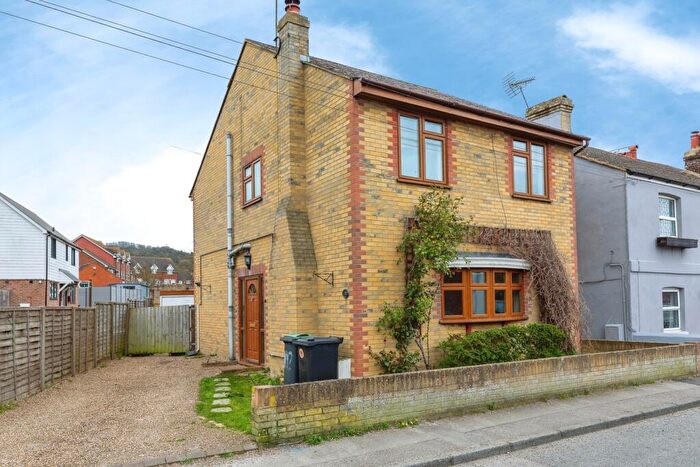
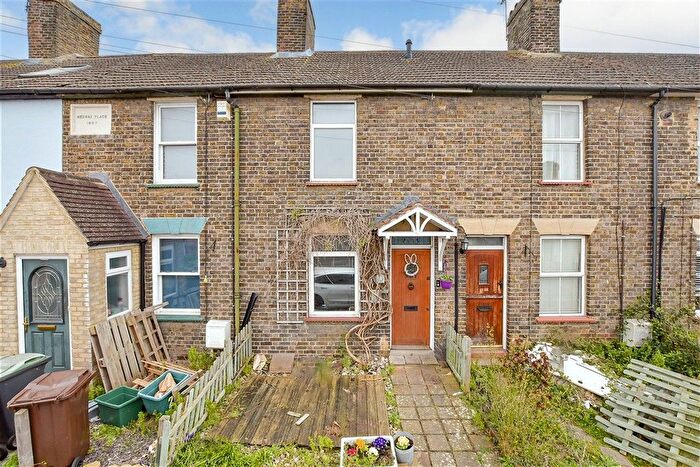
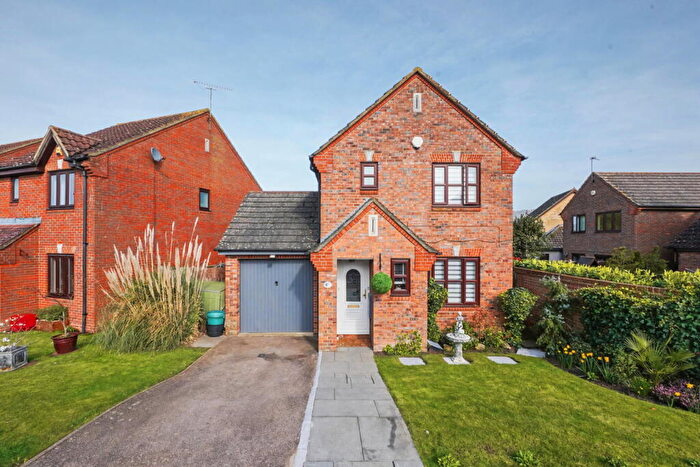
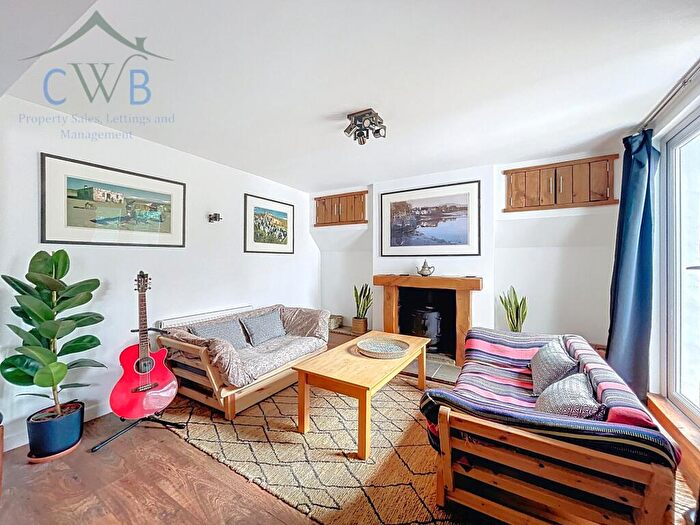
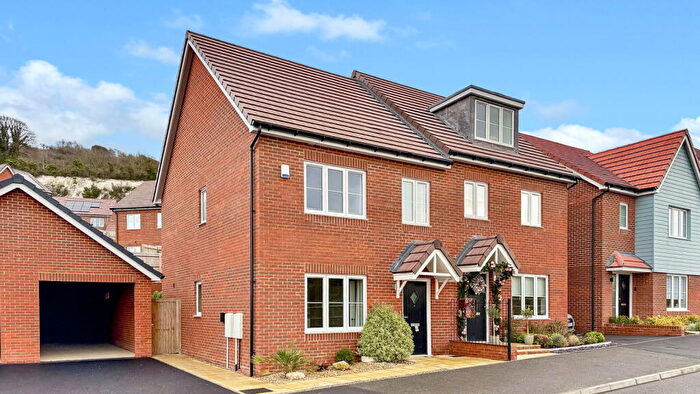
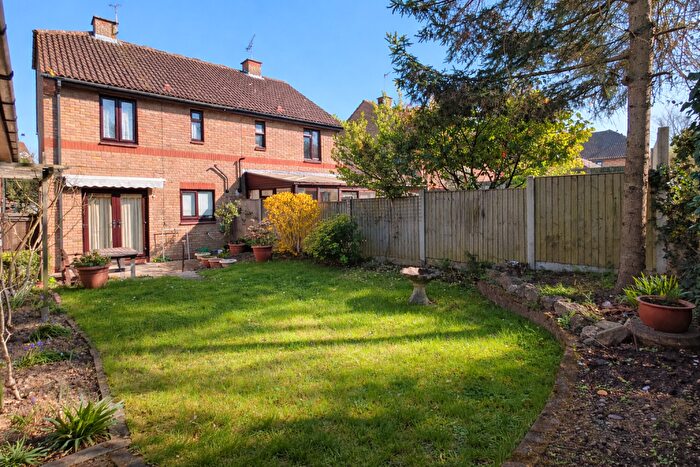
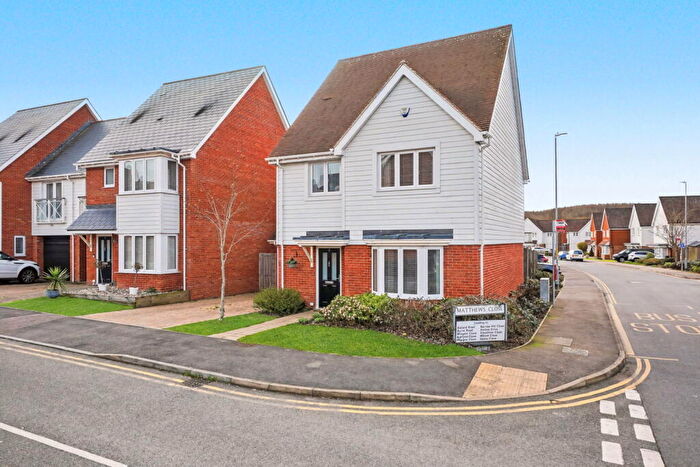
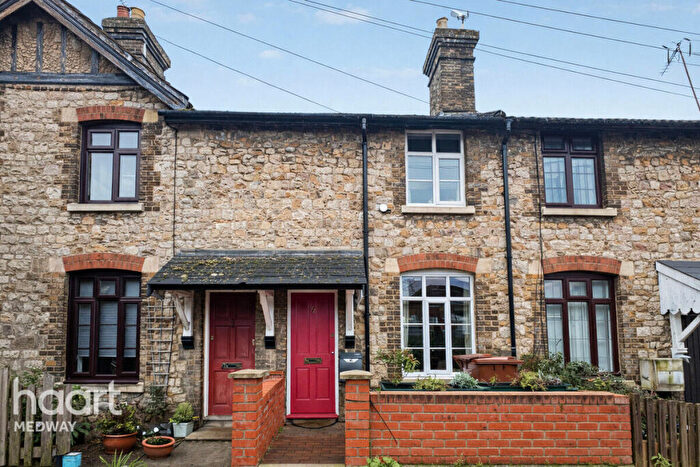
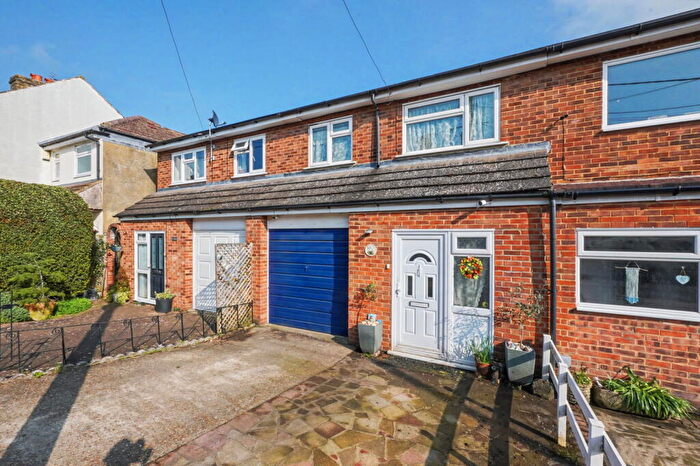
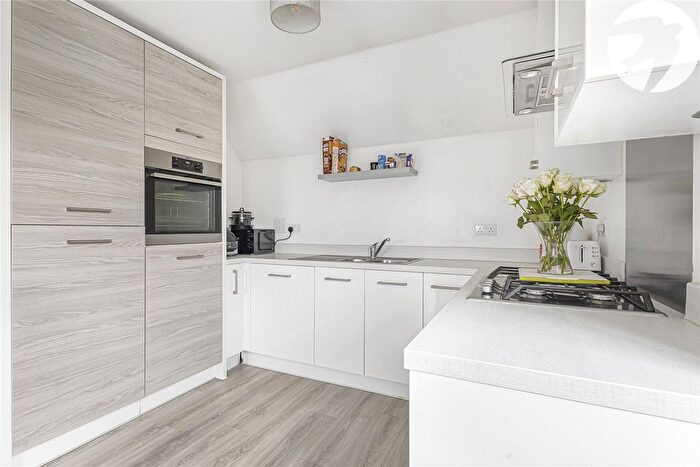
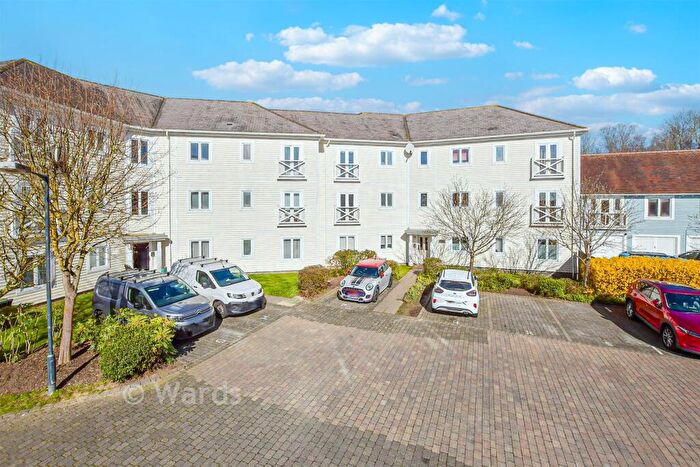
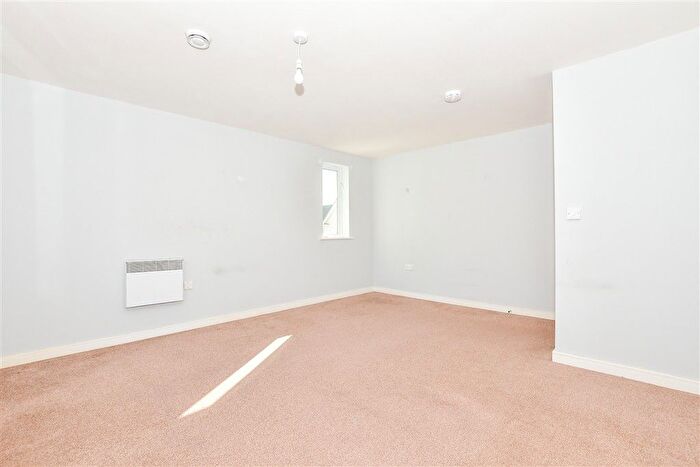
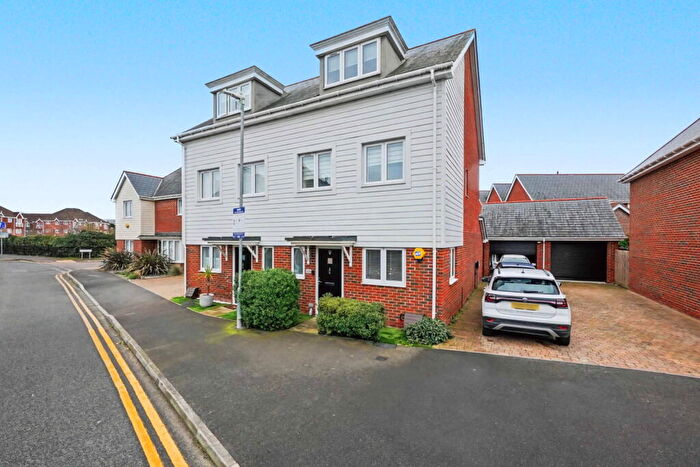
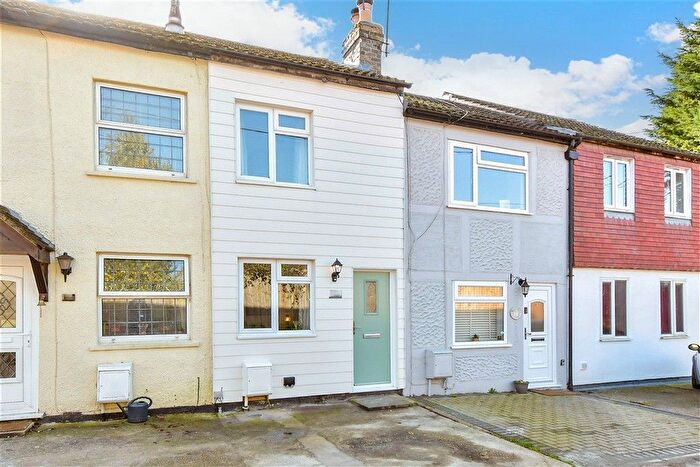
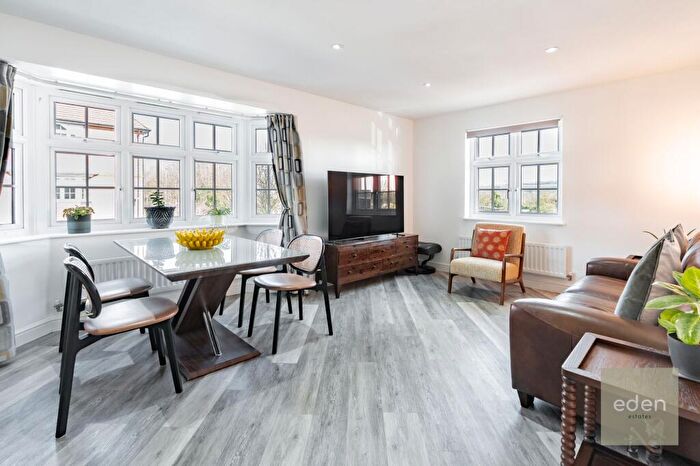
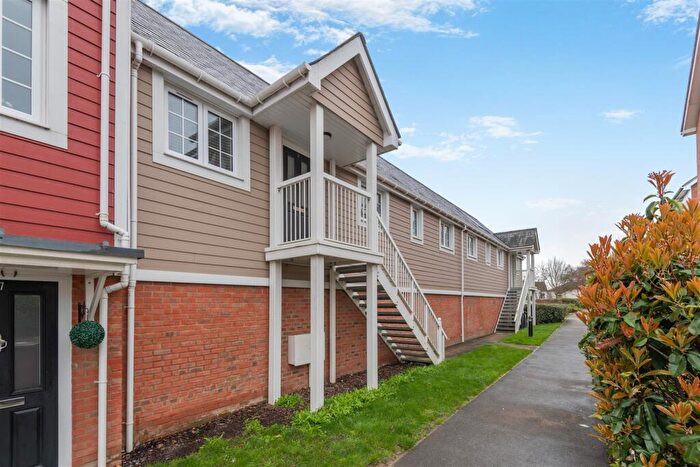
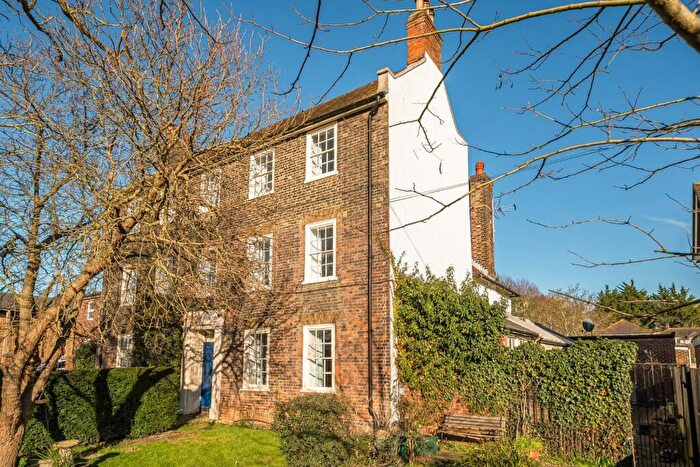
Properties for sale near ME2 1PA, Carroll Close
![]()
If you are looking to sell your house, let it out, or receive a property valuation, an expert can help you.
Click the button below to get started.
Price Paid in Carroll Close, ME2 1PA, Cuxton And Halling
2 Carroll Close, ME2 1PA, Cuxton And Halling Rochester
Property 2 has been sold 5 times. The last time it was sold was in 05/08/2022 and the sold price was £582,000.00.
This detached house, sold as a freehold on 05/08/2022, is a 133 sqm detached house with an EPC rating of C.
| Date | Price | Property Type | Tenure | Classification |
|---|---|---|---|---|
| 05/08/2022 | £582,000.00 | Detached House | freehold | Established Building |
| 23/10/2020 | £475,000.00 | Detached House | freehold | Established Building |
| 26/05/2006 | £315,000.00 | Detached House | freehold | Established Building |
| 19/08/2005 | £320,000.00 | Detached House | freehold | Established Building |
| 23/10/1998 | £139,950.00 | Detached House | freehold | New Build |
1 Carroll Close, ME2 1PA, Cuxton And Halling Rochester
Property 1 has been sold 3 times. The last time it was sold was in 30/06/2021 and the sold price was £550,000.00.
This detached house, sold as a freehold on 30/06/2021, is a 138 sqm detached house with an EPC rating of C.
| Date | Price | Property Type | Tenure | Classification |
|---|---|---|---|---|
| 30/06/2021 | £550,000.00 | Detached House | freehold | Established Building |
| 25/05/2001 | £215,000.00 | Detached House | freehold | Established Building |
| 31/07/1998 | £139,950.00 | Detached House | freehold | New Build |
Transport near ME2 1PA, Carroll Close

House price paid reports for ME2 1PA, Carroll Close
Click on the buttons below to see price paid reports by year or property price:
- Price Paid By Year
Property Price Paid in ME2 1PA, Carroll Close by Year
The average sold property price by year was:
| Year | Average Sold Price | Price Change |
Sold Properties
|
|---|---|---|---|
| 2022 | £582,000 | 5% |
1 Property |
| 2021 | £550,000 | 14% |
1 Property |
| 2020 | £475,000 | 34% |
1 Property |
| 2006 | £315,000 | -2% |
1 Property |
| 2005 | £320,000 | 33% |
1 Property |
| 2001 | £215,000 | 35% |
1 Property |
| 1998 | £139,950 | - |
2 Properties |