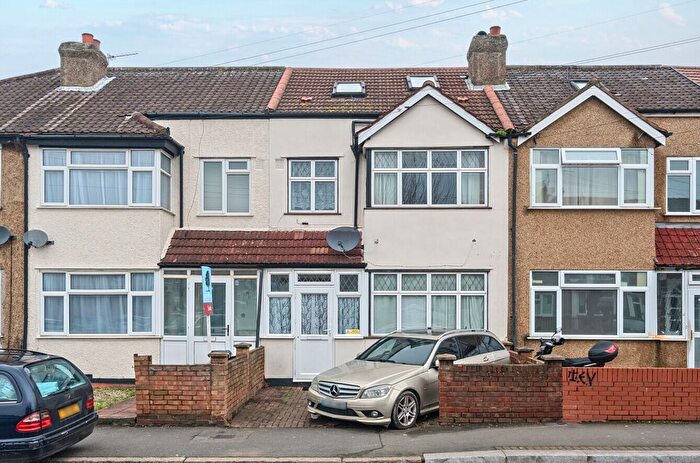
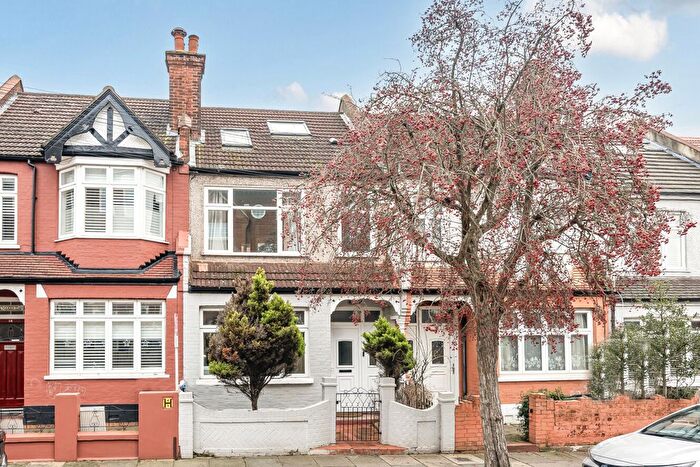
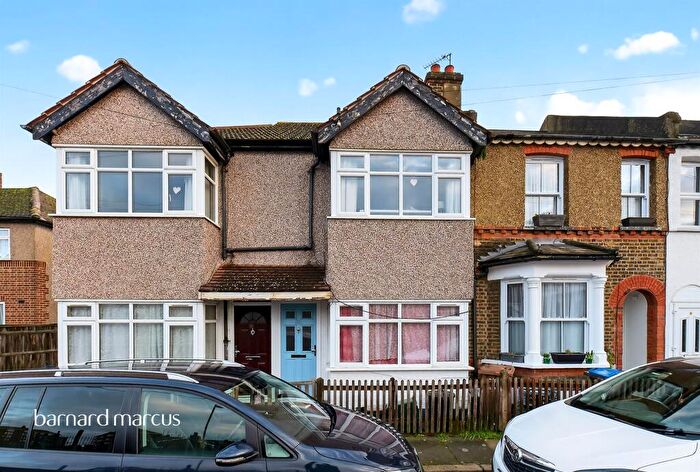
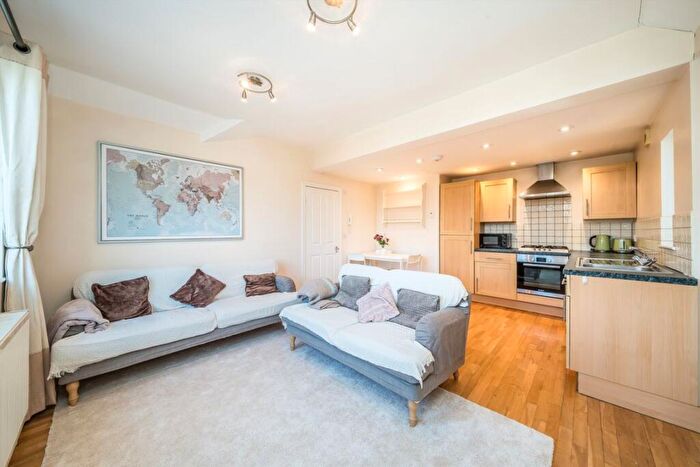
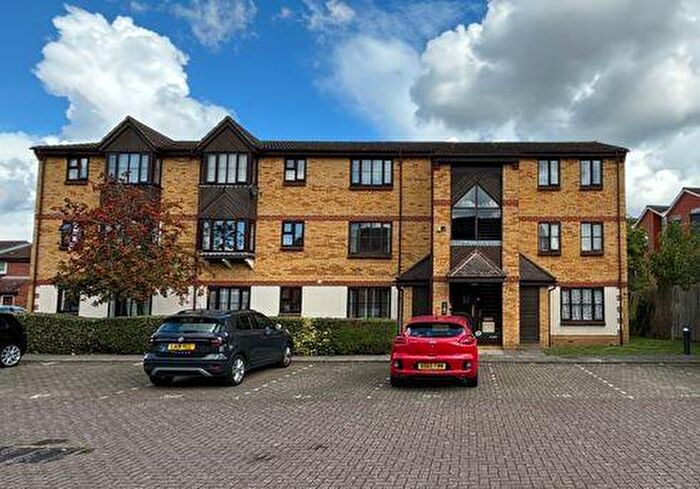
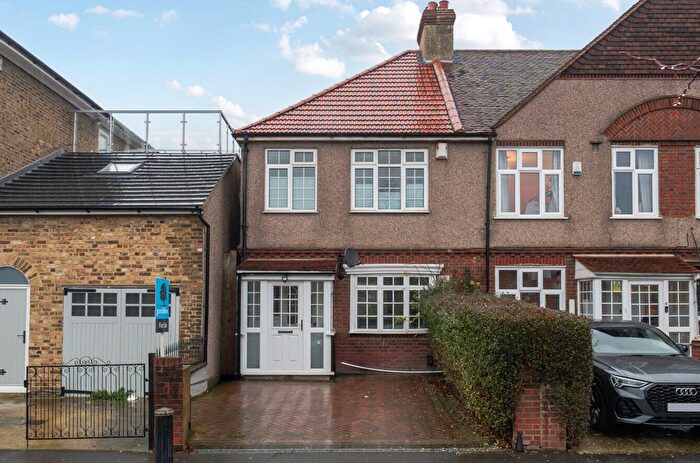
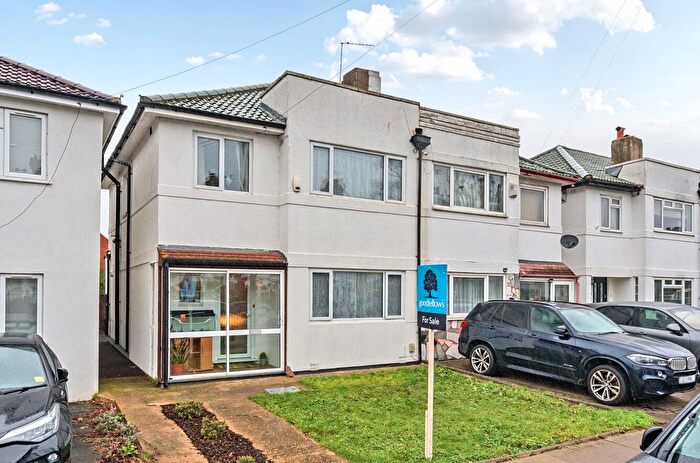
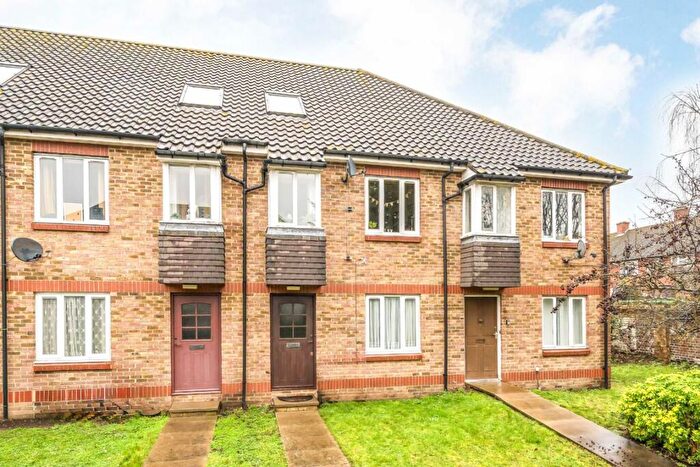
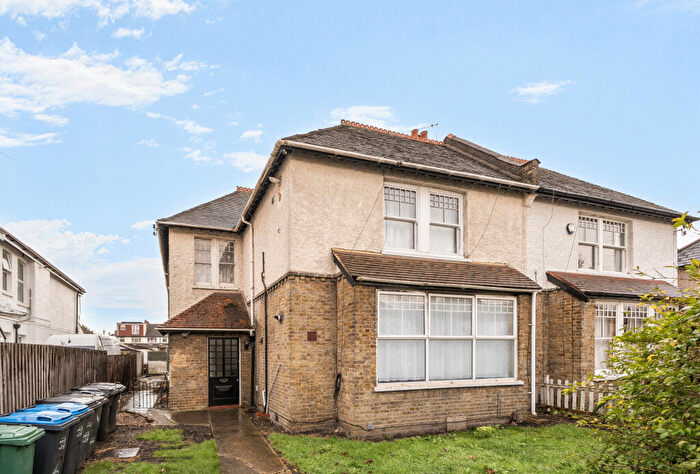
Houses for sale & to rent in Figges Marsh, Mitcham
House Prices in Figges Marsh
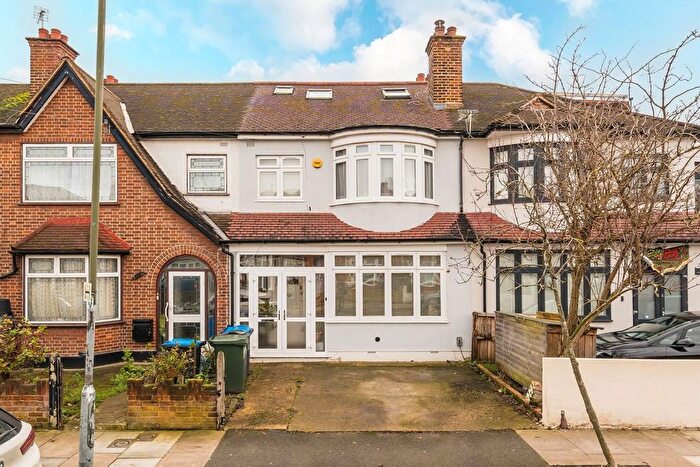
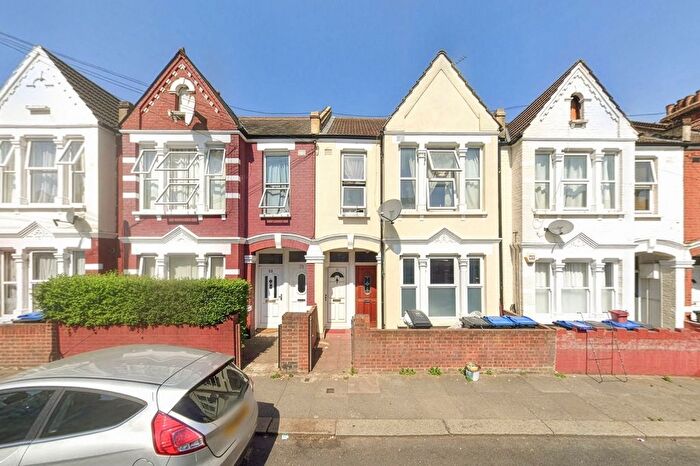
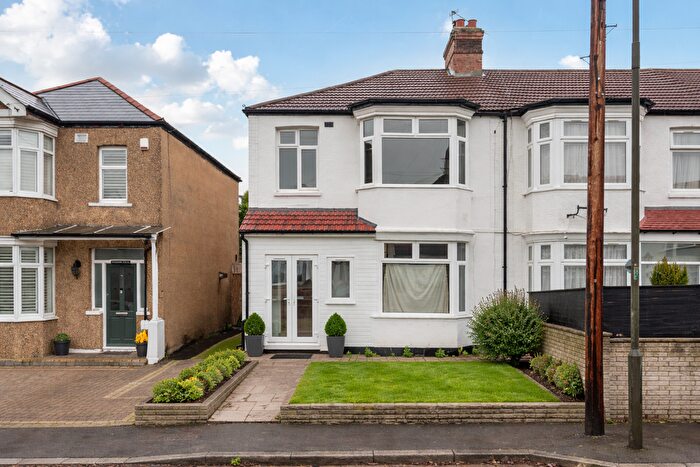
Properties in this part of Figges Marsh within Mitcham have an average house price of £382,847.52 and had 254 Property Transactions within the last 3 years¹. This area has 4,244 households² , where the most expensive property was sold for £825,000.00.
Properties for sale in Figges Marsh
Roads and Postcodes in Figges Marsh
Navigate through our locations to find the location of your next house in Figges Marsh, Mitcham for sale or to rent.
| Streets | Postcodes |
|---|---|
| Acacia Road | CR4 1SE CR4 1SF CR4 1SS CR4 1ST CR4 1SU |
| Albert Road | CR4 4AH CR4 4AL |
| Armfield Crescent | CR4 2JT CR4 2JU CR4 2JW CR4 2JY CR4 2JZ CR4 2FB CR4 2JJ |
| Aventine Avenue | CR4 1GB CR4 1GD CR4 1GE CR4 1GF |
| Baker Lane | CR4 2LG |
| Barnard Road | CR4 2LB |
| Beaulieu Close | CR4 2HH |
| Bedfont Close | CR4 2JR |
| Blenheim Business Centre | CR4 2JX |
| Brenley Close | CR4 1HL |
| Carew Road | CR4 2JH |
| Cedars Avenue | CR4 1EA CR4 1GA CR4 1HN |
| Chalkley Close | CR4 2LH |
| Clarendon Grove | CR4 2PH |
| Clay Avenue | CR4 1BS CR4 1BT CR4 1BU |
| Commonside East | CR4 1HA CR4 2QA CR4 2QB |
| Commonside West | CR4 4HA |
| Downe Road | CR4 2JL |
| Eastfields Road | CR4 2LS |
| Elm Cottages | CR4 2JG |
| Elmfield Avenue | CR4 2HL |
| Elmwood Road | CR4 4AD |
| Esher Mews | CR4 2QE |
| Esquiline Lane | CR4 1GG CR4 1GH CR4 1GL |
| Eveline Road | CR4 3GT |
| Feltham Road | CR4 2JQ |
| Fernlea Road | CR4 2HE CR4 2HF |
| Fir Tree Avenue | CR4 2JP |
| Fowler Road | CR4 2LQ |
| Framfield Road | CR4 2AL CR4 2AU CR4 2AW |
| Gaston Road | CR4 2LD |
| Graham Avenue | CR4 2HG CR4 2HJ |
| Graham Road | CR4 2HA CR4 2HB |
| Graveney Mews | CR4 2FD |
| Grove Road | CR4 1SA CR4 1SB |
| Guyatt Gardens | CR4 2LN |
| Hadrian Mews | CR4 1GJ |
| Hallowell Close | CR4 2QD |
| Hammond Avenue | CR4 1SR |
| Harbour Close | CR4 2GS |
| Hasty Close | CR4 2GD |
| Hilary Avenue | CR4 2LA |
| Holborn Way | CR4 3FG |
| Imperial Gardens | CR4 1ER |
| Jesmond Close | CR4 1EQ |
| Kennedy Close | CR4 2AR |
| Kings Road | CR4 1SN |
| Laburnum Road | CR4 2NA CR4 2NB CR4 2ND CR4 2NE CR4 2NG CR4 2NH CR4 2NX |
| Lammas Avenue | CR4 2LU CR4 2LW CR4 2LY CR4 2LZ |
| Langdale Avenue | CR4 4AE CR4 4AF CR4 4AG CR4 4AJ CR4 2YS |
| Lansdell Road | CR4 2JE CR4 2JF |
| Lea Cottages | CR4 2NT |
| Leather Close | CR4 2EX |
| London Road | CR4 2JB CR4 2JD CR4 3HD CR4 3NH CR4 2GH CR4 2JA CR4 2YR CR4 3PW CR4 3TA CR4 3UA |
| Majestic Way | CR4 2JS |
| Manship Road | CR4 2AY CR4 2AZ |
| Marsh Avenue | CR4 2JN |
| Monarch Parade | CR4 3HA CR4 3HB |
| Montrose Gardens | CR4 2PG CR4 2PJ |
| Moore Close | CR4 1BW |
| Mulholland Close | CR4 1SW CR4 1SX |
| Newman Terrace | CR4 2PL |
| Ormerod Gardens | CR4 2LP |
| Pains Close | CR4 1BY |
| Pearce Close | CR4 2GP |
| Pearson Way | CR4 2GE CR4 2GF |
| Pembroke Road | CR4 2LJ |
| Potter Close | CR4 1BX |
| Priestley Road | CR4 2LL |
| Proctor Close | CR4 2GX |
| Rialto Road | CR4 2LT |
| Roper Way | CR4 2LX |
| Sadler Close | CR4 3EG CR4 3EH CR4 3EJ CR4 3EL CR4 3HX |
| Sandy Lane | CR4 2HD CR4 2HX CR4 2YA |
| Sibthorp Road | CR4 3NN |
| Slade Way | CR4 2GA CR4 2GB |
| Spencer Road | CR4 1SG CR4 1SH CR4 1SJ |
| Spring Grove | CR4 2NN CR4 2NP CR4 2NQ |
| St Marks Road | CR4 2LF |
| Stainbank Road | CR4 1HR |
| Stepney Close | CR4 2GG |
| Streatham Road | CR4 2AA CR4 2AB CR4 2AD CR4 2AH |
| Summerhill Way | CR4 2NJ CR4 2NL |
| Tamworth Lane | CR4 1DA CR4 1DB CR4 1DG CR4 1DJ CR4 1GR |
| Thrupp Close | CR4 1BZ |
| Tide Close | CR4 2GL CR4 2GR CR4 2GN |
| Tonstall Road | CR4 2LR |
| Uckfield Grove | CR4 2AQ |
| Upper Green East | CR4 2PA CR4 2PB CR4 2PE CR4 2PF |
| Upper Green West | CR4 3AA |
| Whitford Gardens | CR4 4AA CR4 4AB |
| Worcester Close | CR4 1SP CR4 1SQ |
| CR4 1YG |
Transport near Figges Marsh
-
Mitcham Eastfields Station
-
Tooting Station
-
Mitcham Station
-
Mitcham Junction Station
-
Belgrave Walk Station
-
Phipps Bridge Station
-
Colliers Wood Station
-
Streatham Common Station
-
Beddington Lane Station
-
Tooting Broadway Station
- FAQ
- Price Paid By Year
- Property Type Price
Frequently asked questions about Figges Marsh
What is the average price for a property for sale in Figges Marsh?
The average price for a property for sale in Figges Marsh is £382,848. This amount is 7% lower than the average price in Mitcham. There are 2,270 property listings for sale in Figges Marsh.
What streets have the most expensive properties for sale in Figges Marsh?
The streets with the most expensive properties for sale in Figges Marsh are Graveney Mews at an average of £797,500, Hallowell Close at an average of £620,714 and Worcester Close at an average of £542,833.
What streets have the most affordable properties for sale in Figges Marsh?
The streets with the most affordable properties for sale in Figges Marsh are Summerhill Way at an average of £199,000, London Road at an average of £221,000 and Laburnum Road at an average of £235,000.
Which train stations are available in or near Figges Marsh?
Some of the train stations available in or near Figges Marsh are Mitcham Eastfields, Tooting and Mitcham Junction.
Which tube stations are available in or near Figges Marsh?
Some of the tube stations available in or near Figges Marsh are Colliers Wood and Tooting Broadway.
Property Price Paid in Figges Marsh by Year
The average sold property price by year was:
| Year | Average Sold Price | Price Change |
Sold Properties
|
|---|---|---|---|
| 2025 | £411,486 | 7% |
57 Properties |
| 2024 | £381,394.5 | 4% |
109 Properties |
| 2023 | £366,097 | -5% |
88 Properties |
| 2022 | £384,576 | 1% |
88 Properties |
| 2021 | £379,085.92 | -11% |
120 Properties |
| 2020 | £421,906.05 | 17% |
82 Properties |
| 2019 | £349,038 | 3% |
86 Properties |
| 2018 | £337,955 | 3% |
100 Properties |
| 2017 | £328,803 | 3% |
98 Properties |
| 2016 | £318,182 | 9% |
129 Properties |
| 2015 | £290,281 | 10% |
111 Properties |
| 2014 | £260,884 | 16% |
113 Properties |
| 2013 | £218,075 | 7% |
121 Properties |
| 2012 | £202,455 | 2% |
135 Properties |
| 2011 | £197,837 | 5% |
70 Properties |
| 2010 | £187,601 | 4% |
71 Properties |
| 2009 | £180,672 | -9% |
77 Properties |
| 2008 | £197,507 | -8% |
106 Properties |
| 2007 | £213,467 | 9% |
203 Properties |
| 2006 | £193,285 | 8% |
195 Properties |
| 2005 | £178,125 | 1% |
180 Properties |
| 2004 | £176,327.76 | 8% |
185 Properties |
| 2003 | £162,686 | 16% |
211 Properties |
| 2002 | £137,286 | 12% |
233 Properties |
| 2001 | £120,725 | 11% |
195 Properties |
| 2000 | £107,710 | 20% |
194 Properties |
| 1999 | £86,534 | 15% |
243 Properties |
| 1998 | £73,438 | 14% |
196 Properties |
| 1997 | £63,244 | 6% |
161 Properties |
| 1996 | £59,323 | -2% |
152 Properties |
| 1995 | £60,461 | - |
165 Properties |
Property Price per Property Type in Figges Marsh
Here you can find historic sold price data in order to help with your property search.
The average Property Paid Price for specific property types in the last three years are:
| Property Type | Average Sold Price | Sold Properties |
|---|---|---|
| Semi Detached House | £441,179.00 | 22 Semi Detached Houses |
| Terraced House | £448,242.09 | 122 Terraced Houses |
| Flat | £297,264.09 | 109 Flats |
| Detached House | £450,000.00 | 1 Detached House |

