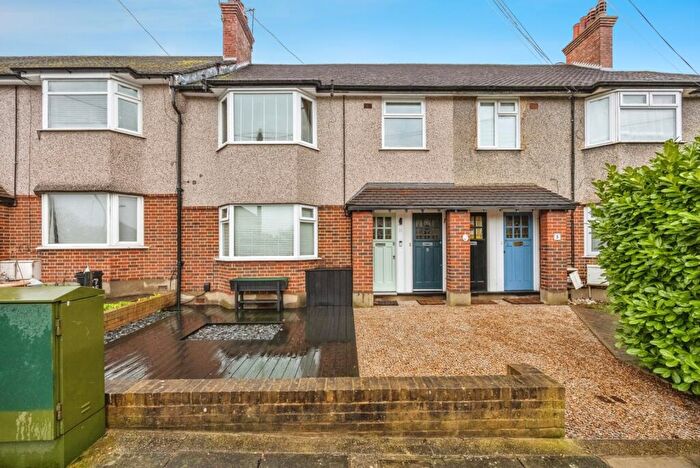
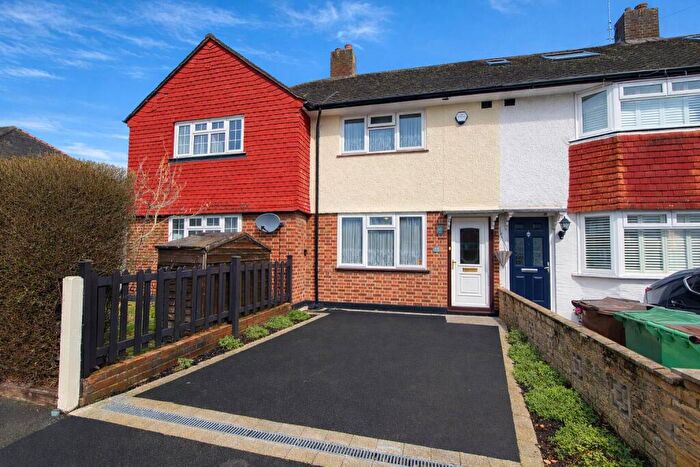
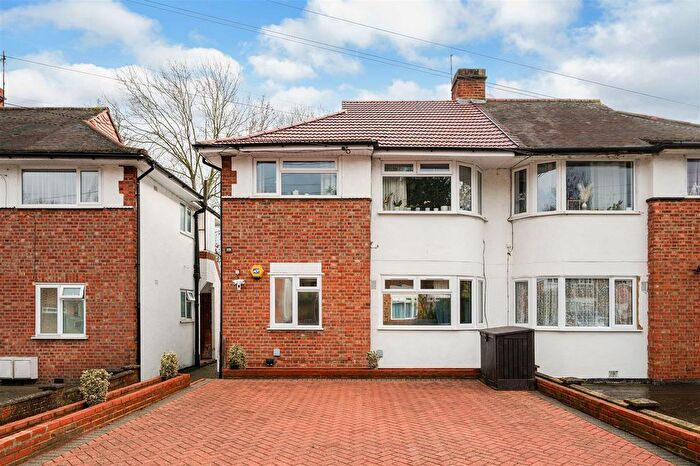
Houses for sale & to rent in Mitcham, Merton London Borough
House Prices in Mitcham
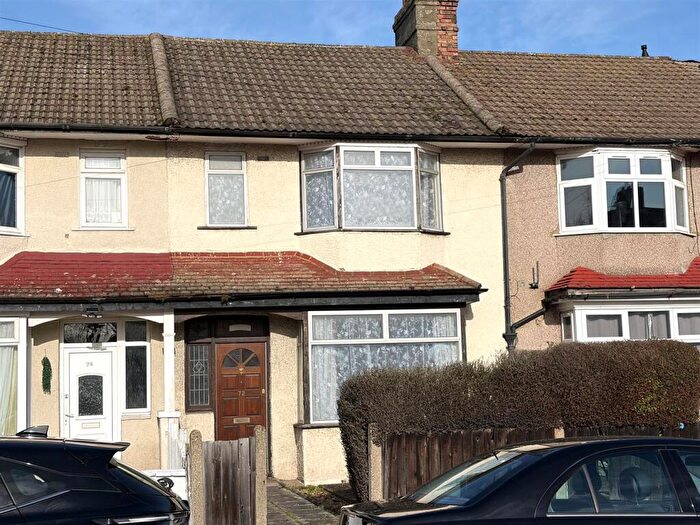
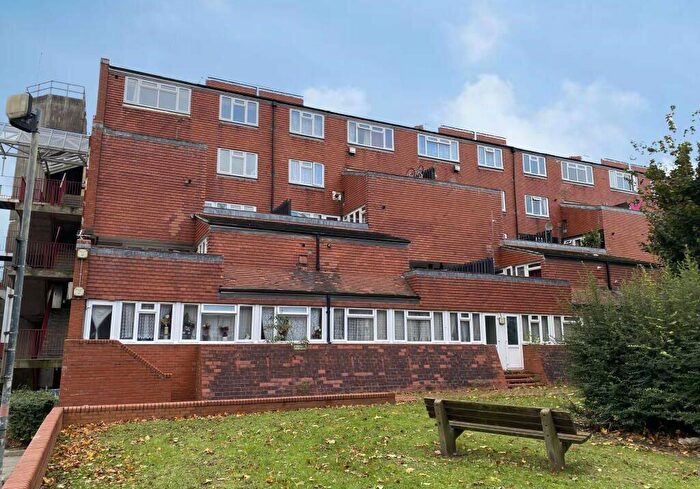
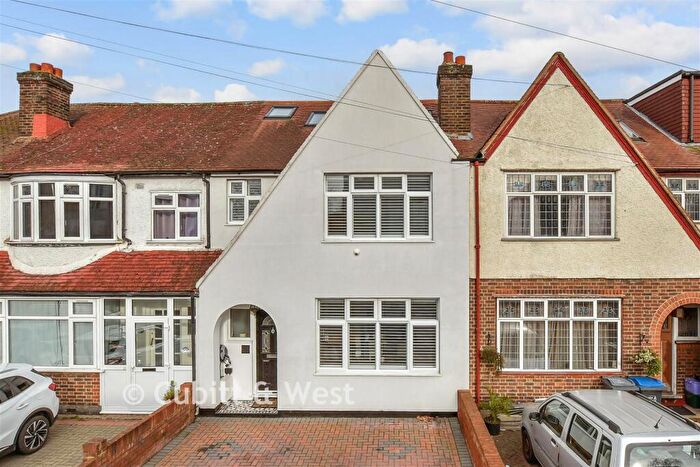
Properties in this part of Mitcham within the Merton London Borough have an average house price of £411,917.00 and had 1,293 Property Transactions within the last 3 years.¹ This area has 20,315 households² , where the most expensive property was sold for £1,200,000.00.
Properties for sale in Mitcham
Neighbourhoods in Mitcham
Navigate through our locations to find the location of your next house in Mitcham, Merton London Borough for sale or to rent.
Transport in Mitcham
Please see below transportation links in this area:
-
Mitcham Eastfields Station
-
Mitcham Station
-
Mitcham Junction Station
-
Belgrave Walk Station
-
Tooting Station
-
Phipps Bridge Station
-
Colliers Wood Station
-
Beddington Lane Station
-
Streatham Common Station
-
Morden Road Station
- FAQ
- Price Paid By Year
- Property Type Price
Frequently asked questions about Mitcham
What is the average price for a property for sale in Mitcham?
The average price for a property for sale in Mitcham is £411,917. This amount is 41% lower than the average price in Merton London Borough. There are more than 10,000 property listings for sale in Mitcham.
What locations have the most expensive properties for sale in Mitcham?
The locations with the most expensive properties for sale in Mitcham are Colliers Wood at an average of £563,043, Graveney at an average of £482,291 and Longthornton at an average of £431,863.
What locations have the most affordable properties for sale in Mitcham?
The locations with the most affordable properties for sale in Mitcham are Cricket Green at an average of £369,339, Ravensbury at an average of £370,426 and Figges Marsh at an average of £379,837.
Which train stations are available in or near Mitcham?
Some of the train stations available in or near Mitcham are Mitcham Eastfields, Mitcham Junction and Tooting.
Which tube stations are available in or near Mitcham?
The tube station available in or near Mitcham is Colliers Wood.
Property Price Paid in Mitcham by Year
The average sold property price by year was:
| Year | Average Sold Price | Price Change |
Sold Properties
|
|---|---|---|---|
| 2025 | £431,283 | 6% |
361 Properties |
| 2024 | £404,553 | 0,1% |
490 Properties |
| 2023 | £404,264 | -3% |
442 Properties |
| 2022 | £415,389 | 3% |
554 Properties |
| 2021 | £404,655 | 4% |
687 Properties |
| 2020 | £386,842 | 7% |
430 Properties |
| 2019 | £360,899 | 0,4% |
488 Properties |
| 2018 | £359,466 | 1% |
532 Properties |
| 2017 | £354,725 | 2% |
584 Properties |
| 2016 | £346,323 | 12% |
619 Properties |
| 2015 | £303,817 | 8% |
677 Properties |
| 2014 | £279,801 | 17% |
694 Properties |
| 2013 | £232,930 | 8% |
538 Properties |
| 2012 | £214,391 | 5% |
548 Properties |
| 2011 | £204,160 | -2% |
381 Properties |
| 2010 | £207,678 | 5% |
397 Properties |
| 2009 | £196,397 | -10% |
381 Properties |
| 2008 | £216,299 | 0,1% |
491 Properties |
| 2007 | £216,144 | 10% |
1,001 Properties |
| 2006 | £195,572 | 3% |
1,036 Properties |
| 2005 | £189,741 | 6% |
872 Properties |
| 2004 | £179,303 | 6% |
996 Properties |
| 2003 | £167,872 | 14% |
1,031 Properties |
| 2002 | £144,135 | 15% |
1,126 Properties |
| 2001 | £123,234 | 13% |
1,082 Properties |
| 2000 | £106,718 | 17% |
1,010 Properties |
| 1999 | £88,146 | 12% |
1,113 Properties |
| 1998 | £77,133 | 13% |
1,016 Properties |
| 1997 | £67,272 | 8% |
930 Properties |
| 1996 | £61,955 | 4% |
769 Properties |
| 1995 | £59,558 | - |
706 Properties |
Property Price per Property Type in Mitcham
Here you can find historic sold price data in order to help with your property search.
The average Property Paid Price for specific property types in the last three years are:
| Property Type | Average Sold Price | Sold Properties |
|---|---|---|
| Semi Detached House | £505,582.00 | 115 Semi Detached Houses |
| Detached House | £534,076.00 | 13 Detached Houses |
| Terraced House | £477,154.00 | 665 Terraced Houses |
| Flat | £300,432.00 | 500 Flats |

