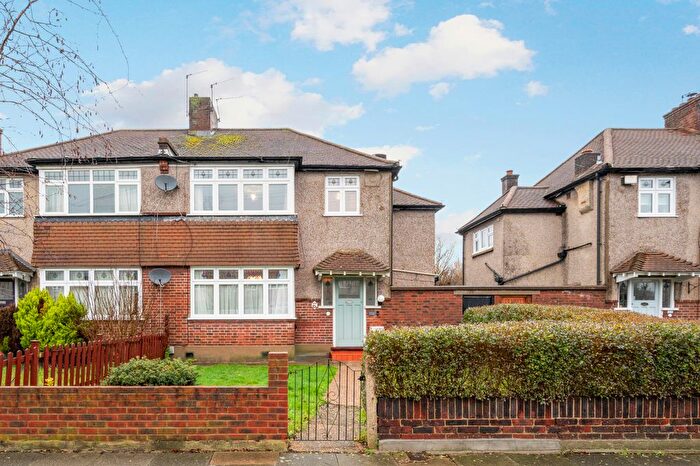
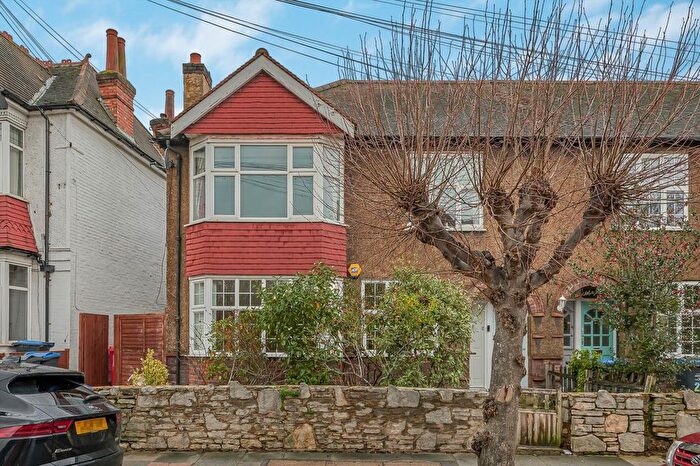
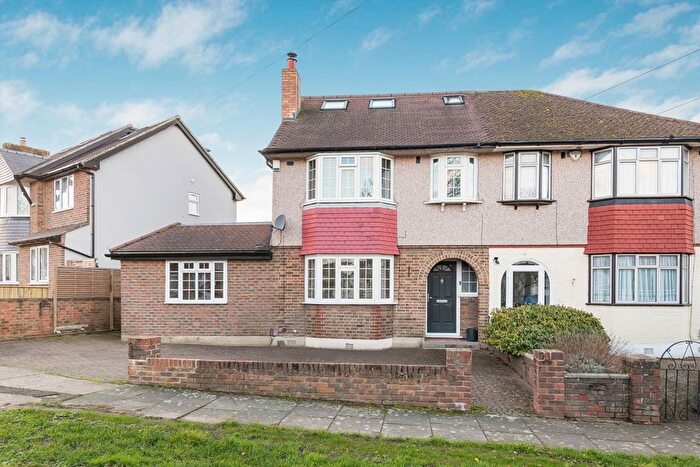
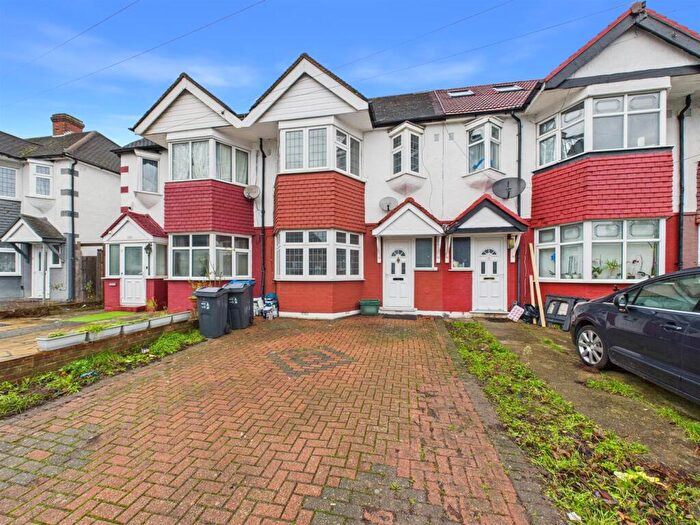
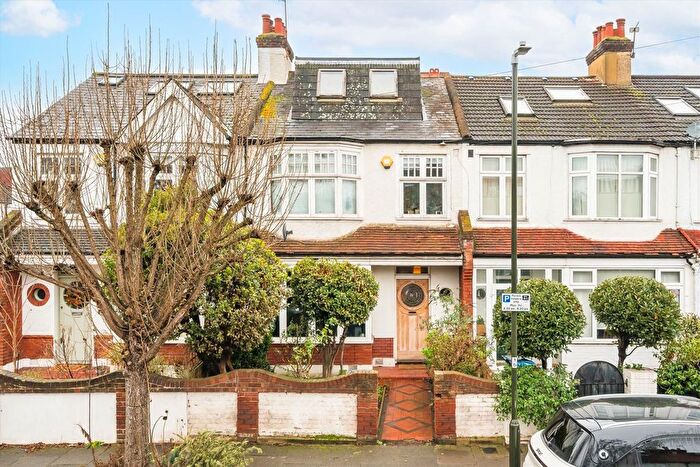
Houses for sale & to rent in Cannon Hill, Morden
House Prices in Cannon Hill
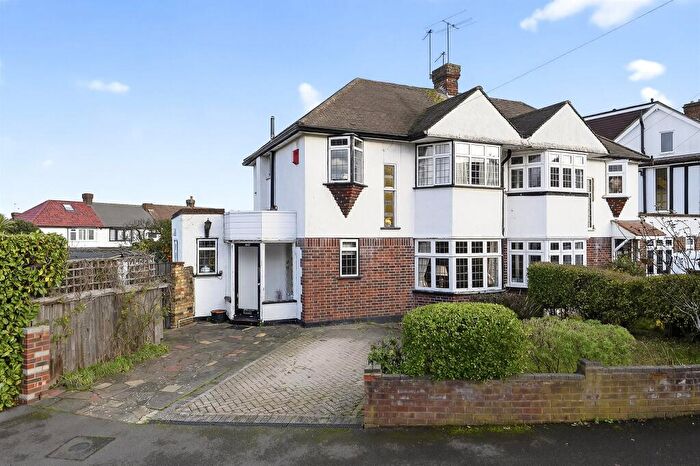
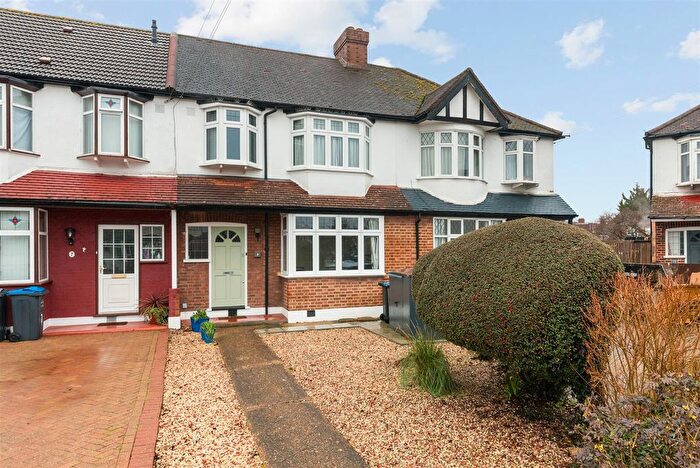
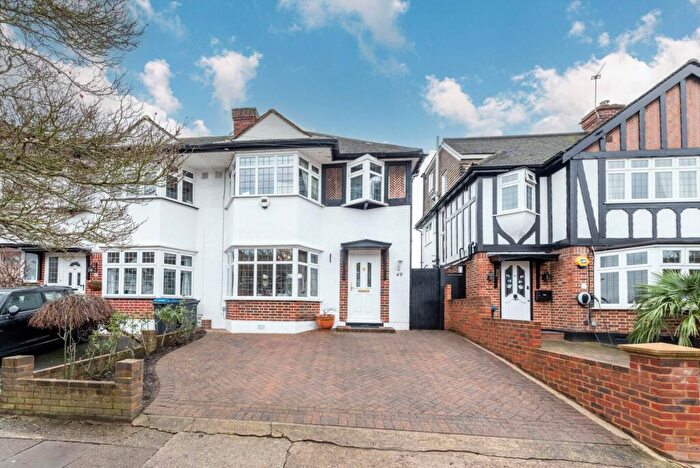
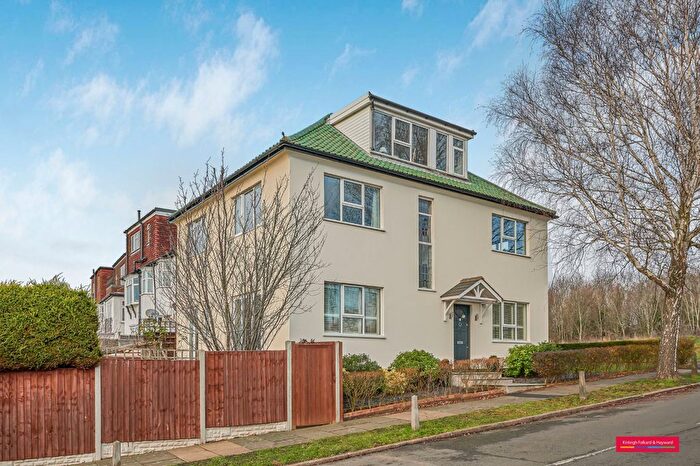
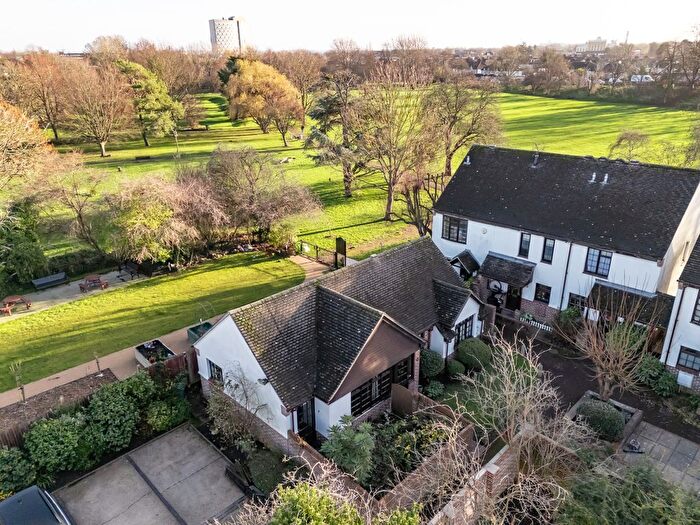
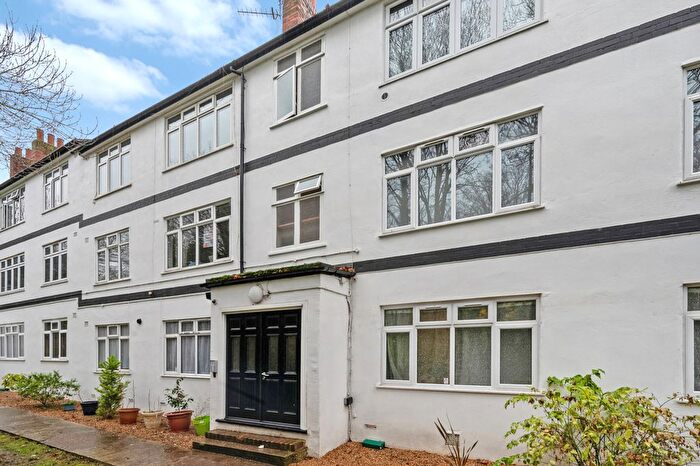
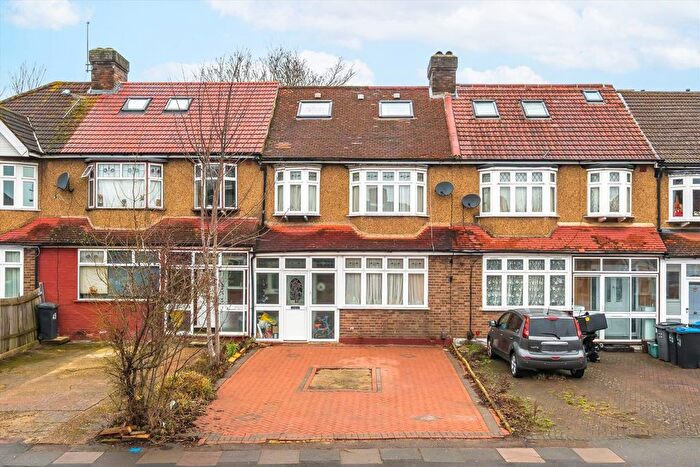
Properties in this part of Cannon Hill within Morden have an average house price of £632,014.00 and had 135 Property Transactions within the last 3 years¹. This area has 2,150 households² , where the most expensive property was sold for £960,000.00.
Properties for sale in Cannon Hill
Roads and Postcodes in Cannon Hill
Navigate through our locations to find the location of your next house in Cannon Hill, Morden for sale or to rent.
| Streets | Postcodes |
|---|---|
| Arundel Avenue | SM4 4DP SM4 4DR SM4 4DX |
| Ashridge Way | SM4 4ED SM4 4EF SM4 4EE |
| Cherry Close | SM4 4HA |
| Cherrywood Lane | SM4 4HB SM4 4HD SM4 4HQ SM4 4HS SM4 4HU |
| Churston Drive | SM4 4JB SM4 4JD SM4 4JE SM4 4JQ |
| Eastway | SM4 4HW SM4 4AD |
| Greenwood Close | SM4 4HX SM4 4HZ |
| Hillcross Avenue | SM4 4AT SM4 4AY SM4 4AZ SM4 4BU SM4 4BX SM4 4BY SM4 4EA SM4 4EB SM4 4EG SM4 4ET SM4 4EU |
| Hillside Close | SM4 4HH |
| Leamington Avenue | SM4 4DH SM4 4DN SM4 4DQ SM4 4DW |
| Links Avenue | SM4 4AE |
| London Road | SM4 5HE |
| Martin Way | SM4 4AG SM4 4AH SM4 4AN SM4 4AR SM4 4AW SM4 4AJ |
| Maycross Avenue | SM4 4DA SM4 4DB SM4 4DD SM4 4DF |
| Monkleigh Road | SM4 4EL SM4 4EN SM4 4EP SM4 4EQ SM4 4ER SM4 4ES SM4 4EW |
| Mossville Gardens | SM4 4DG |
| North Close | SM4 4HG |
| Northenhay Walk | SM4 4BS |
| Northway | SM4 4HE SM4 4HF |
| Shaldon Drive | SM4 4BB SM4 4BE SM4 4BH SM4 4BP SM4 4BQ |
| Templecombe Way | SM4 4JF SM4 4JG |
| The Green | SM4 4HJ SM4 4HL |
| Thurleston Avenue | SM4 4BN SM4 4BW |
| Westcroft Gardens | SM4 4DJ SM4 4DL |
| Woodland Way | SM4 4DS |
Transport near Cannon Hill
-
South Merton Station
-
Morden South Station
-
Wimbledon Chase Station
-
Morden Station
-
St Helier Station
-
Raynes Park Station
-
Morden Road Station
-
Merton Park Station
-
Motspur Park Station
-
Dundonald Road Station
- FAQ
- Price Paid By Year
- Property Type Price
Frequently asked questions about Cannon Hill
What is the average price for a property for sale in Cannon Hill?
The average price for a property for sale in Cannon Hill is £632,014. This amount is 29% higher than the average price in Morden. There are 1,809 property listings for sale in Cannon Hill.
What streets have the most expensive properties for sale in Cannon Hill?
The streets with the most expensive properties for sale in Cannon Hill are North Close at an average of £776,666, Arundel Avenue at an average of £756,200 and Ashridge Way at an average of £735,000.
What streets have the most affordable properties for sale in Cannon Hill?
The streets with the most affordable properties for sale in Cannon Hill are Martin Way at an average of £335,803, Templecombe Way at an average of £592,125 and Shaldon Drive at an average of £599,735.
Which train stations are available in or near Cannon Hill?
Some of the train stations available in or near Cannon Hill are South Merton, Morden South and Wimbledon Chase.
Which tube stations are available in or near Cannon Hill?
The tube station available in or near Cannon Hill is Morden.
Property Price Paid in Cannon Hill by Year
The average sold property price by year was:
| Year | Average Sold Price | Price Change |
Sold Properties
|
|---|---|---|---|
| 2025 | £623,853 | 0,2% |
27 Properties |
| 2024 | £622,486 | -4% |
58 Properties |
| 2023 | £647,475 | -1% |
50 Properties |
| 2022 | £652,326 | 6% |
61 Properties |
| 2021 | £611,708 | 9% |
87 Properties |
| 2020 | £559,059 | 6% |
54 Properties |
| 2019 | £528,196 | -1% |
71 Properties |
| 2018 | £534,704 | 3% |
49 Properties |
| 2017 | £520,999 | 3% |
64 Properties |
| 2016 | £505,994 | 6% |
63 Properties |
| 2015 | £476,510 | 6% |
91 Properties |
| 2014 | £449,830 | 16% |
86 Properties |
| 2013 | £376,424 | 10% |
76 Properties |
| 2012 | £340,139 | 4% |
85 Properties |
| 2011 | £325,383 | 8% |
56 Properties |
| 2010 | £300,340 | 9% |
51 Properties |
| 2009 | £273,345 | -12% |
53 Properties |
| 2008 | £305,914 | -2% |
48 Properties |
| 2007 | £311,416 | 13% |
104 Properties |
| 2006 | £272,010 | 9% |
102 Properties |
| 2005 | £248,005 | -1% |
69 Properties |
| 2004 | £249,518 | 8% |
95 Properties |
| 2003 | £230,407 | 8% |
98 Properties |
| 2002 | £211,777 | 18% |
93 Properties |
| 2001 | £174,267 | 8% |
107 Properties |
| 2000 | £160,021 | 13% |
69 Properties |
| 1999 | £138,779 | 13% |
95 Properties |
| 1998 | £121,033 | 15% |
85 Properties |
| 1997 | £102,541 | 13% |
86 Properties |
| 1996 | £89,501 | 1% |
88 Properties |
| 1995 | £88,446 | - |
79 Properties |
Property Price per Property Type in Cannon Hill
Here you can find historic sold price data in order to help with your property search.
The average Property Paid Price for specific property types in the last three years are:
| Property Type | Average Sold Price | Sold Properties |
|---|---|---|
| Semi Detached House | £665,951.00 | 40 Semi Detached Houses |
| Detached House | £785,000.00 | 1 Detached House |
| Terraced House | £646,404.00 | 84 Terraced Houses |
| Flat | £360,100.00 | 10 Flats |

