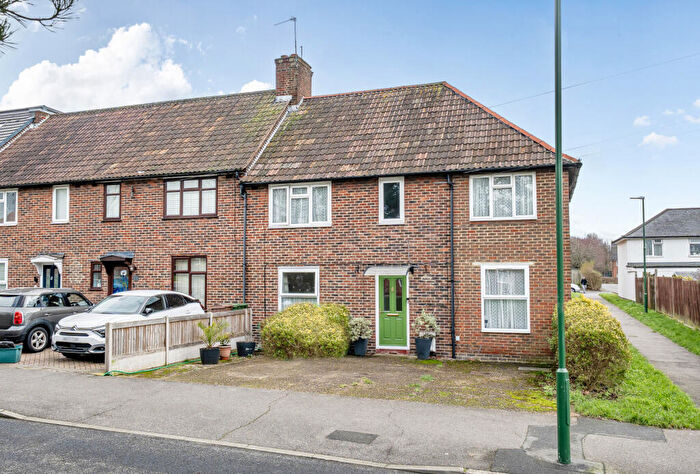
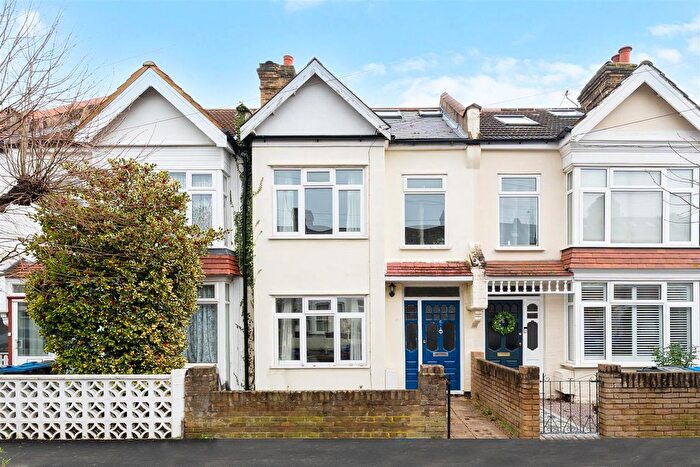
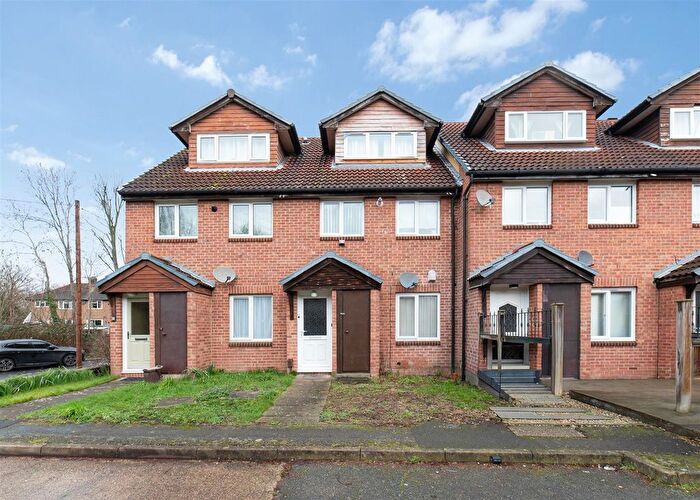
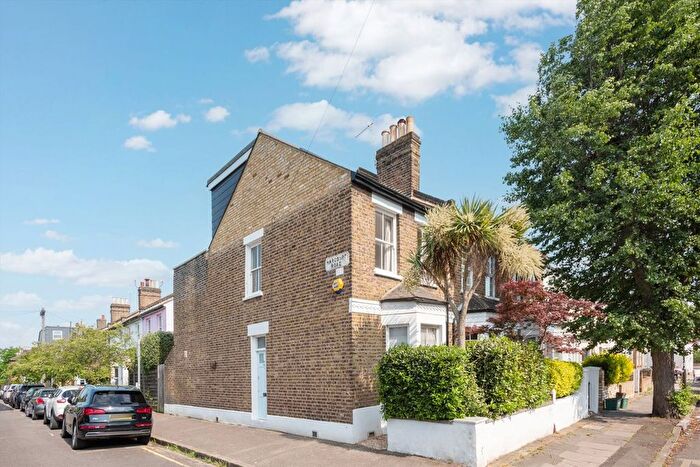
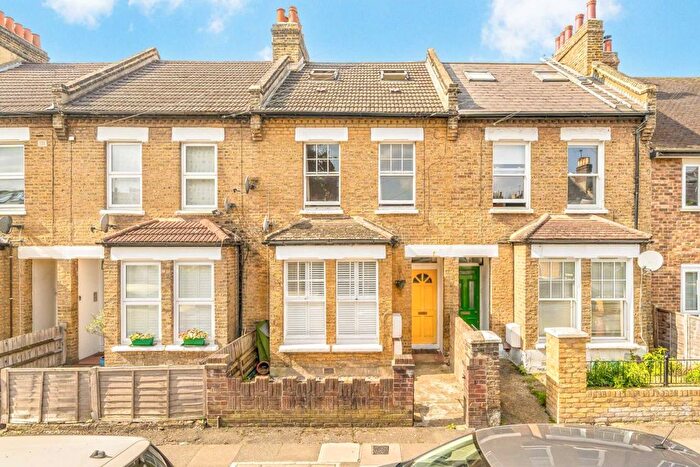
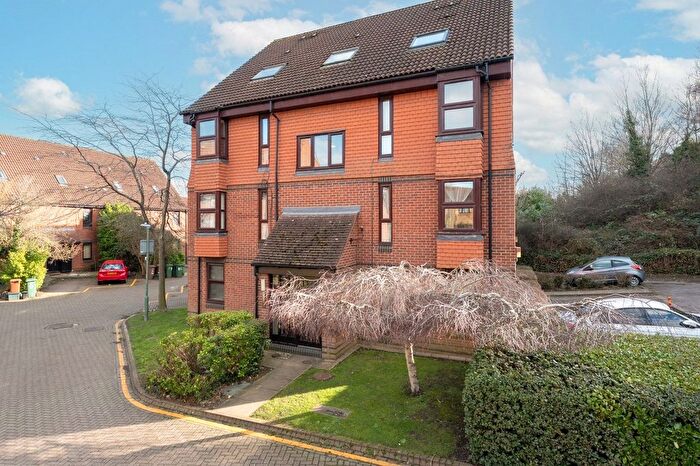
Houses for sale & to rent in Morden, Merton London Borough
House Prices in Morden
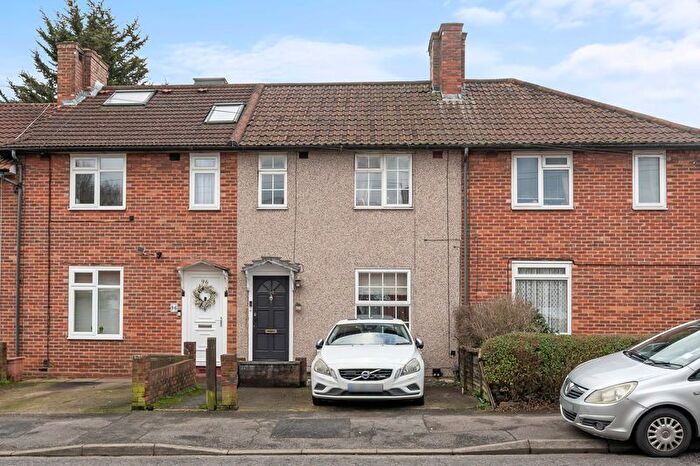
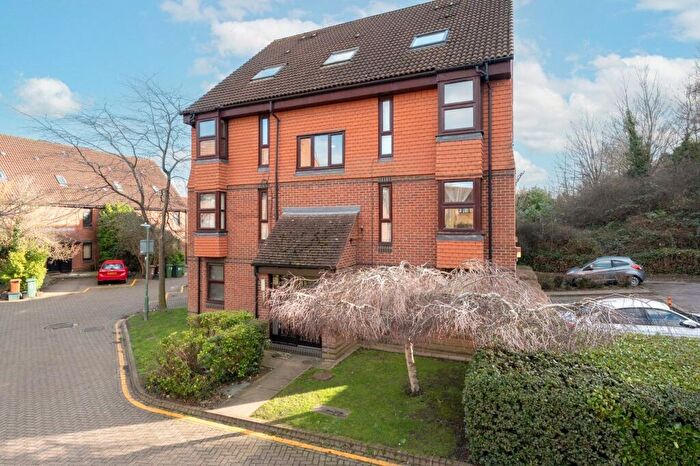
Properties in this part of Morden within the Merton London Borough have an average house price of £491,877.00 and had 935 Property Transactions within the last 3 years.¹ This area has 12,658 households² , where the most expensive property was sold for £2,224,900.00.
Properties for sale in Morden
Neighbourhoods in Morden
Navigate through our locations to find the location of your next house in Morden, Merton London Borough for sale or to rent.
Transport in Morden
Please see below transportation links in this area:
-
Morden South Station
-
St Helier Station
-
Morden Station
-
South Merton Station
-
Phipps Bridge Station
-
Belgrave Walk Station
-
Morden Road Station
-
Wimbledon Chase Station
-
Sutton Common Station
-
Mitcham Station
- FAQ
- Price Paid By Year
- Property Type Price
Frequently asked questions about Morden
What is the average price for a property for sale in Morden?
The average price for a property for sale in Morden is £491,877. This amount is 30% lower than the average price in Merton London Borough. There are 8,960 property listings for sale in Morden.
What locations have the most expensive properties for sale in Morden?
The locations with the most expensive properties for sale in Morden are Cannon Hill at an average of £628,384, Lower Morden at an average of £512,923 and Ravensbury at an average of £457,560.
What locations have the most affordable properties for sale in Morden?
The locations with the most affordable properties for sale in Morden are Merton Park at an average of £439,216 and St Helier at an average of £442,365.
Which train stations are available in or near Morden?
Some of the train stations available in or near Morden are Morden South, St Helier and South Merton.
Which tube stations are available in or near Morden?
The tube station available in or near Morden is Morden.
Property Price Paid in Morden by Year
The average sold property price by year was:
| Year | Average Sold Price | Price Change |
Sold Properties
|
|---|---|---|---|
| 2025 | £497,192 | 0,2% |
254 Properties |
| 2024 | £496,364 | 3% |
355 Properties |
| 2023 | £482,850 | 1% |
326 Properties |
| 2022 | £477,529 | 2% |
361 Properties |
| 2021 | £465,883 | 6% |
486 Properties |
| 2020 | £437,336 | 5% |
330 Properties |
| 2019 | £413,370 | -2% |
388 Properties |
| 2018 | £419,666 | 0,2% |
327 Properties |
| 2017 | £418,858 | 4% |
409 Properties |
| 2016 | £400,911 | 9% |
409 Properties |
| 2015 | £364,314 | 10% |
492 Properties |
| 2014 | £327,038 | 15% |
506 Properties |
| 2013 | £278,145 | 4% |
482 Properties |
| 2012 | £266,209 | 8% |
415 Properties |
| 2011 | £243,981 | 1% |
375 Properties |
| 2010 | £241,413 | 7% |
394 Properties |
| 2009 | £225,306 | -17% |
305 Properties |
| 2008 | £264,122 | 4% |
275 Properties |
| 2007 | £253,012 | 10% |
692 Properties |
| 2006 | £228,716 | 6% |
630 Properties |
| 2005 | £213,967 | 4% |
539 Properties |
| 2004 | £204,654 | 6% |
608 Properties |
| 2003 | £191,610 | 12% |
599 Properties |
| 2002 | £169,471 | 15% |
634 Properties |
| 2001 | £144,307 | 8% |
706 Properties |
| 2000 | £132,198 | 19% |
565 Properties |
| 1999 | £106,742 | 9% |
625 Properties |
| 1998 | £97,443 | 15% |
536 Properties |
| 1997 | £82,654 | 9% |
573 Properties |
| 1996 | £75,408 | 1% |
485 Properties |
| 1995 | £74,697 | - |
432 Properties |
Property Price per Property Type in Morden
Here you can find historic sold price data in order to help with your property search.
The average Property Paid Price for specific property types in the last three years are:
| Property Type | Average Sold Price | Sold Properties |
|---|---|---|
| Semi Detached House | £593,309.00 | 166 Semi Detached Houses |
| Detached House | £676,489.00 | 23 Detached Houses |
| Terraced House | £525,657.00 | 535 Terraced Houses |
| Flat | £306,305.00 | 211 Flats |

