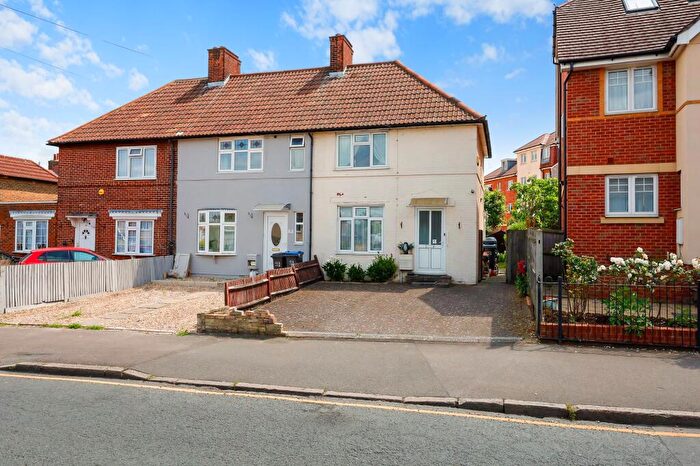
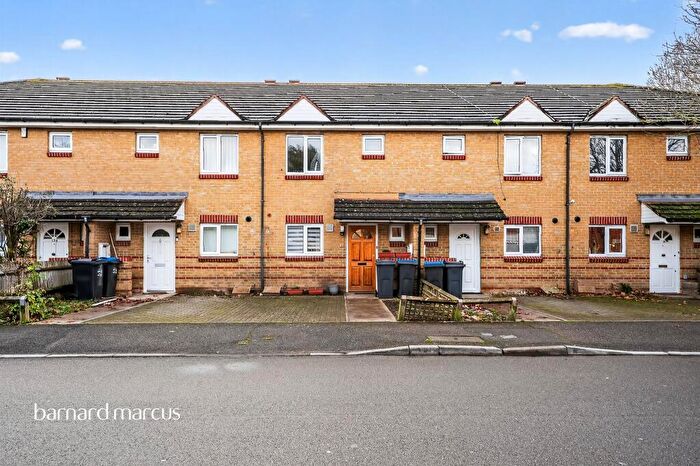
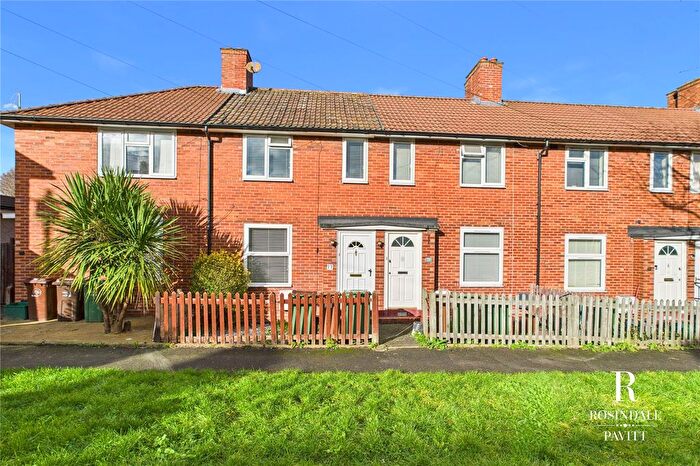
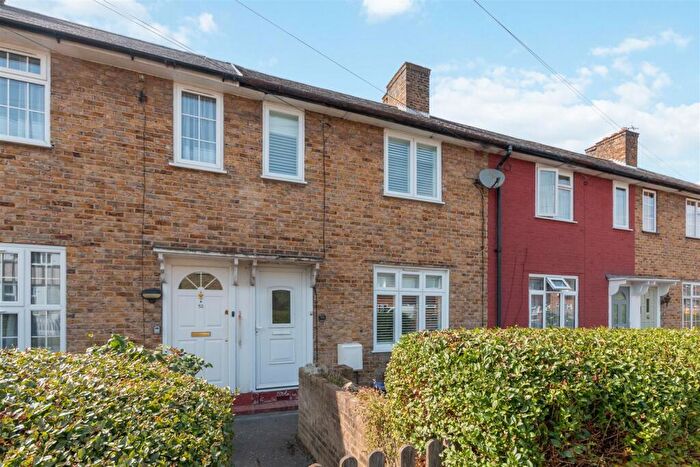
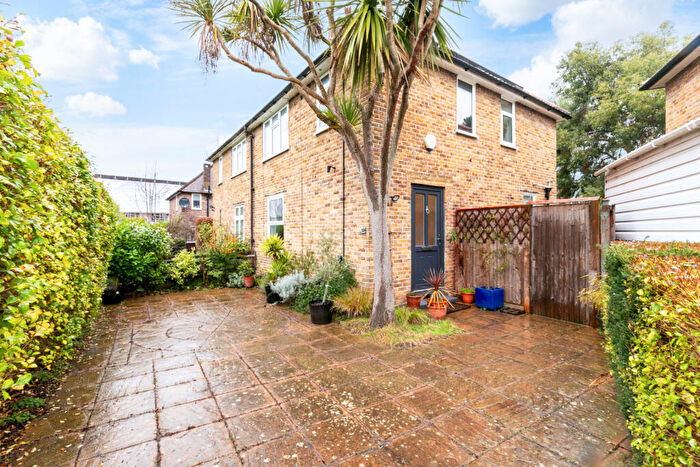
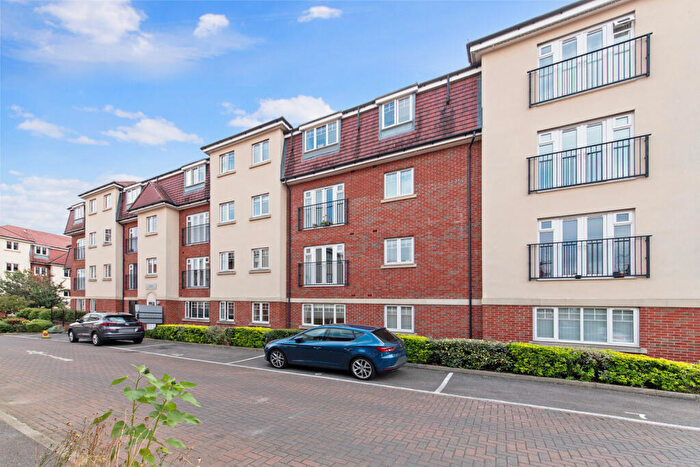
Houses for sale & to rent in Ravensbury, Morden
House Prices in Ravensbury
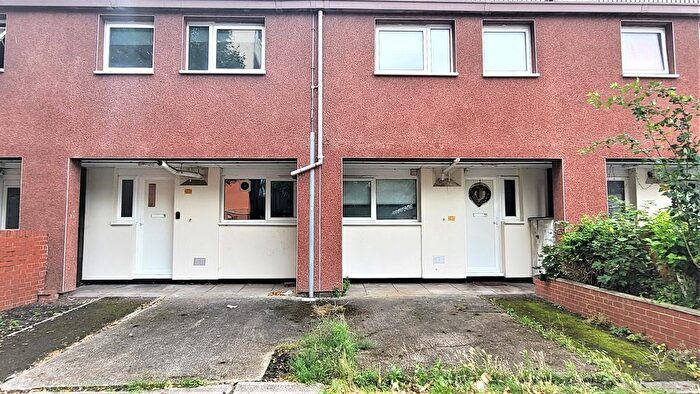
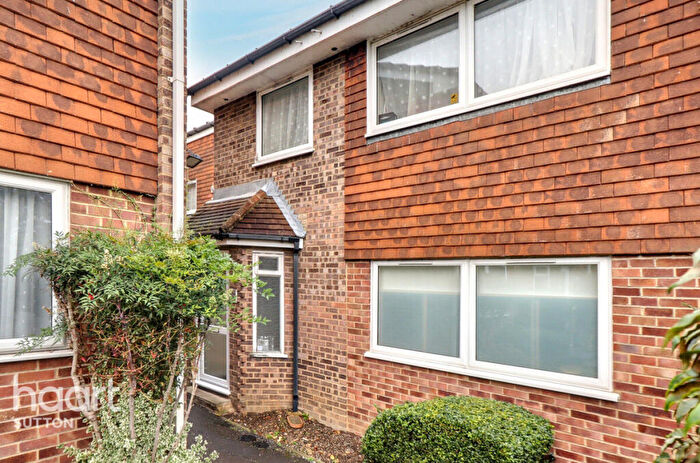
Properties in this part of Ravensbury within Morden have an average house price of £457,266.00 and had 188 Property Transactions within the last 3 years¹. This area has 2,735 households² , where the most expensive property was sold for £900,000.00.
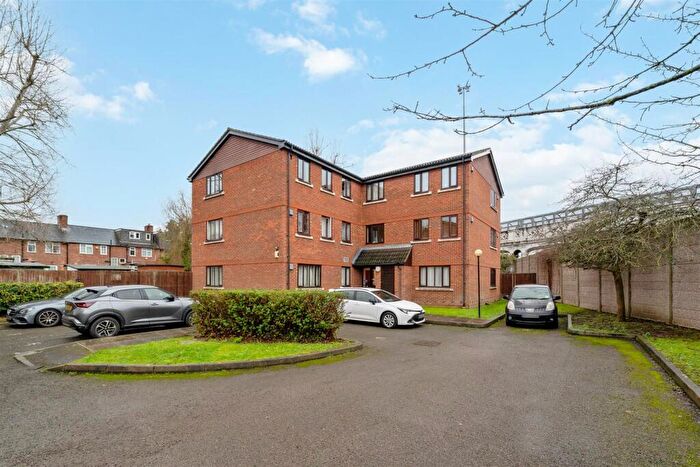
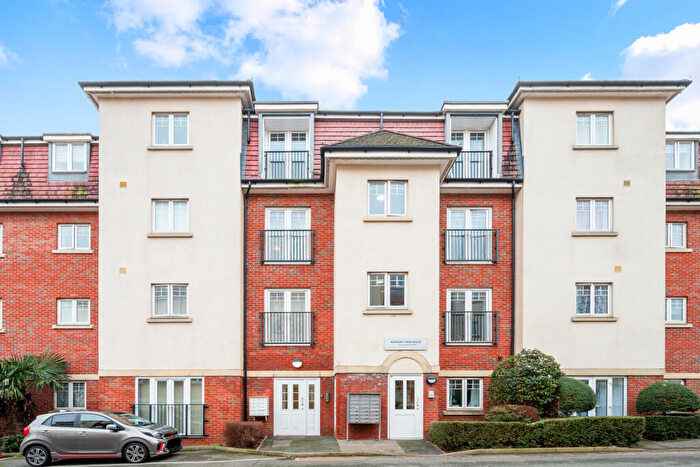
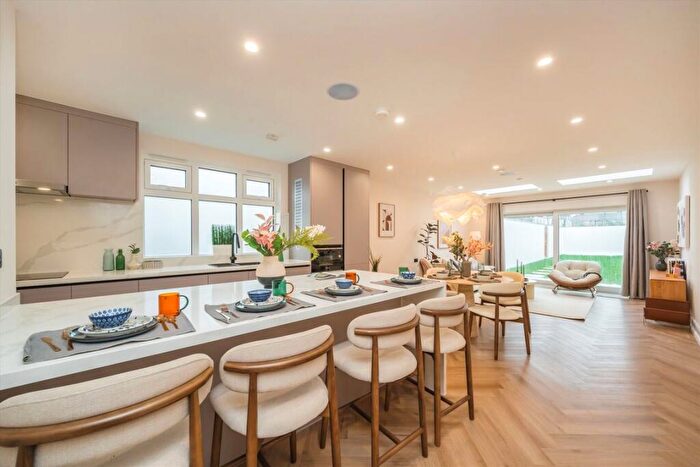
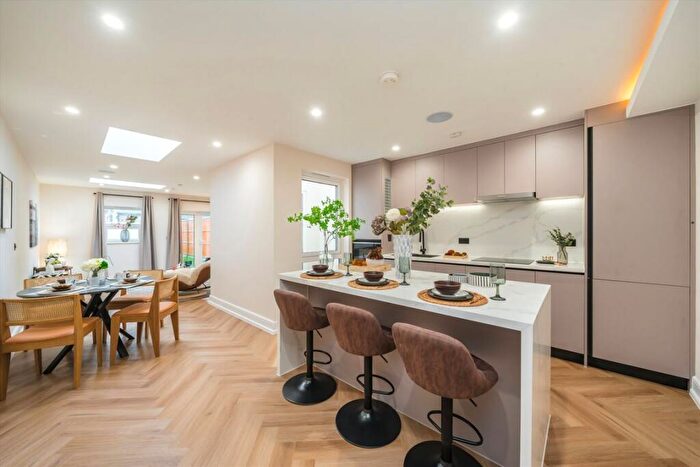
Properties for sale in Ravensbury
Roads and Postcodes in Ravensbury
Navigate through our locations to find the location of your next house in Ravensbury, Morden for sale or to rent.
| Streets | Postcodes |
|---|---|
| Abbotsbury Road | SM4 5LB SM4 5LJ SM4 5LQ SM4 5LH |
| Aberconway Road | SM4 5LF SM4 5LN |
| Arbuthnot Road | SM4 6FF |
| Arras Avenue | SM4 6DD SM4 6DF SM4 6DG |
| Bardney Road | SM4 5JL SM4 5JN |
| Bayham Road | SM4 5JH SM4 5JQ |
| Beeleigh Road | SM4 5JP SM4 5JW |
| Bindon Green | SM4 5JJ |
| Bishopsford Road | SM4 6AW SM4 6AX SM4 6BB SM4 6BE SM4 6BT SM4 6BU SM4 6BX SM4 6BY SM4 6BZ SM4 6DA SM4 6AL SM4 6AN SM4 6BF SM4 6BP |
| Boxley Road | SM4 6JB |
| Connaught Gardens | SM4 6DB |
| Edward Avenue | SM4 6EP |
| Florence Avenue | SM4 6EX |
| Freeman Road | SM4 6AR |
| Gavina Close | SM4 6AY |
| Johns Lane | SM4 6EU |
| Langdon Road | SM4 6HA |
| Langdon Walk | SM4 6EZ |
| Leominster Road | SM4 6HN SM4 6HT |
| Leominster Walk | SM4 6HB |
| Leonard Avenue | SM4 6DW |
| Lessness Road | SM4 6HP |
| Lilleshall Road | SM4 6DR SM4 6DS SM4 6DT SM4 6DU |
| Llanthony Road | SM4 6DX |
| London Road | SM4 5HT SM4 5HX |
| Malling Gardens | SM4 6JG |
| Malmesbury Road | SM4 6HD SM4 6HE SM4 6HF SM4 6HG SM4 6HH |
| Marham Gardens | SM4 6JJ |
| Melsa Road | SM4 6JQ |
| Merevale Crescent | SM4 6HL |
| Middleton Road | SM4 6RG SM4 6RH SM4 6RN SM4 6RR SM4 6RW SM4 6RZ |
| Milner Road | SM4 6EN |
| Missenden Gardens | SM4 6HW |
| Montacute Road | SM4 6RJ SM4 6RL |
| Morden Hall Road | SM4 5JF SM4 5JG SM4 5JA SM4 5JD |
| Morton Road | SM4 6EF |
| Muchelney Road | SM4 6HU |
| Neath Gardens | SM4 6JN |
| Netley Gardens | SM4 6JW |
| Netley Road | SM4 6JP |
| Newhouse Walk | SM4 6BS |
| Newminster Road | SM4 6HJ |
| Pollard Road | SM4 6EB SM4 6EG SM4 6EH SM4 6EJ SM4 6EQ |
| Ravensbury Avenue | SM4 6ET |
| Rose Avenue | SM4 6DE |
| Seddon Road | SM4 6ED SM4 6EE SM4 6EL SM4 6EW |
| St Helier Avenue | SM4 6HQ SM4 6HY SM4 6JD SM4 6JE SM4 6JF SM4 6JH SM4 6JL SM4 6JR |
| The Drive | SM4 6DH SM4 6DJ SM4 6DN SM4 6DP SM4 6DQ SM4 6DY |
| The Meads | SM4 6AH |
| Victory Avenue | SM4 6DL |
| Wandle Road | SM4 6AA SM4 6AB SM4 6AD SM4 6AE SM4 6AF SM4 6AG SM4 6AJ SM4 6AQ SM4 6AU |
| Williams Lane | SM4 6EY |
Transport near Ravensbury
-
Belgrave Walk Station
-
Mitcham Station
-
Phipps Bridge Station
-
Morden South Station
-
St Helier Station
-
Morden Station
-
Morden Road Station
-
South Merton Station
-
Mitcham Junction Station
-
Sutton Common Station
- FAQ
- Price Paid By Year
- Property Type Price
Frequently asked questions about Ravensbury
What is the average price for a property for sale in Ravensbury?
The average price for a property for sale in Ravensbury is £457,266. This amount is 7% lower than the average price in Morden. There are 1,482 property listings for sale in Ravensbury.
What streets have the most expensive properties for sale in Ravensbury?
The streets with the most expensive properties for sale in Ravensbury are Victory Avenue at an average of £760,000, Johns Lane at an average of £669,000 and Rose Avenue at an average of £655,000.
What streets have the most affordable properties for sale in Ravensbury?
The streets with the most affordable properties for sale in Ravensbury are The Meads at an average of £233,750, Lilleshall Road at an average of £286,250 and Morden Hall Road at an average of £366,666.
Which train stations are available in or near Ravensbury?
Some of the train stations available in or near Ravensbury are Morden South, St Helier and South Merton.
Which tube stations are available in or near Ravensbury?
The tube station available in or near Ravensbury is Morden.
Property Price Paid in Ravensbury by Year
The average sold property price by year was:
| Year | Average Sold Price | Price Change |
Sold Properties
|
|---|---|---|---|
| 2025 | £494,082 | 6% |
44 Properties |
| 2024 | £462,735 | 7% |
68 Properties |
| 2023 | £431,059 | -7% |
76 Properties |
| 2022 | £459,536 | 7% |
76 Properties |
| 2021 | £426,592 | 7% |
92 Properties |
| 2020 | £395,600 | 3% |
64 Properties |
| 2019 | £384,769 | 0,1% |
77 Properties |
| 2018 | £384,258 | 4% |
66 Properties |
| 2017 | £369,055 | -3% |
86 Properties |
| 2016 | £381,878 | 11% |
90 Properties |
| 2015 | £340,142 | 9% |
91 Properties |
| 2014 | £309,560 | 13% |
97 Properties |
| 2013 | £268,143 | 9% |
87 Properties |
| 2012 | £243,327 | 9% |
67 Properties |
| 2011 | £222,283 | -5% |
68 Properties |
| 2010 | £233,071 | 13% |
69 Properties |
| 2009 | £201,801 | -15% |
76 Properties |
| 2008 | £231,183 | 1% |
61 Properties |
| 2007 | £228,887 | 8% |
155 Properties |
| 2006 | £210,217 | 6% |
128 Properties |
| 2005 | £198,113 | 6% |
117 Properties |
| 2004 | £187,171 | 10% |
128 Properties |
| 2003 | £168,578 | 11% |
123 Properties |
| 2002 | £150,661 | 13% |
129 Properties |
| 2001 | £131,201 | 7% |
161 Properties |
| 2000 | £122,622 | 23% |
131 Properties |
| 1999 | £94,803 | 7% |
133 Properties |
| 1998 | £88,073 | 16% |
111 Properties |
| 1997 | £73,657 | 2% |
143 Properties |
| 1996 | £72,130 | 3% |
103 Properties |
| 1995 | £69,934 | - |
118 Properties |
Property Price per Property Type in Ravensbury
Here you can find historic sold price data in order to help with your property search.
The average Property Paid Price for specific property types in the last three years are:
| Property Type | Average Sold Price | Sold Properties |
|---|---|---|
| Semi Detached House | £577,283.00 | 37 Semi Detached Houses |
| Detached House | £610,623.00 | 15 Detached Houses |
| Terraced House | £472,825.00 | 83 Terraced Houses |
| Flat | £305,712.00 | 53 Flats |

