
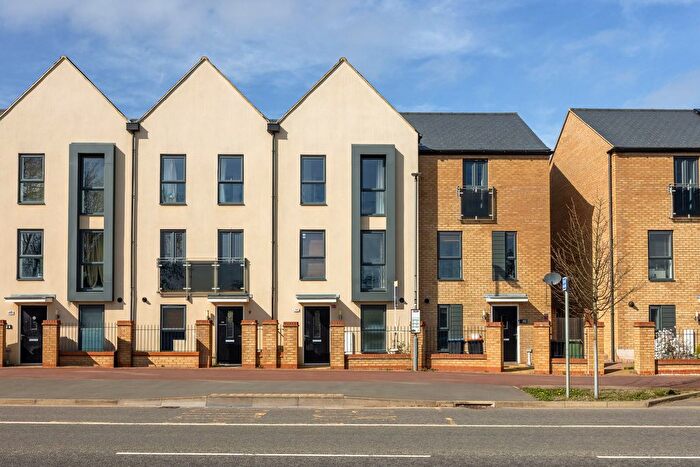
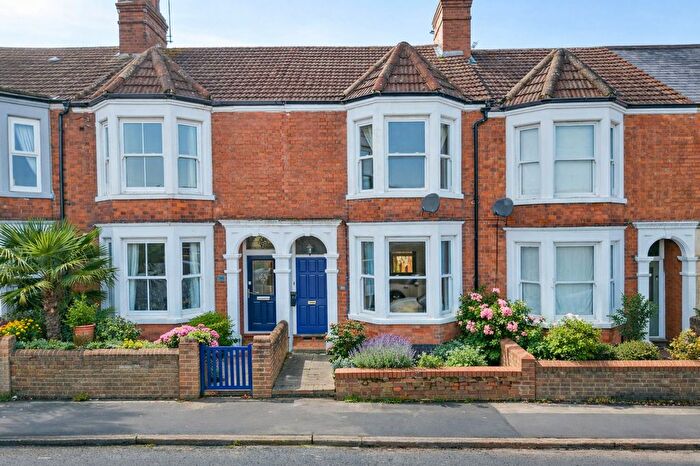
Houses for sale & to rent in Bradwell, Milton Keynes
House Prices in Bradwell
Properties in Bradwell have an average house price of £303k and had 374 Property Transactions within the last 3 years¹.
Bradwell is an area in Milton Keynes, Milton Keynes with 5,431 households², where the most expensive property was sold for £860k.
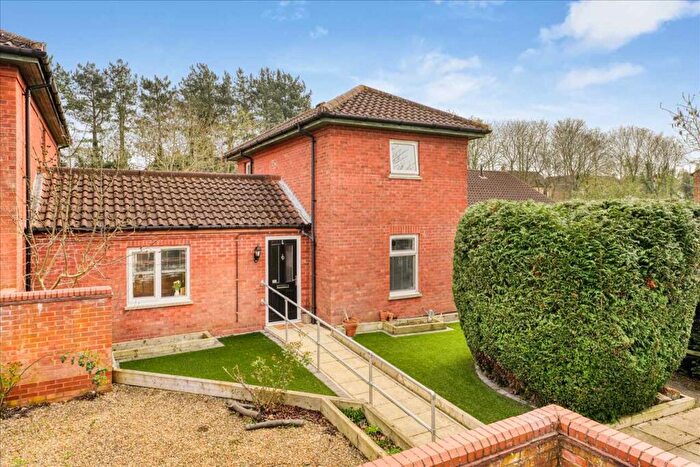
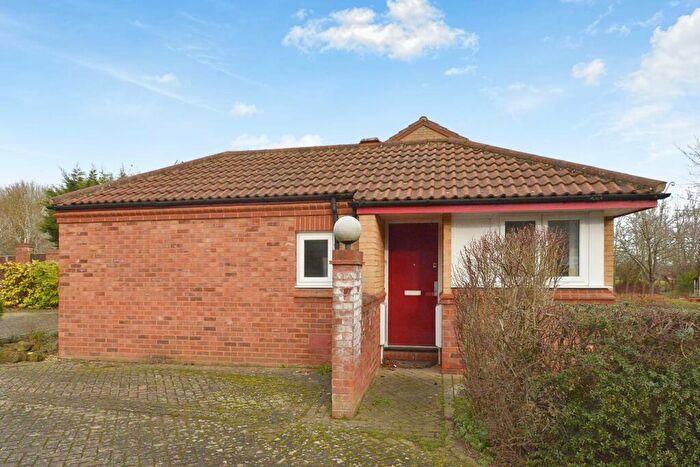
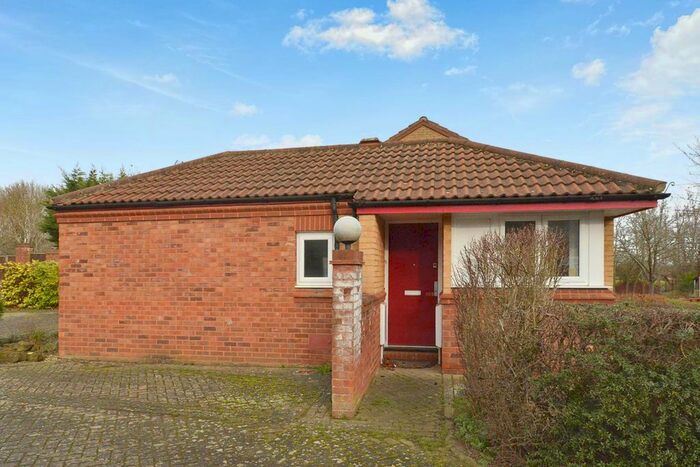
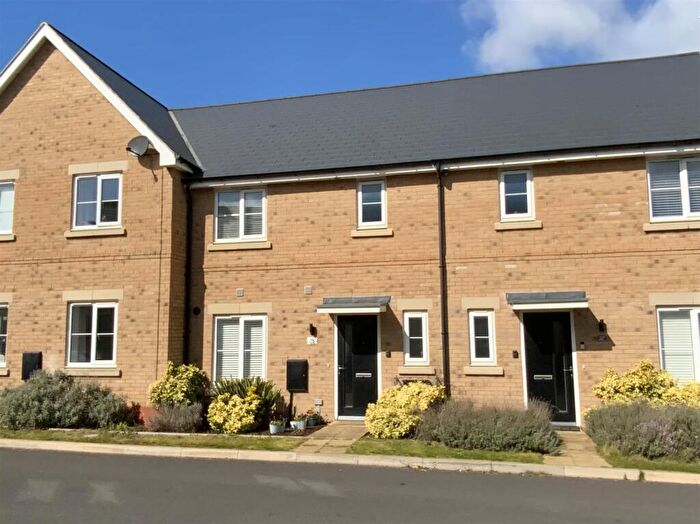
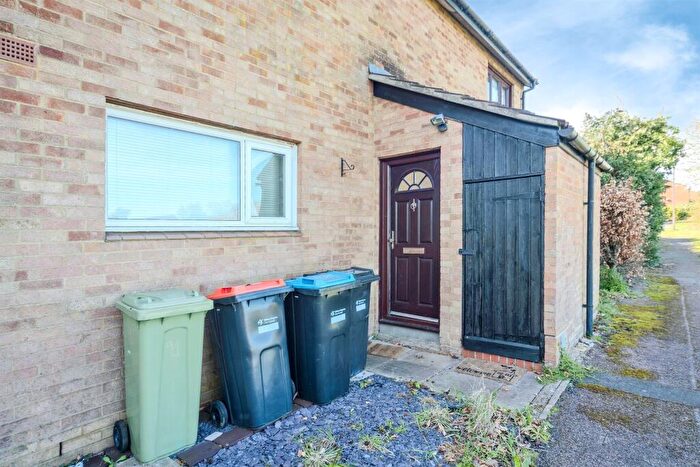
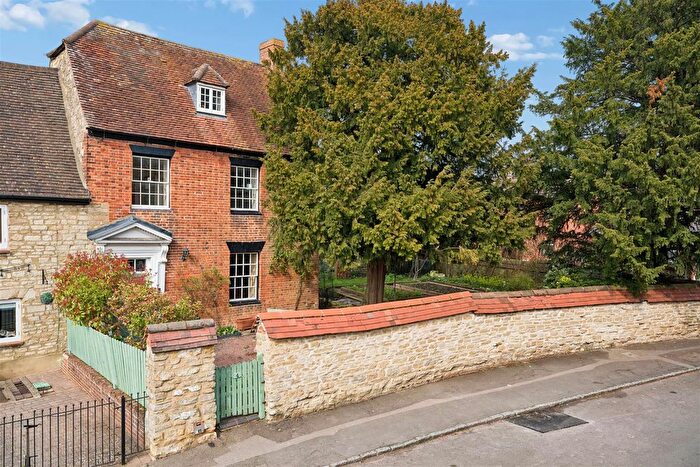
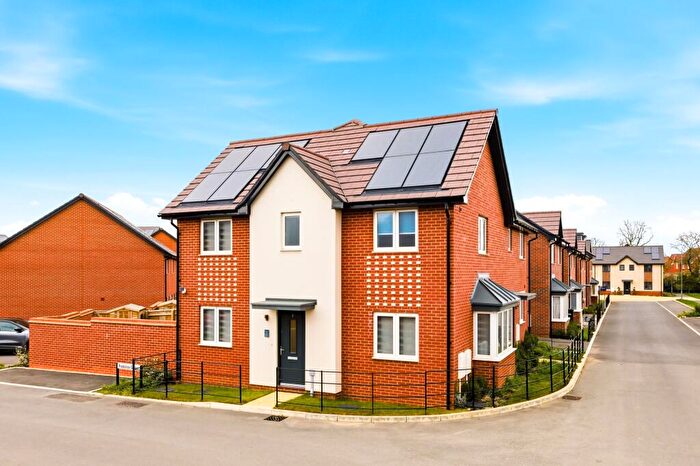
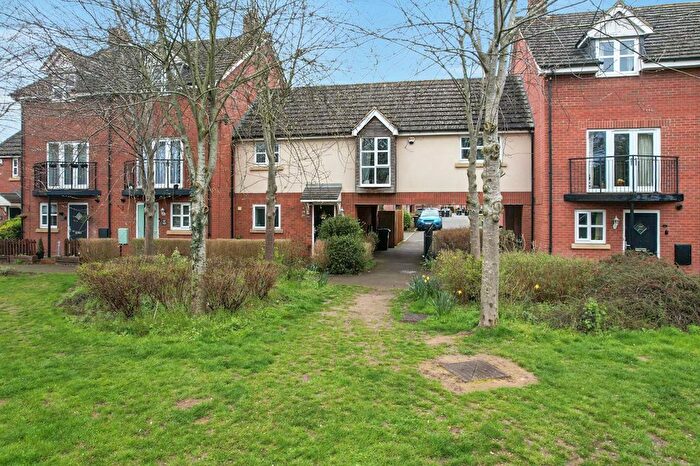
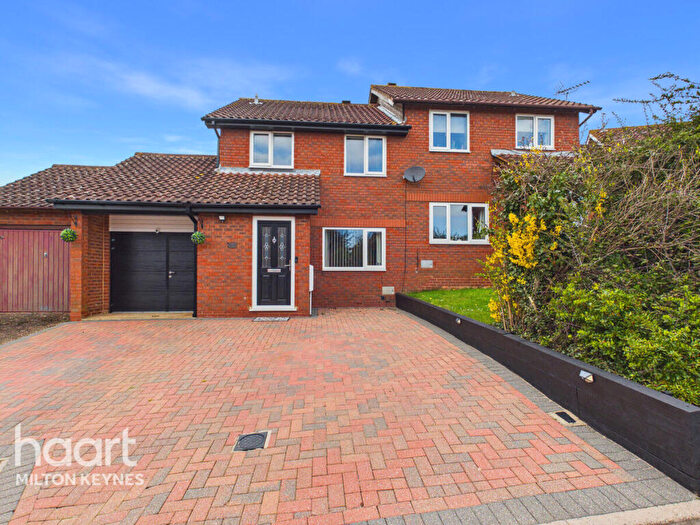
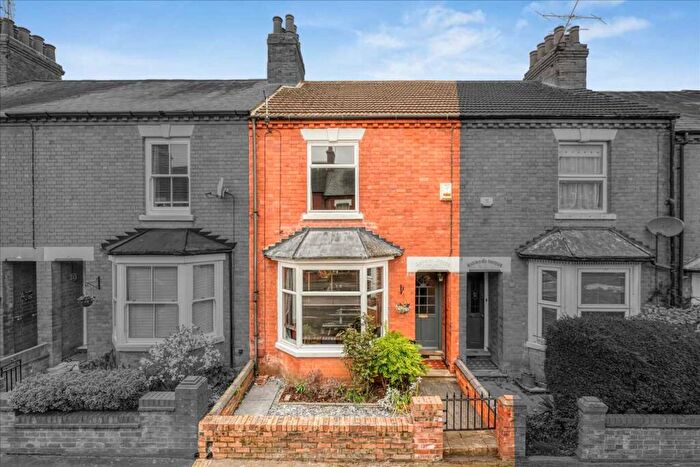
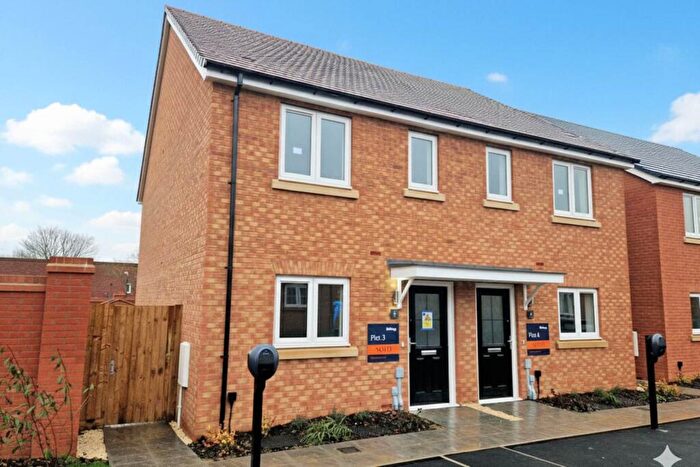
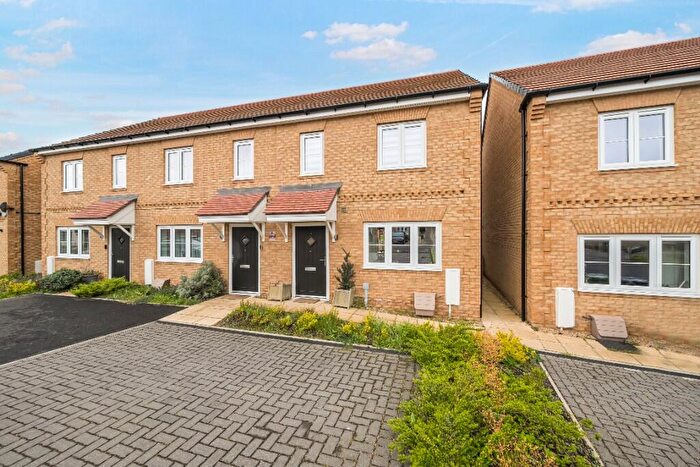
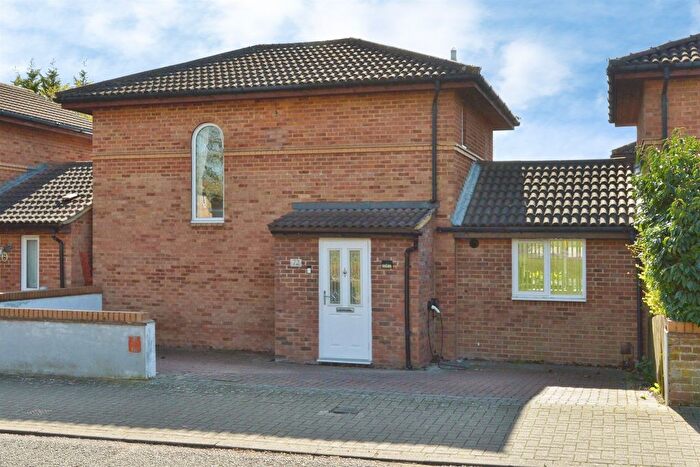
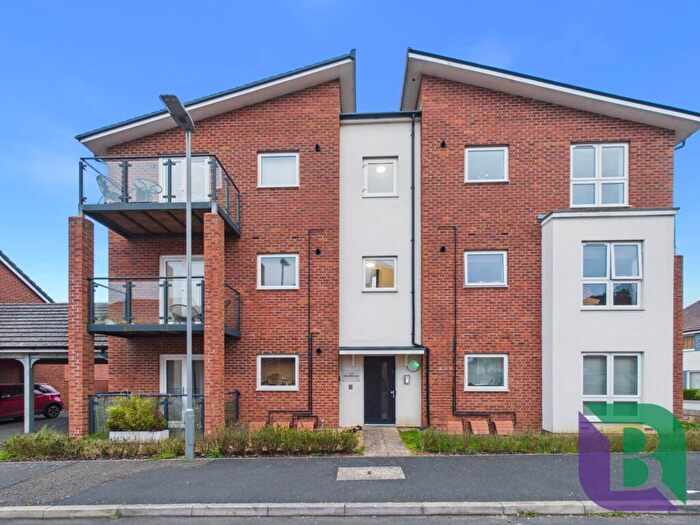
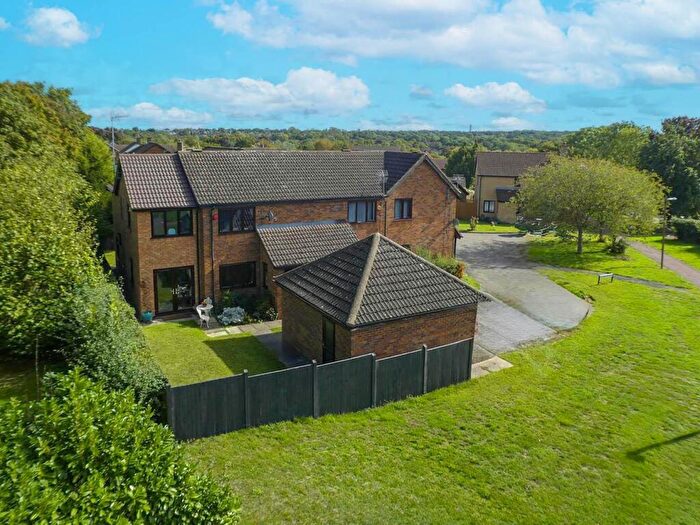
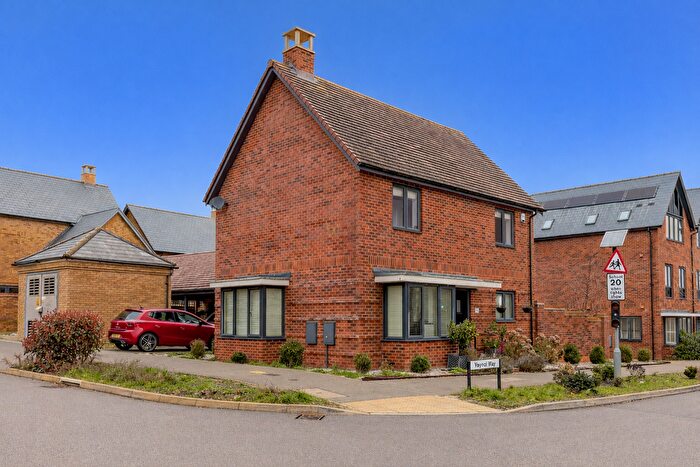
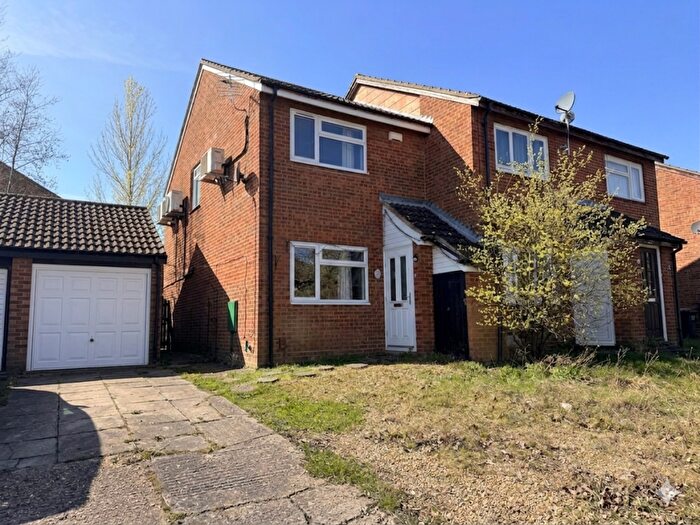
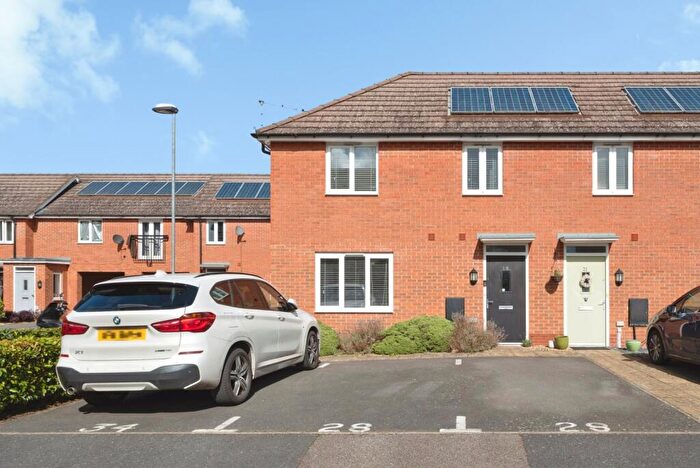
Properties for sale in Bradwell
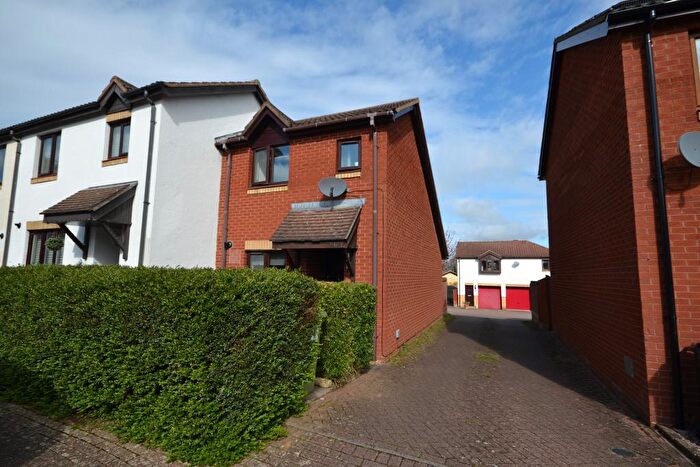

![]()
If you are looking to sell your house, let it out, or receive a property valuation, an expert can help you.
Click the button below to get started.

Roads and Postcodes in Bradwell
Navigate through our locations to find the location of your next house in Bradwell, Milton Keynes for sale or to rent.
Transport near Bradwell

- FAQ
- Price Paid By Year
- Property Type Price
Frequently asked questions about Bradwell
What is the average price for a property for sale in Bradwell?
The average price for a property for sale in Bradwell is £302,693. This amount is 10% lower than the average price in Milton Keynes. There are 4,324 property listings for sale in Bradwell.
What streets have the most expensive properties for sale in Bradwell?
The streets with the most expensive properties for sale in Bradwell are Belmont Court at an average of £685,000, Rickyard Close at an average of £675,000 and East Dales at an average of £595,500.
What streets have the most affordable properties for sale in Bradwell?
The streets with the most affordable properties for sale in Bradwell are Flintergill Court at an average of £74,857, Norbrek at an average of £80,000 and Culrain Place at an average of £81,500.
Which train stations are available in or near Bradwell?
Some of the train stations available in or near Bradwell are Wolverton, Milton Keynes Central and Bletchley.
Property Price Paid in Bradwell by Year
The average sold property price by year was:
| Year | Average Sold Price | Price Change |
Sold Properties
|
|---|---|---|---|
| 2026 | £271,666 | -11% |
3 Properties |
| 2025 | £302,777 | 1% |
100 Properties |
| 2024 | £299,826 | -2% |
144 Properties |
| 2023 | £306,611 | 5% |
127 Properties |
| 2022 | £291,192 | 10% |
160 Properties |
| 2021 | £262,711 | - |
195 Properties |
| 2020 | £262,838 | 6% |
126 Properties |
| 2019 | £246,767 | -24% |
158 Properties |
| 2018 | £306,565 | 23% |
143 Properties |
| 2017 | £237,328 | 9% |
180 Properties |
| 2016 | £215,463 | 8% |
205 Properties |
| 2015 | £198,508 | 9% |
167 Properties |
| 2014 | £179,689 | 5% |
197 Properties |
| 2013 | £169,845 | -4% |
150 Properties |
| 2012 | £175,797 | 6% |
137 Properties |
| 2011 | £165,980 | 1% |
138 Properties |
| 2010 | £163,817 | 6% |
123 Properties |
| 2009 | £154,403 | 1% |
131 Properties |
| 2008 | £153,592 | -10% |
133 Properties |
| 2007 | £169,324 | 13% |
362 Properties |
| 2006 | £147,290 | 9% |
327 Properties |
| 2005 | £134,690 | -3% |
265 Properties |
| 2004 | £139,105 | 13% |
353 Properties |
| 2003 | £121,089 | 12% |
339 Properties |
| 2002 | £106,288 | 23% |
416 Properties |
| 2001 | £81,920 | 17% |
348 Properties |
| 2000 | £68,185 | -2% |
369 Properties |
| 1999 | £69,689 | 17% |
434 Properties |
| 1998 | £58,026 | 2% |
313 Properties |
| 1997 | £56,673 | 16% |
362 Properties |
| 1996 | £47,338 | 1% |
277 Properties |
| 1995 | £46,820 | - |
203 Properties |
Property Price per Property Type in Bradwell
Here you can find historic sold price data in order to help with your property search.
The average Property Paid Price for specific property types in the last three years are:
| Property Type | Average Sold Price | Sold Properties |
|---|---|---|
| Semi Detached House | £277,631.00 | 113 Semi Detached Houses |
| Detached House | £462,106.00 | 99 Detached Houses |
| Terraced House | £248,633.00 | 129 Terraced Houses |
| Flat | £121,602.00 | 33 Flats |