
Houses for sale & to rent in Milton Keynes, England
House Prices in Milton Keynes
Properties in Milton Keynes have
an average house price of
£345k
and had 10,389 Property Transactions
within the last 3 years.¹
Milton Keynes is a location in
England with
98,588 households², where the most expensive property was sold for £3.5M.
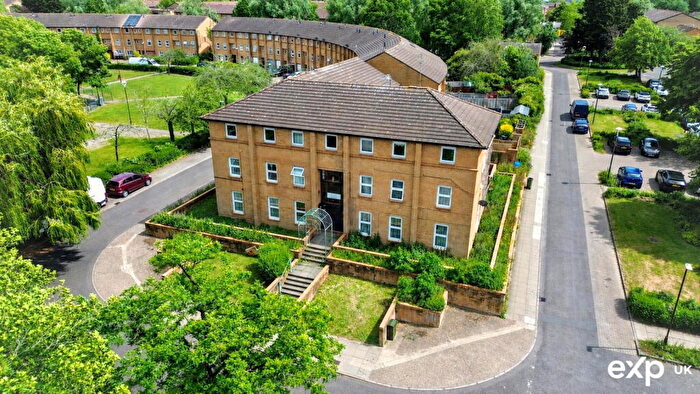
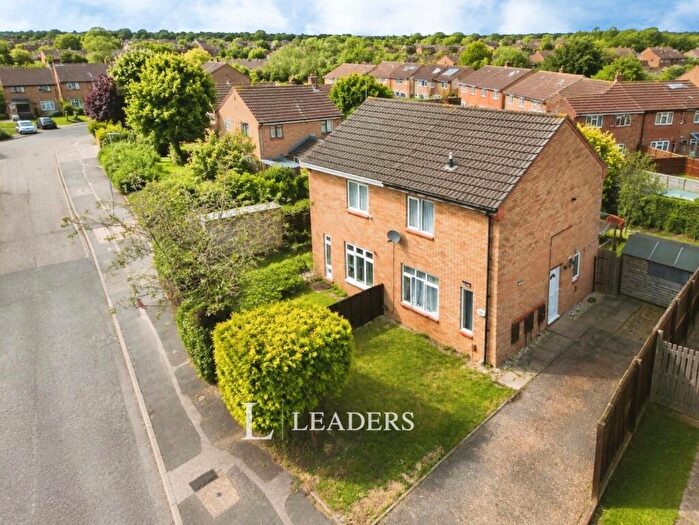
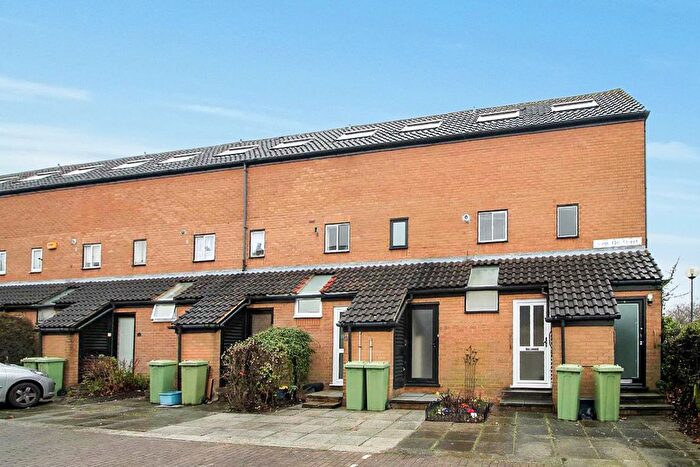
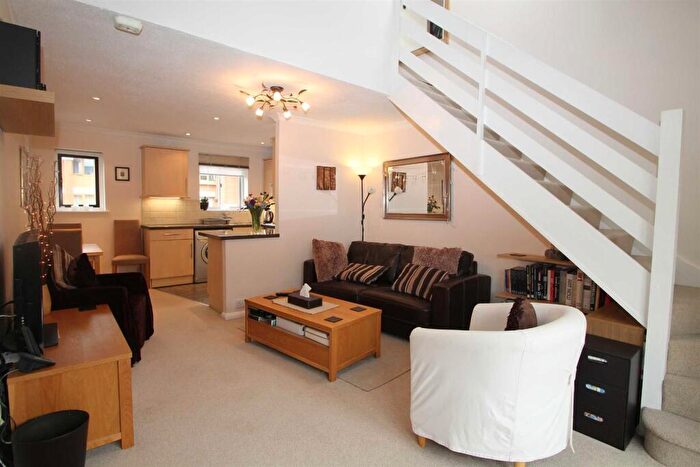
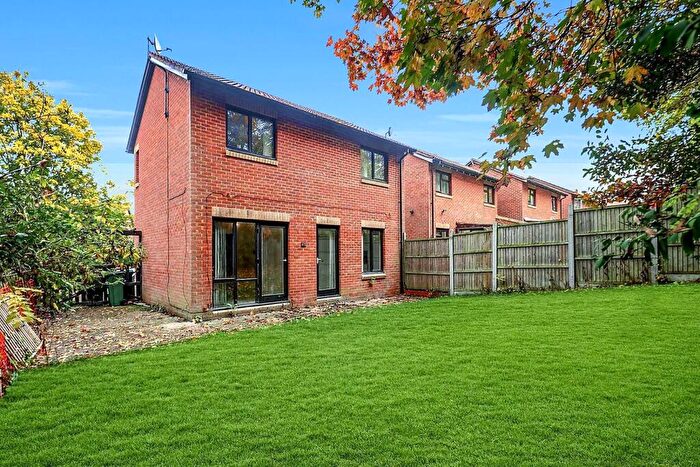
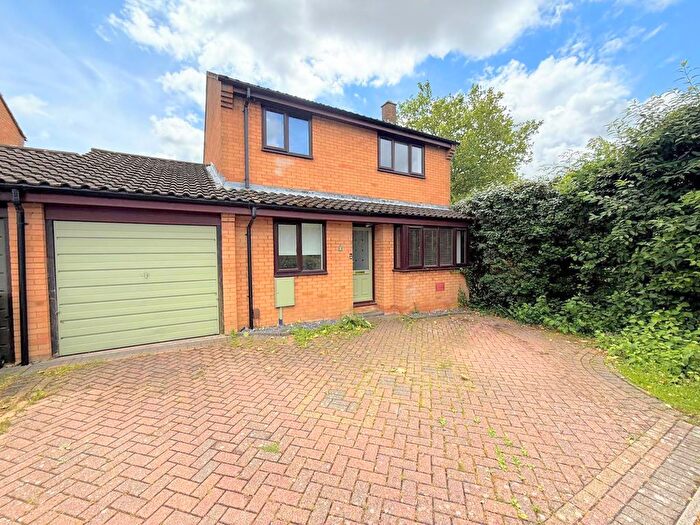
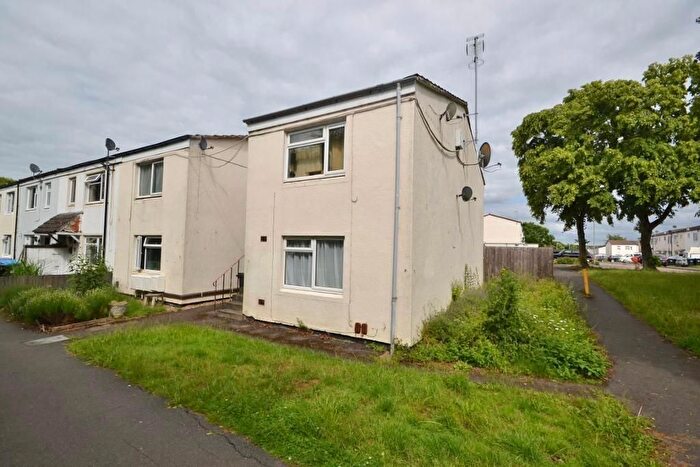
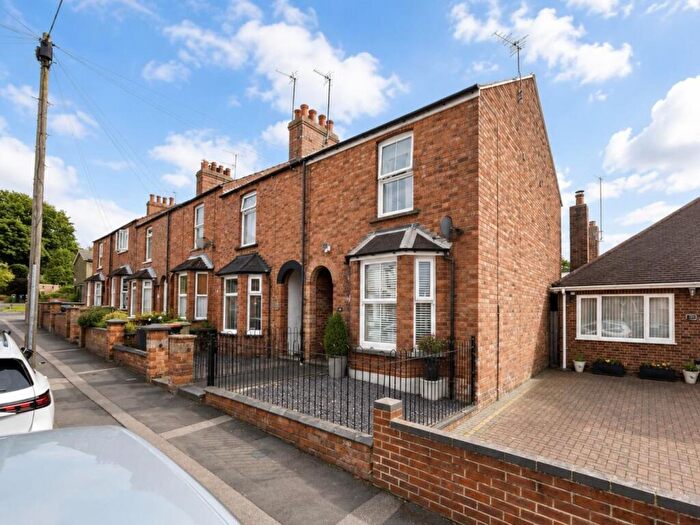
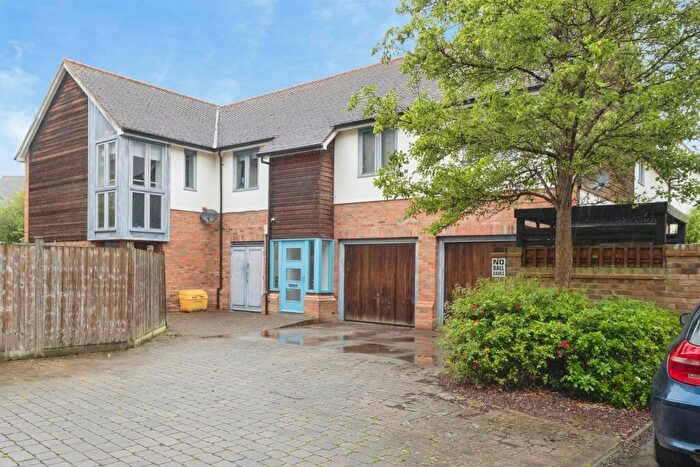
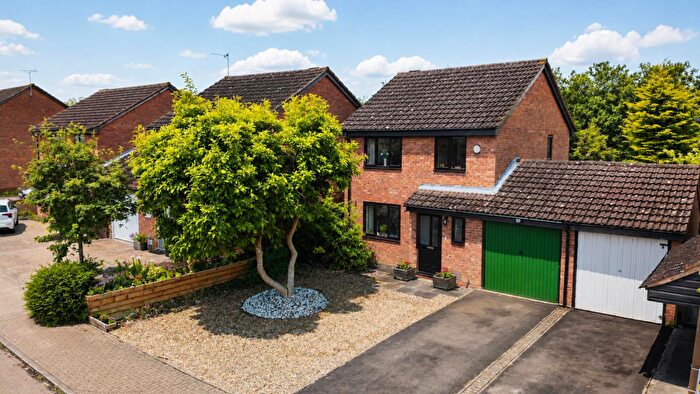
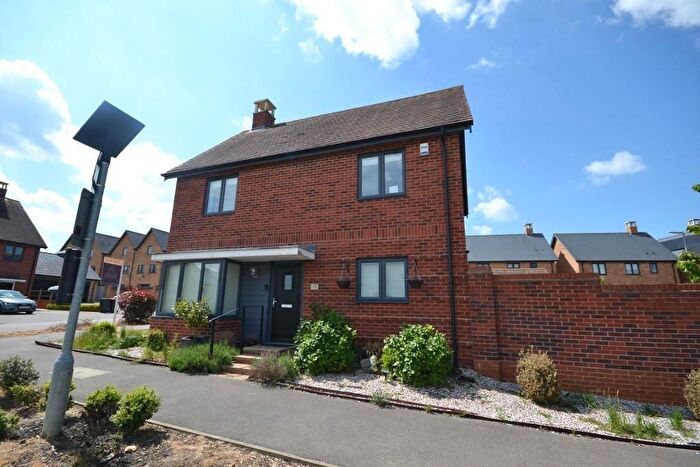
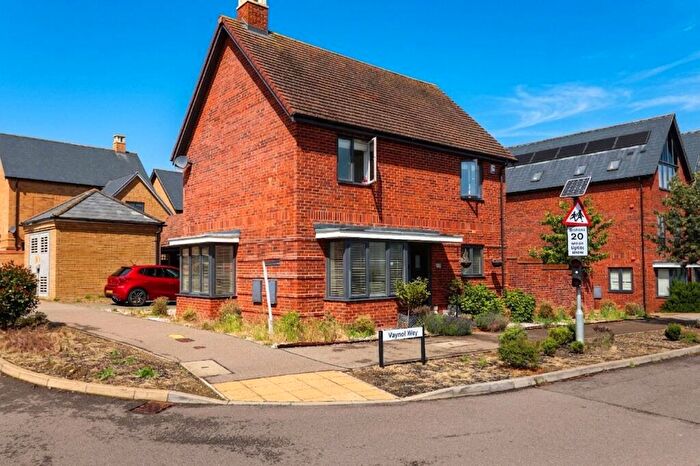
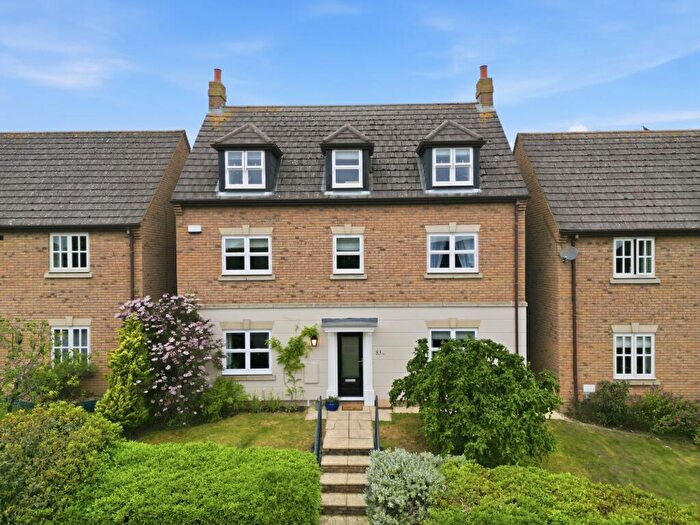
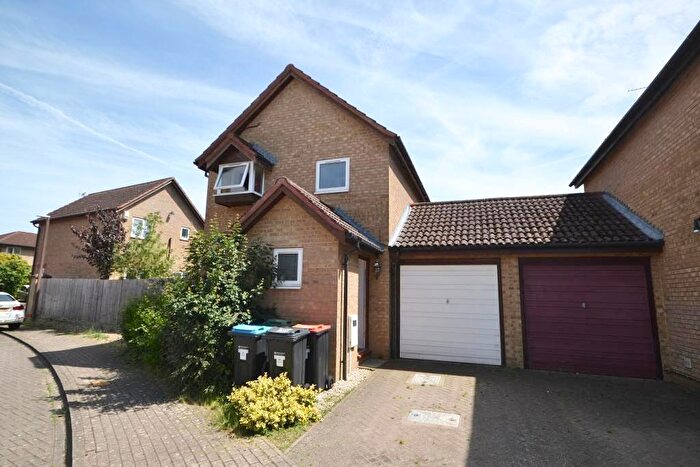
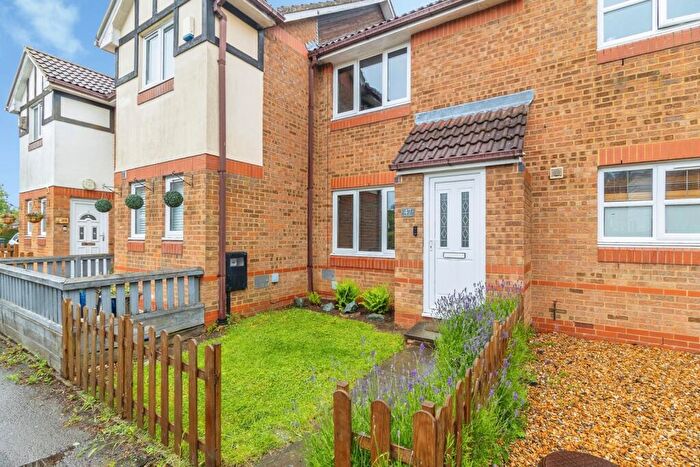
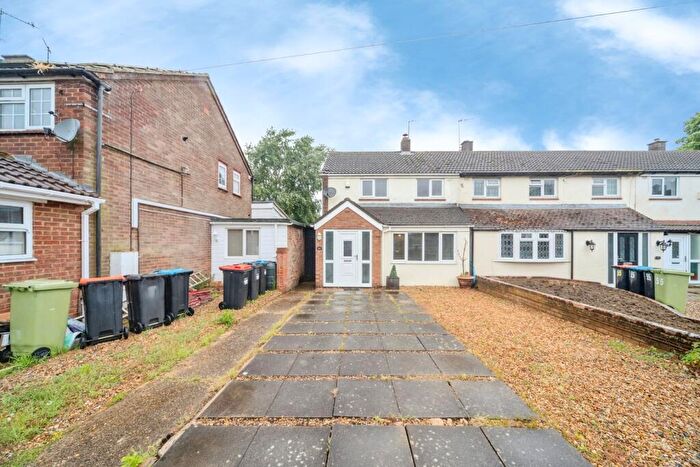
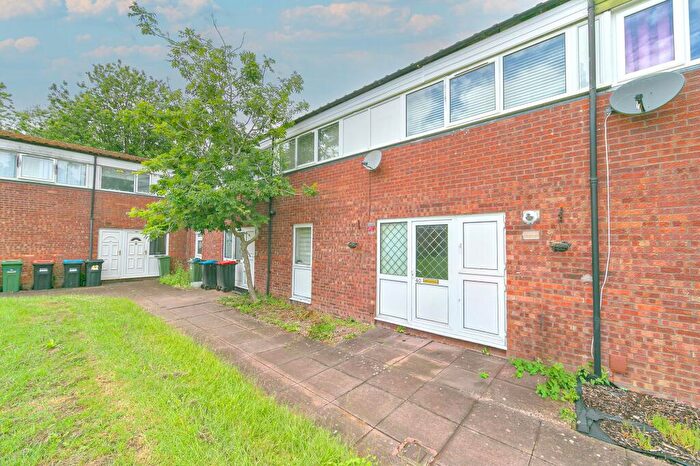
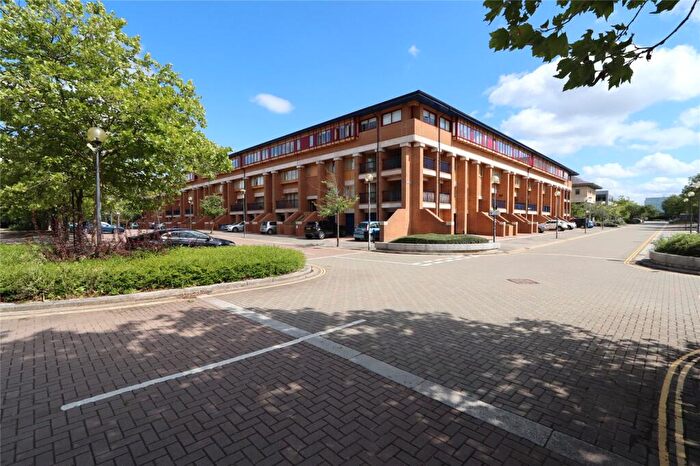
Properties for sale in Milton Keynes
![]()
If you are looking to sell your house, let it out, or receive a property valuation, an expert can help you.
Click the button below to get started.


Towns in Milton Keynes
Navigate through our locations to find the location of your next house in Milton Keynes, England for sale or to rent.
Transport in Milton Keynes
Please see below transportation links in this area:
-
 Milton Keynes Central Station
 -
Wolverton Station
-
Fenny Stratford Station
-
Bletchley Station
-
Bow Brickhill Station
-
Woburn Sands Station
- FAQ
- Price Paid By Year
- Property Type Price
Frequently asked questions about Milton Keynes
What is the average price for a property for sale in Milton Keynes?
The average price for a property for sale in Milton Keynes is £344,855. This amount is 4% lower than the average price in England. There are more than 10,000 property listings for sale in Milton Keynes.
What locations have the most expensive properties for sale in Milton Keynes?
The locations with the most expensive properties for sale in Milton Keynes are Bedford at an average of £648,800 and Olney at an average of £430,125.
What locations have the most affordable properties for sale in Milton Keynes?
The locations with the most affordable properties for sale in Milton Keynes are Milton Keynes at an average of £337,242 and Newport Pagnell at an average of £373,582.
Which train stations are available in or near Milton Keynes?
Some of the train stations available in or near Milton Keynes are Milton Keynes Central, Wolverton and Fenny Stratford.
Property Price Paid in Milton Keynes by Year
The average sold property price by year was:
| Year | Average Sold Price | Price Change |
Sold Properties
|
|---|---|---|---|
| 2026 | £347,126 | -1% |
485 Properties |
| 2025 | £351,754 | 3% |
3,310 Properties |
| 2024 | £342,263 | 1% |
3,443 Properties |
| 2023 | £340,089 | -3% |
3,151 Properties |
| 2022 | £351,911 | 7% |
4,199 Properties |
| 2021 | £325,991 | 2% |
5,467 Properties |
| 2020 | £320,324 | 5% |
3,941 Properties |
| 2019 | £304,305 | -2% |
4,891 Properties |
| 2018 | £309,824 | 6% |
4,934 Properties |
| 2017 | £290,533 | 5% |
5,223 Properties |
| 2016 | £275,157 | 7% |
5,214 Properties |
| 2015 | £257,183 | 10% |
5,072 Properties |
| 2014 | £230,972 | 9% |
4,759 Properties |
| 2013 | £210,166 | 0,2% |
4,119 Properties |
| 2012 | £209,827 | 5% |
3,501 Properties |
| 2011 | £198,785 | -4% |
3,400 Properties |
| 2010 | £206,569 | 11% |
3,468 Properties |
| 2009 | £183,282 | -6% |
3,669 Properties |
| 2008 | £194,161 | -2% |
4,039 Properties |
| 2007 | £197,631 | 5% |
7,358 Properties |
| 2006 | £187,647 | 4% |
7,119 Properties |
| 2005 | £180,722 | 5% |
5,552 Properties |
| 2004 | £172,208 | 10% |
6,185 Properties |
| 2003 | £155,338 | 13% |
6,448 Properties |
| 2002 | £134,677 | 16% |
7,361 Properties |
| 2001 | £113,752 | 12% |
6,862 Properties |
| 2000 | £100,493 | 15% |
6,436 Properties |
| 1999 | £85,063 | 10% |
6,896 Properties |
| 1998 | £76,330 | 9% |
5,848 Properties |
| 1997 | £69,306 | 8% |
6,060 Properties |
| 1996 | £63,605 | 3% |
5,258 Properties |
| 1995 | £61,676 | - |
4,235 Properties |
Property Price per Property Type in Milton Keynes
Here you can find historic sold price data in order to help with your property search.
The average Property Paid Price for specific property types in the last three years are:
| Property Type | Average Sold Price | Sold Properties |
|---|---|---|
| Semi Detached House | £331,956.00 | 2,838 Semi Detached Houses |
| Terraced House | £281,931.00 | 2,957 Terraced Houses |
| Detached House | £532,394.00 | 2,793 Detached Houses |
| Flat | £177,657.00 | 1,801 Flats |