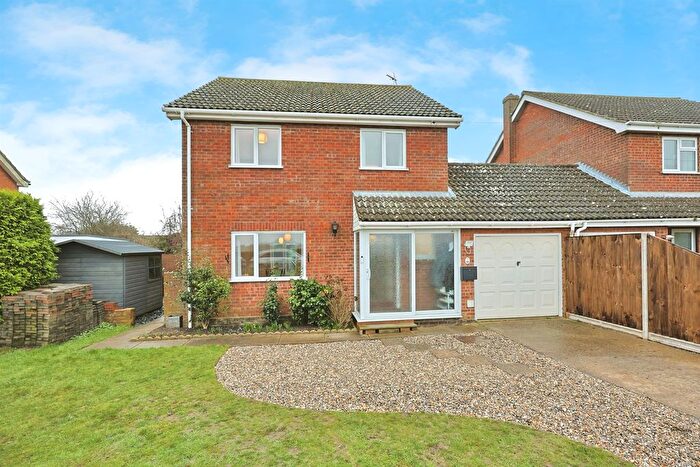
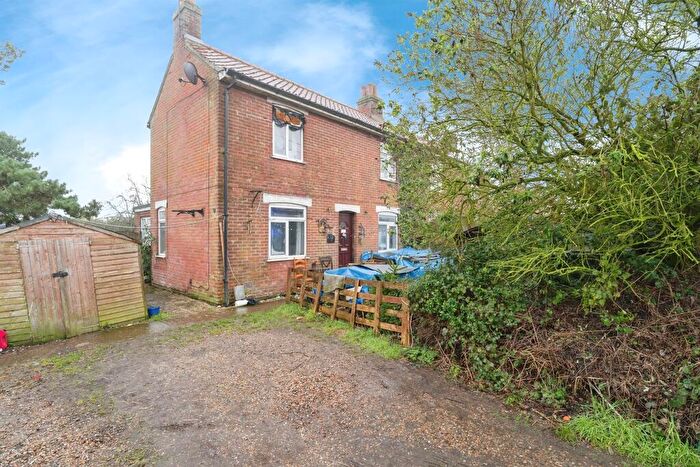
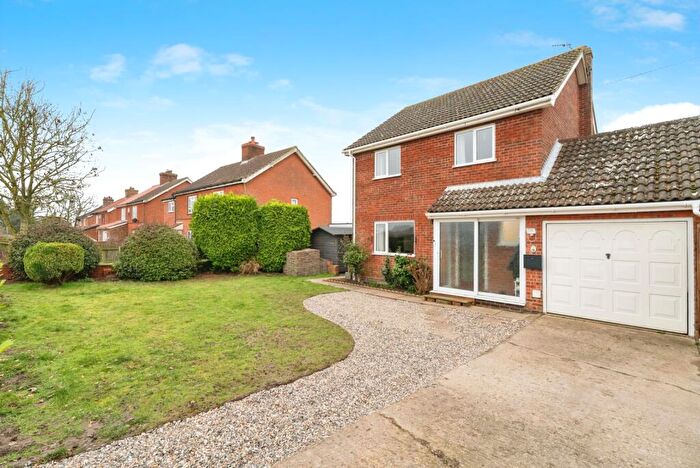
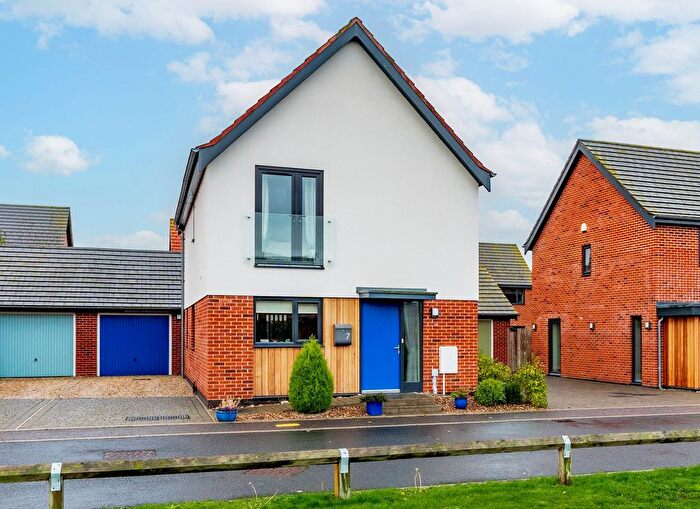
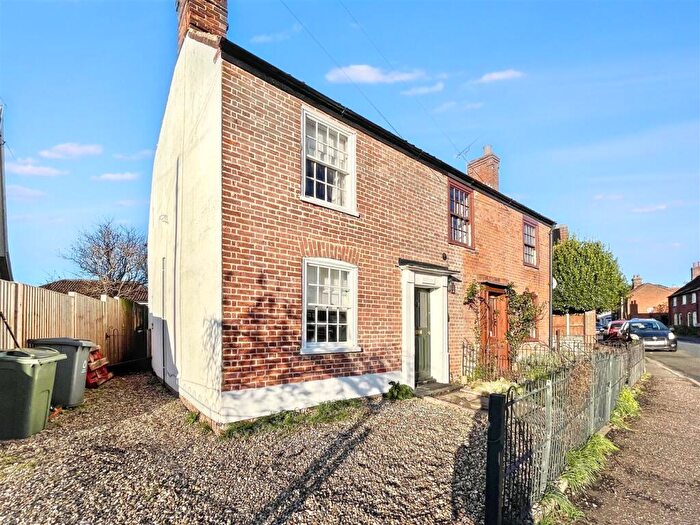
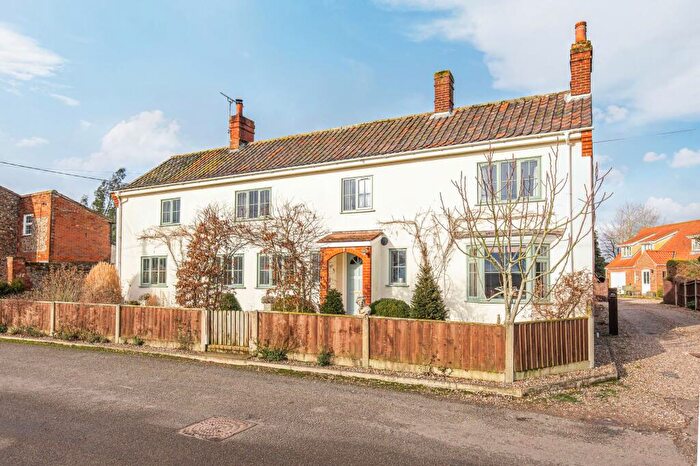
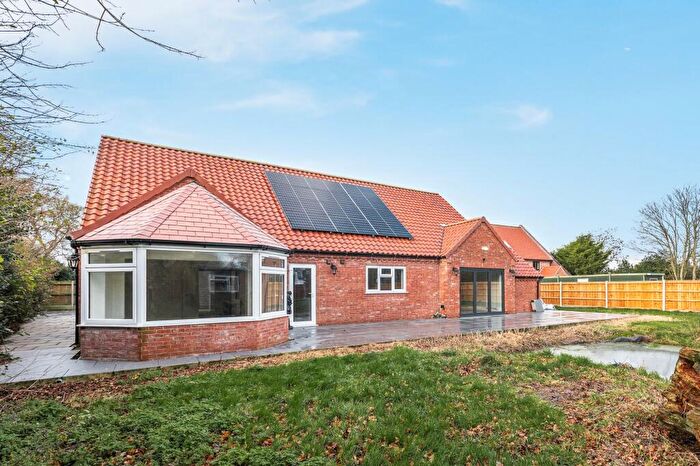
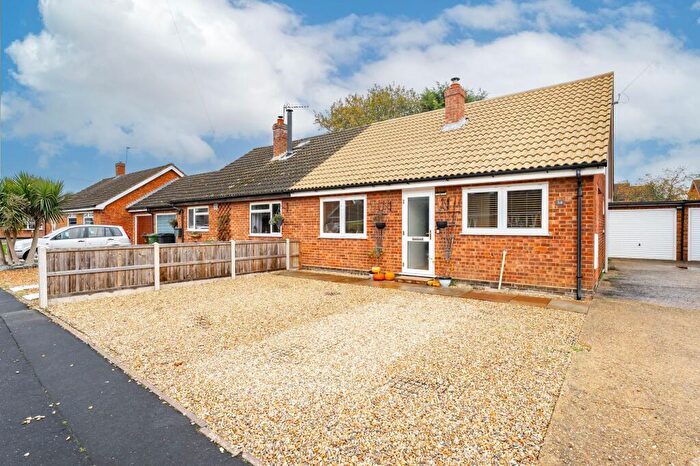
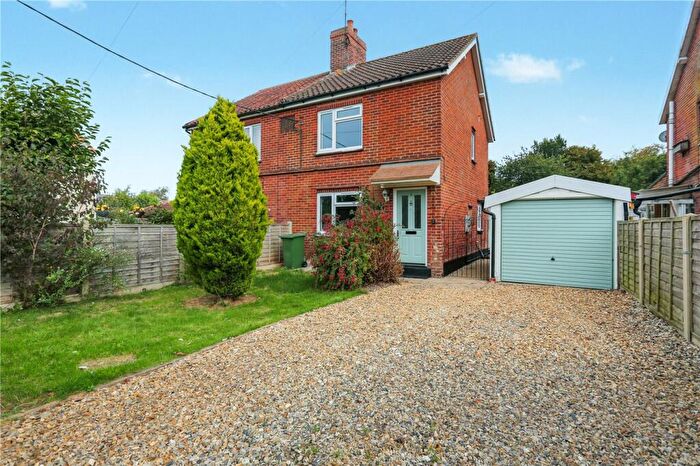
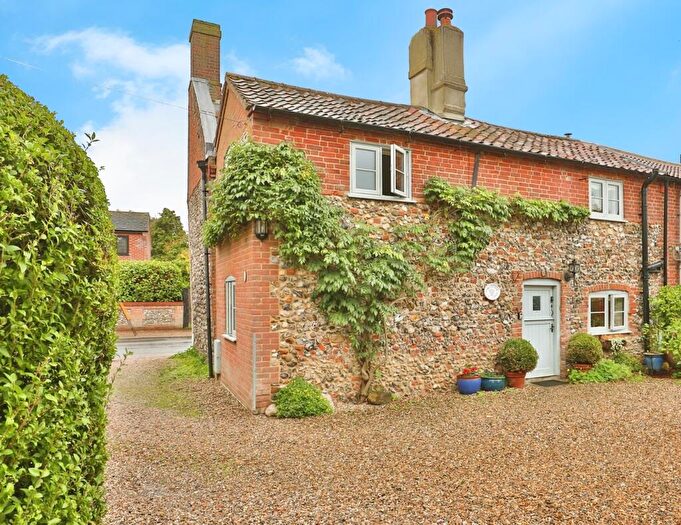
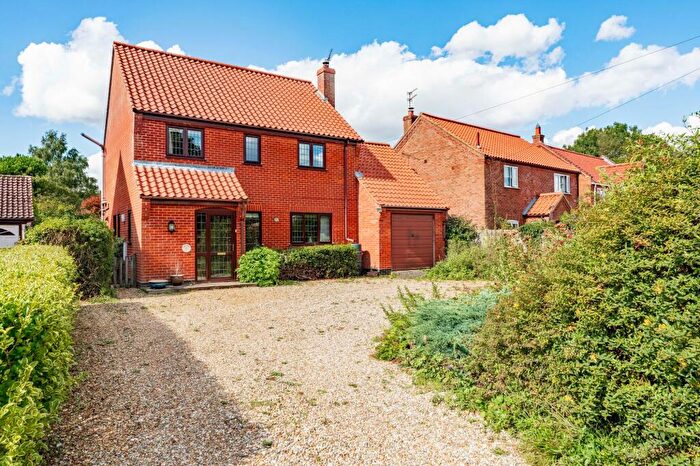
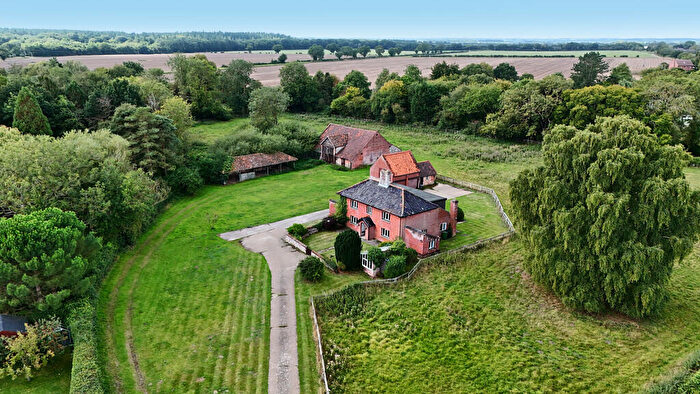
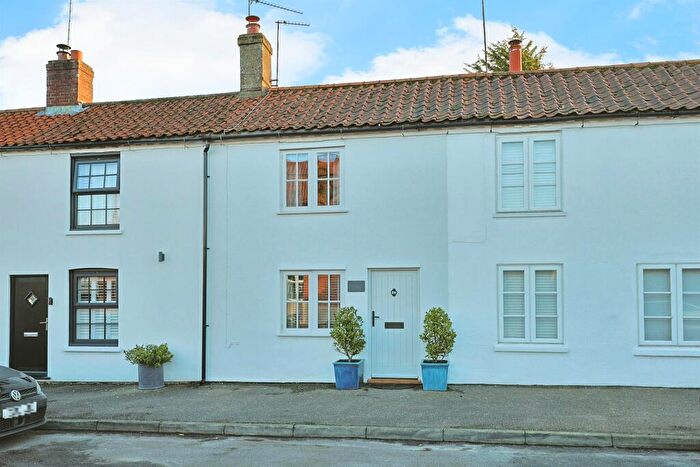
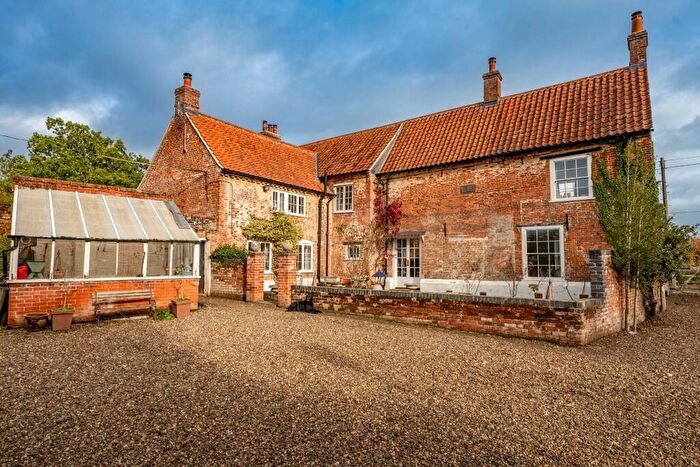
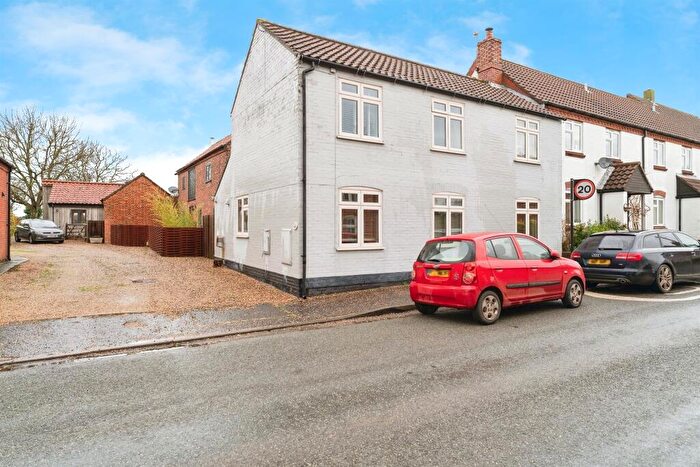
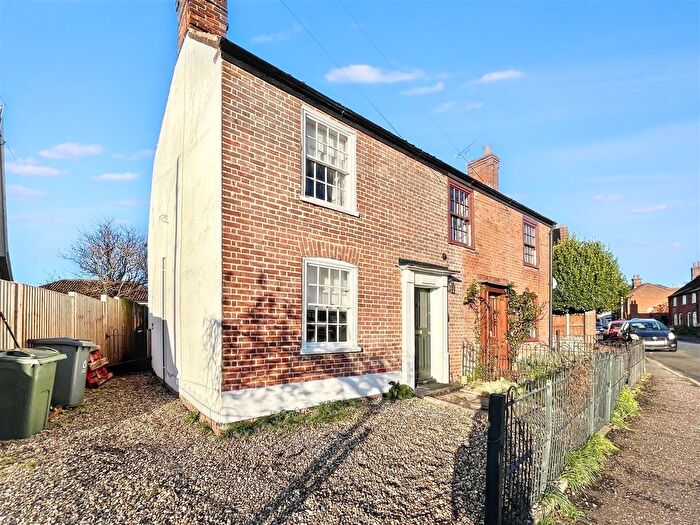
Houses for sale & to rent in Eynesford, Dereham
House Prices in Eynesford
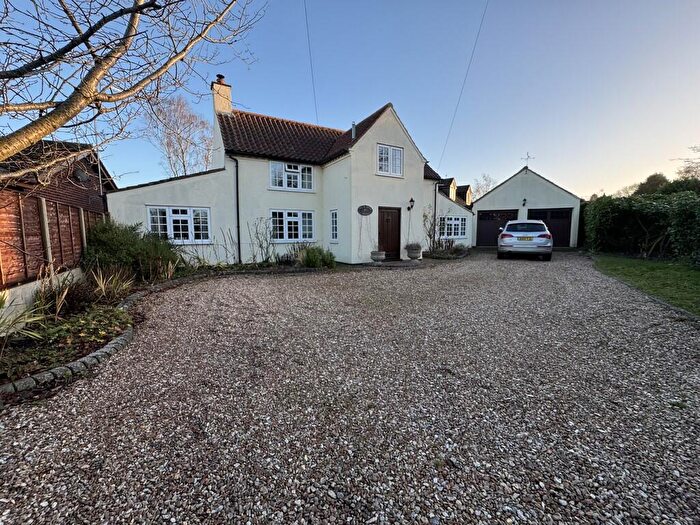
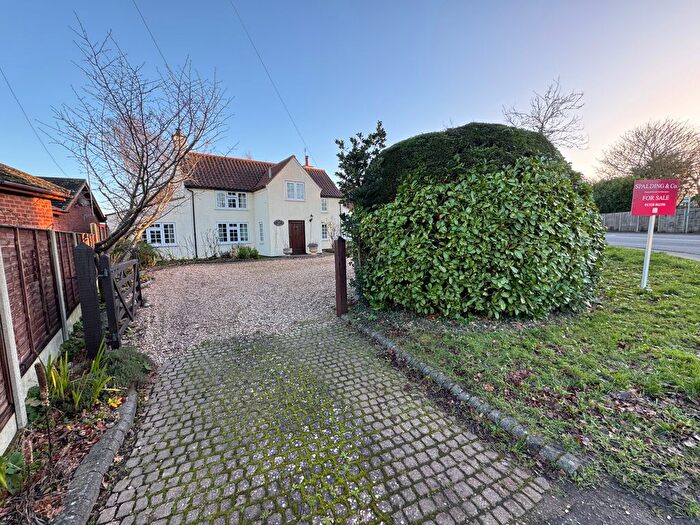
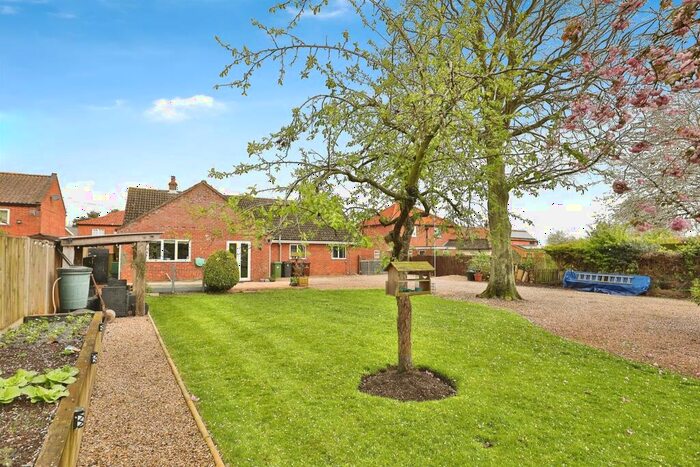
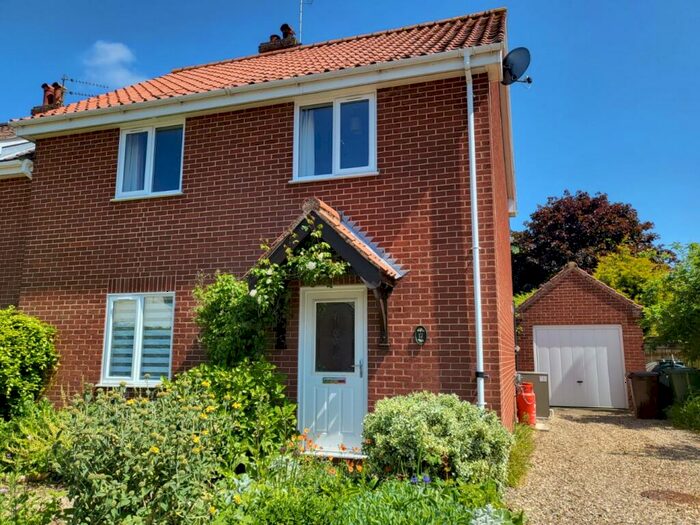
Properties in Eynesford have an average house price of £342,192.00 and had 37 Property Transactions within the last 3 years¹.
Eynesford is an area in Dereham, Norfolk with 500 households², where the most expensive property was sold for £1,175,000.00.
Properties for sale in Eynesford
Previously listed properties in Eynesford
Roads and Postcodes in Eynesford
Navigate through our locations to find the location of your next house in Eynesford, Dereham for sale or to rent.
| Streets | Postcodes |
|---|---|
| Aubrey Rix Close | NR20 5TY |
| Bexfield Close | NR20 5SA |
| Bexfield Drive | NR20 5SN |
| Bexfield Road | NR20 5SB |
| Bintree Road | NR20 5RL |
| Brays Lane | NR20 5TT |
| Chapel Lane | NR20 5RA |
| Chapel Road | NR20 5QH |
| Clay Pit Road | NR20 5RW |
| Council Houses | NR20 5PT |
| Dawsons Lane | NR20 5RQ |
| Foulsham Road | NR20 5RR |
| Foundry Close | NR20 5TJ |
| Foxley Road | NR20 5PU NR20 5RH |
| Green Lane | NR20 5PN |
| Guestwick Road | NR20 5RS NR20 5SJ NR20 5SH |
| Guist Road | NR20 5RZ |
| Gunn Street | NR20 5RJ NR20 5RN |
| High Street | NR20 5RT NR20 5AD NR20 5RY |
| Highfield Close | NR20 5SW |
| Hindolveston Road | NR20 5QL NR20 5QN NR20 5RX NR20 5SF NR20 5SG NR20 5SQ |
| Keeling Hall Road | NR20 5PR |
| Langwith Close | NR20 5TW |
| Market Hill | NR20 5RU |
| Mill Drive | NR20 5RB |
| Old School Road | NR20 5QD NR20 5QE |
| Peddlars Turnpike | NR20 5PX |
| Reepham Road | NR20 5PP NR20 5QG NR20 5SL NR20 5QF |
| Skippons Row Reepham Road | NR20 5TR |
| Skitfield Road | NR20 5GY |
| Station Road | NR20 5AL NR20 5QB NR20 5RD NR20 5RE NR20 5RF NR20 5RG |
| Stringers Lane | NR20 5RP |
| The Green | NR20 5QA |
| Twyford Lane | NR20 5SE |
| Wallers Lane | NR20 5TN |
| Wood Norton Road | NR20 5TX |
| NR20 5PS NR20 5QJ NR20 5QW NR20 5SD NR20 5PY NR20 5QQ |
Transport near Eynesford
- FAQ
- Price Paid By Year
- Property Type Price
Frequently asked questions about Eynesford
What is the average price for a property for sale in Eynesford?
The average price for a property for sale in Eynesford is £342,192. This amount is 17% higher than the average price in Dereham. There are 311 property listings for sale in Eynesford.
What streets have the most expensive properties for sale in Eynesford?
The streets with the most expensive properties for sale in Eynesford are Clay Pit Road at an average of £482,500, Hindolveston Road at an average of £479,166 and Skitfield Road at an average of £427,500.
What streets have the most affordable properties for sale in Eynesford?
The streets with the most affordable properties for sale in Eynesford are Foundry Close at an average of £162,666, Bexfield Road at an average of £210,000 and High Street at an average of £211,250.
Which train stations are available in or near Eynesford?
Some of the train stations available in or near Eynesford are Sheringham, West Runton and Roughton Road.
Property Price Paid in Eynesford by Year
The average sold property price by year was:
| Year | Average Sold Price | Price Change |
Sold Properties
|
|---|---|---|---|
| 2025 | £263,806 | -28% |
8 Properties |
| 2024 | £338,470 | -18% |
17 Properties |
| 2023 | £399,723 | 13% |
12 Properties |
| 2022 | £345,836 | -6% |
23 Properties |
| 2021 | £365,532 | 9% |
28 Properties |
| 2020 | £334,111 | 21% |
9 Properties |
| 2019 | £265,000 | -3% |
19 Properties |
| 2018 | £273,946 | -19% |
13 Properties |
| 2017 | £325,437 | 14% |
16 Properties |
| 2016 | £280,540 | 7% |
22 Properties |
| 2015 | £260,928 | 10% |
21 Properties |
| 2014 | £235,527 | 12% |
18 Properties |
| 2013 | £207,911 | -2% |
18 Properties |
| 2012 | £212,416 | 7% |
12 Properties |
| 2011 | £197,359 | -10% |
11 Properties |
| 2010 | £217,659 | 30% |
11 Properties |
| 2009 | £151,550 | -51% |
9 Properties |
| 2008 | £228,888 | -9% |
9 Properties |
| 2007 | £250,255 | 10% |
29 Properties |
| 2006 | £225,750 | 7% |
22 Properties |
| 2005 | £208,895 | 3% |
12 Properties |
| 2004 | £202,429 | -8% |
27 Properties |
| 2003 | £218,092 | 40% |
21 Properties |
| 2002 | £130,022 | 27% |
18 Properties |
| 2001 | £94,276 | -2% |
22 Properties |
| 2000 | £96,307 | 31% |
23 Properties |
| 1999 | £66,523 | 1% |
17 Properties |
| 1998 | £65,939 | 13% |
21 Properties |
| 1997 | £57,413 | 17% |
33 Properties |
| 1996 | £47,766 | -22% |
22 Properties |
| 1995 | £58,327 | - |
16 Properties |
Property Price per Property Type in Eynesford
Here you can find historic sold price data in order to help with your property search.
The average Property Paid Price for specific property types in the last three years are:
| Property Type | Average Sold Price | Sold Properties |
|---|---|---|
| Semi Detached House | £267,660.00 | 20 Semi Detached Houses |
| Detached House | £473,195.00 | 15 Detached Houses |
| Flat | £105,000.00 | 2 Flats |

