
Houses for sale in Norfolk, England
House Prices in Norfolk
Properties in Norfolk have
an average house price of
£299k
and had 41,904 Property Transactions
within the last 3 years.¹
Norfolk is a location in
England with
405,311 households², where the most expensive property was sold for £6M.
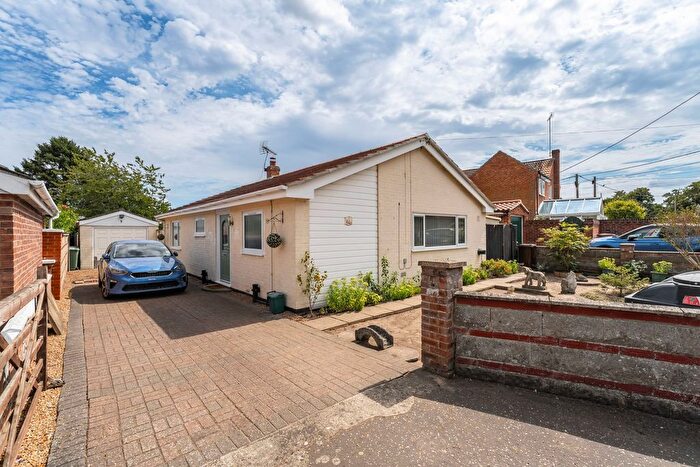
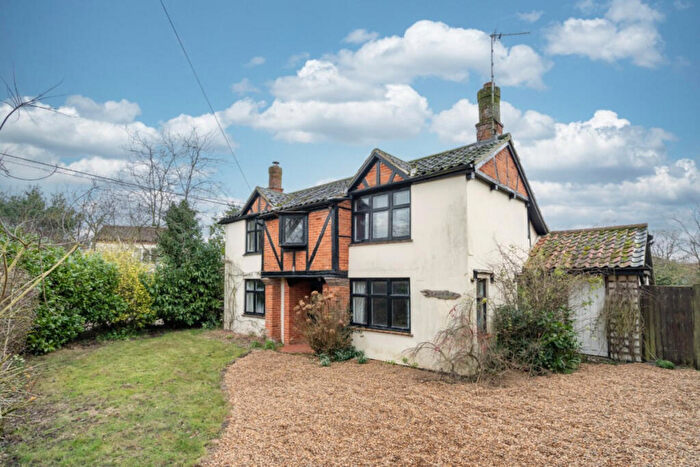
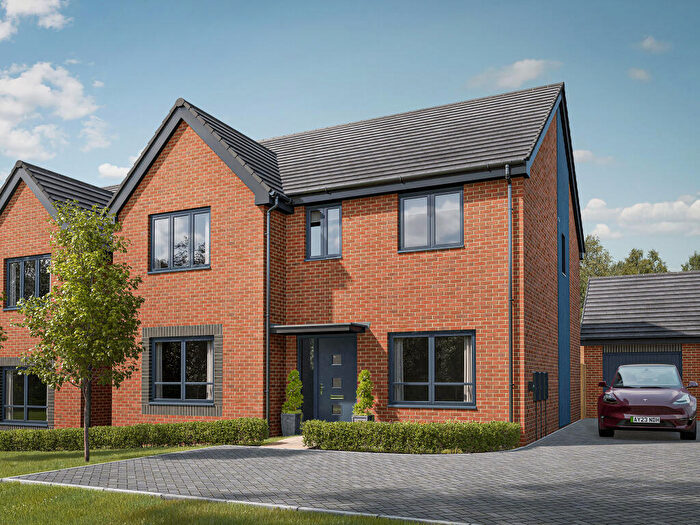
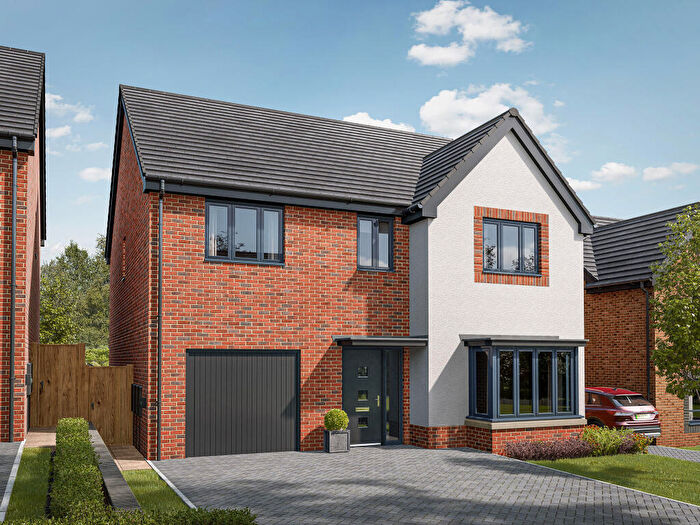
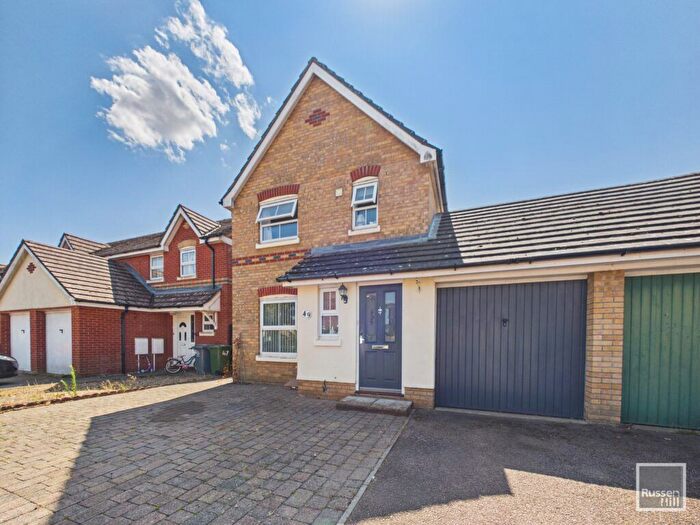
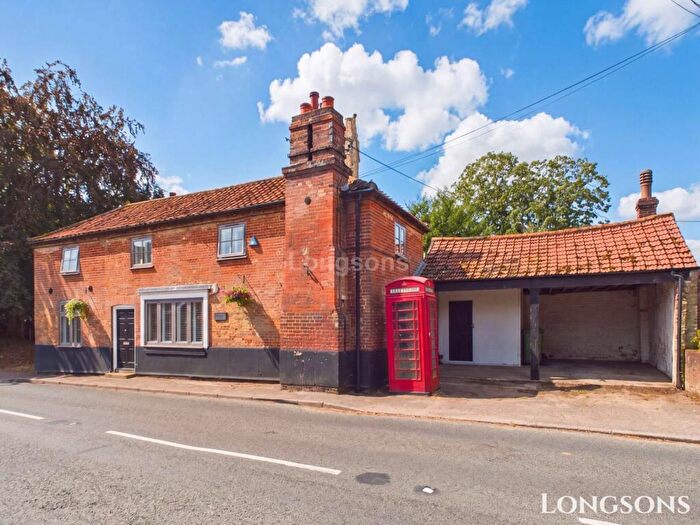
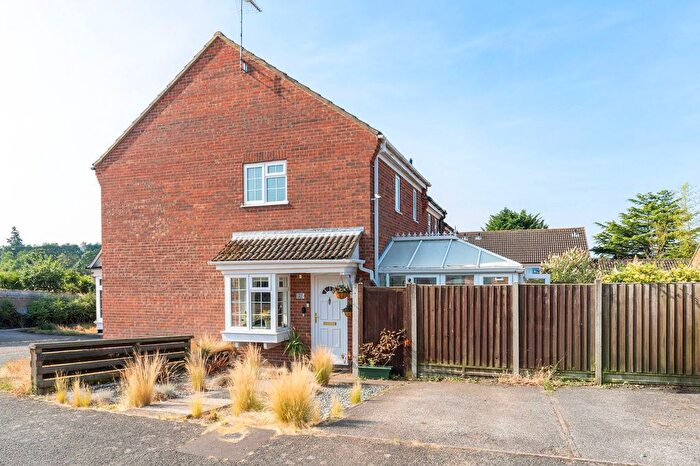
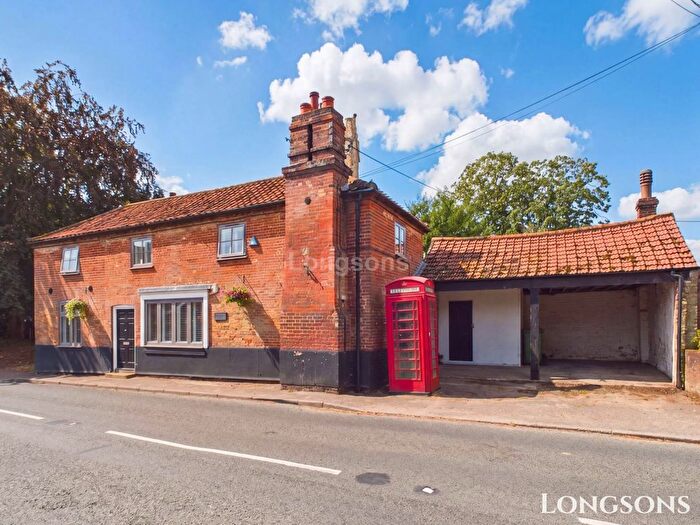
Properties for sale in Norfolk
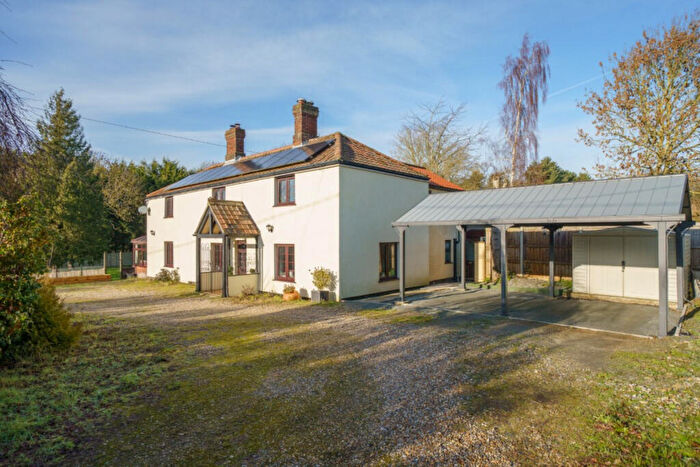
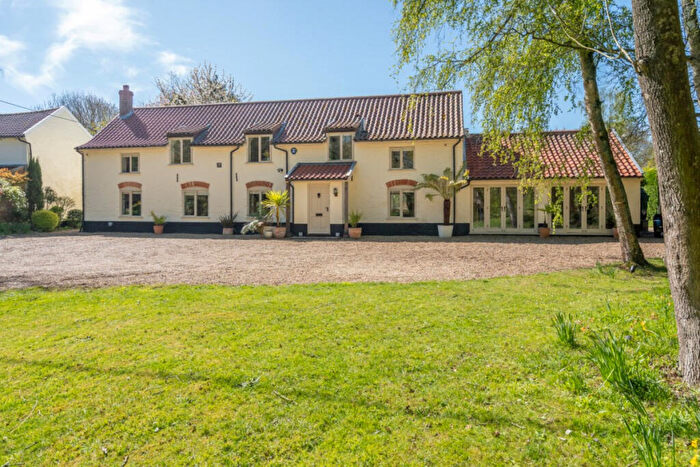
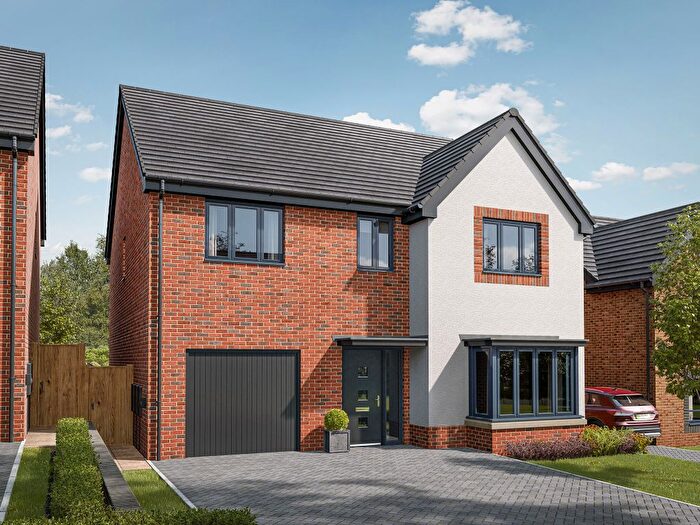
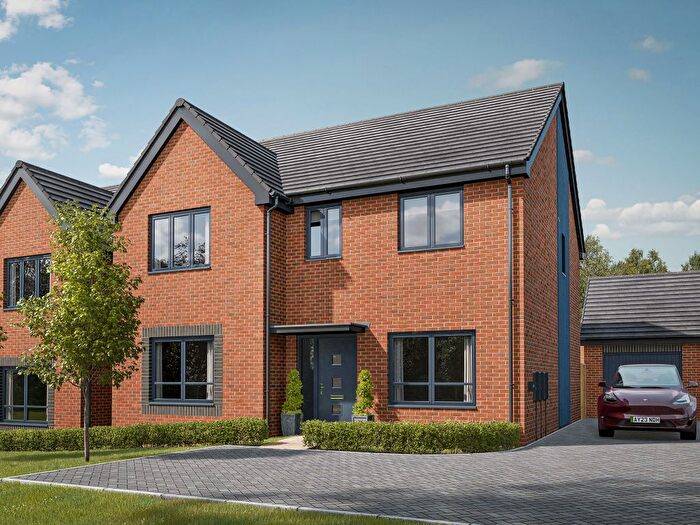
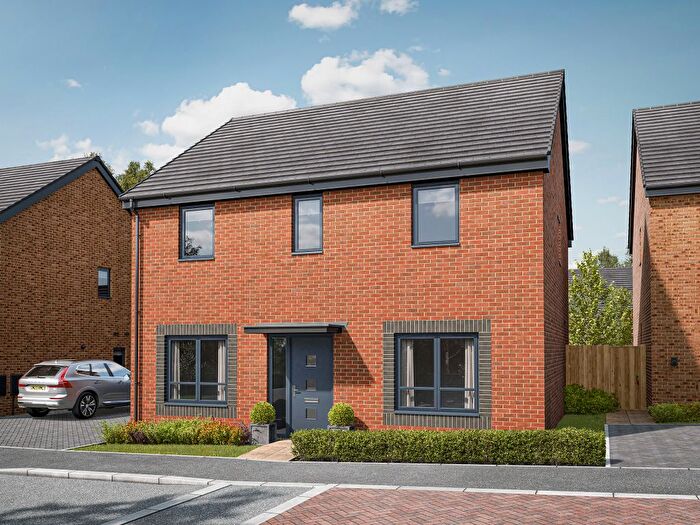

![]()
If you are looking to sell your house, let it out, or receive a property valuation, an expert can help you.
Click the button below to get started.


Towns in Norfolk
Navigate through our locations to find the location of your next house in Norfolk, England for sale or to rent.
Property price trends in Norfolk
According to the latest Land Registry data, the average home in Norfolk sold for £289,549 in 2026. That figure comes from a substantial record of 521,132 sales logged over the past 31 years.
Prices have softened over the last three years. Compared with 2023, when the typical sale came in around £303,868, that's a fall of roughly 4.7%.
Looking back five years, average prices are down about 0.9% since 2021, a drop of around £2,743 in cash terms.
Zoom out to the past decade for the fuller picture. Back in 2016, homes here averaged £227,985, so the typical sold price has climbed about 27% since then, roughly 2.4% a year. Stretch the view to fifteen years and that annual pace edges up closer to 3.1%.
Frequently asked questions about Norfolk
What is the average price for a property for sale in Norfolk?
The average price for a property for sale in Norfolk is £299,135. This amount is 17% lower than the average price in England. There are more than 10,000 property listings for sale in Norfolk.
What locations have the most expensive properties for sale in Norfolk?
The locations with the most expensive properties for sale in Norfolk are Wells-next-the-sea at an average of £528,733, Holt at an average of £503,205 and Walsingham at an average of £405,382.
What locations have the most affordable properties for sale in Norfolk?
The locations with the most affordable properties for sale in Norfolk are Great Yarmouth at an average of £229,732, Brandon at an average of £256,448 and Swaffham at an average of £258,769.
Which train stations are available in or near Norfolk?
Some of the train stations available in or near Norfolk are Wymondham, Spooner Row and Norwich.
Property Price Paid in Norfolk by Year
The average sold property price by year was:
| Year | Average Sold Price | Price Change |
Sold Properties
|
|---|---|---|---|
| 2026 | £289,549 | -3% |
2,660 Properties |
| 2025 | £297,847 | -0,1% |
13,584 Properties |
| 2024 | £298,017 | -2% |
13,410 Properties |
| 2023 | £303,868 | -3% |
12,250 Properties |
| 2022 | £313,581 | 7% |
15,794 Properties |
| 2021 | £292,292 | 7% |
20,441 Properties |
| 2020 | £271,311 | 6% |
14,612 Properties |
| 2019 | £253,942 | 2% |
17,150 Properties |
| 2018 | £248,733 | 2% |
16,998 Properties |
| 2017 | £243,600 | 6% |
17,731 Properties |
Property Price per Property Type in Norfolk
Here you can find historic sold price data in order to help with your property search.
The average Property Paid Price for specific property types in the last three years are:
| Property Type | Average Sold Price | Sold Properties |
|---|---|---|
| Semi Detached House | £266,862.00 | 11,256 Semi Detached Houses |
| Terraced House | £226,677.00 | 10,543 Terraced Houses |
| Detached House | £402,714.00 | 16,164 Detached Houses |
| Flat | £160,325.00 | 3,941 Flats |
Transport in Norfolk
Please see below transportation links in this area:
