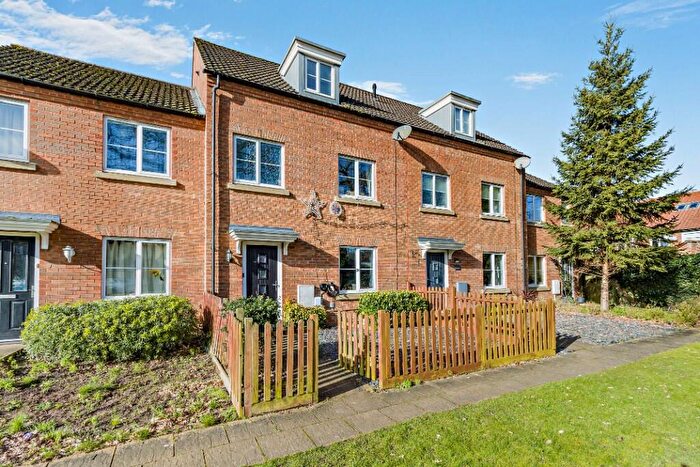
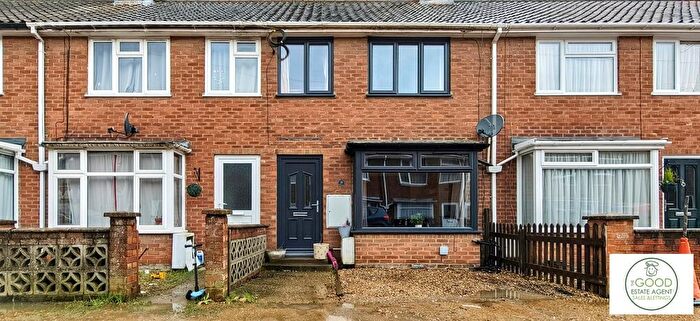
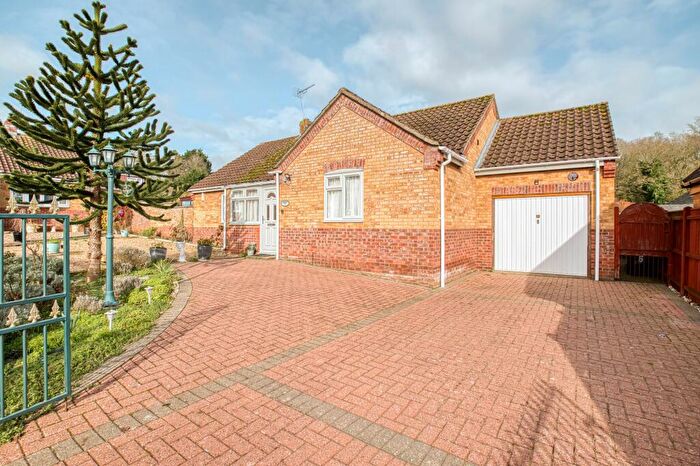
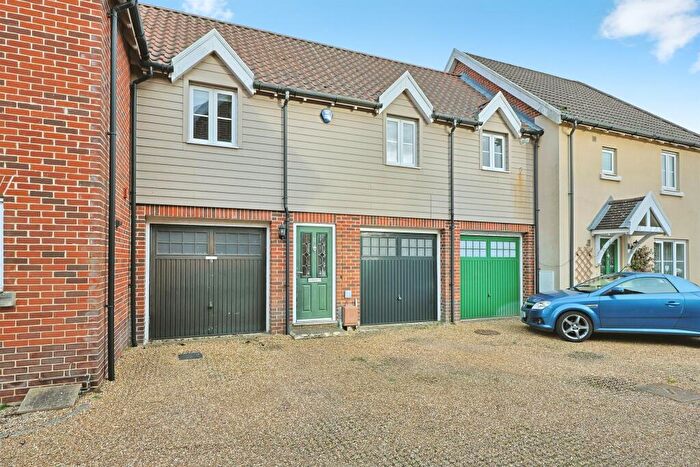
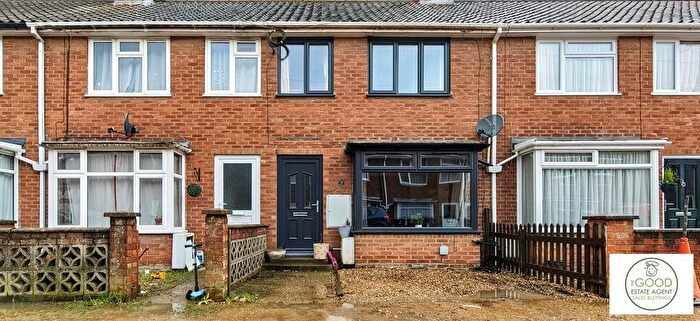
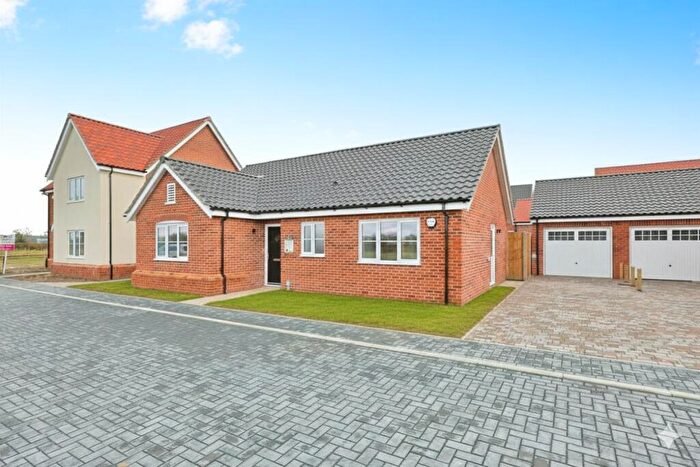
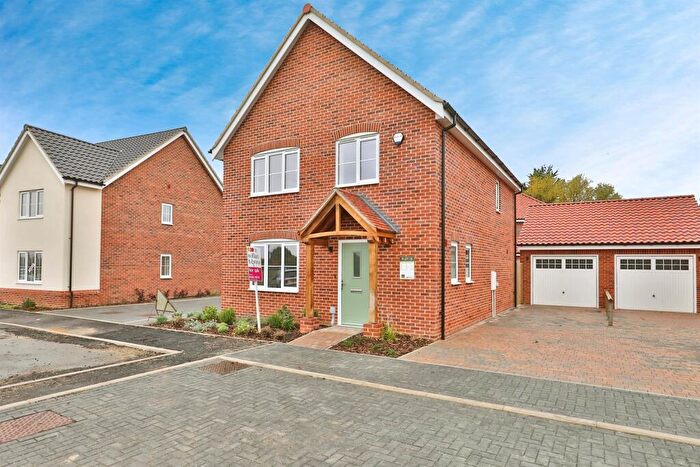
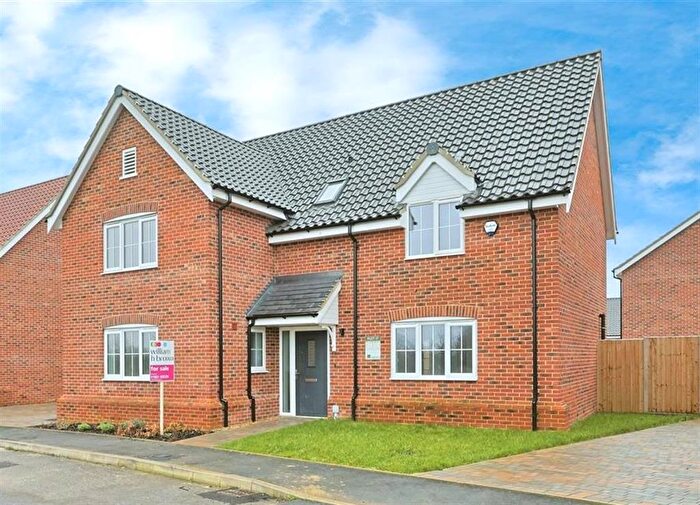
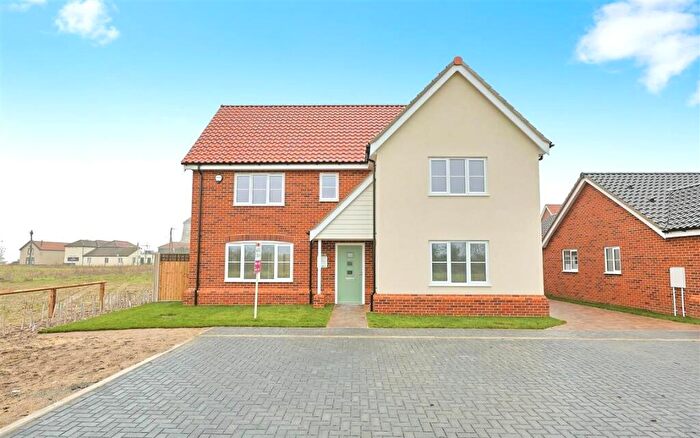
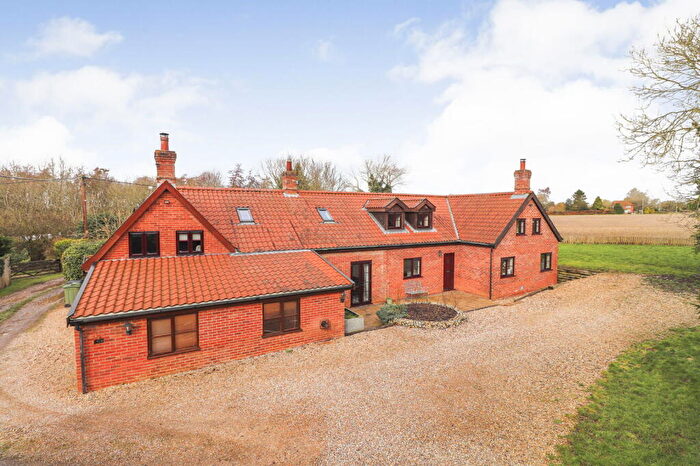
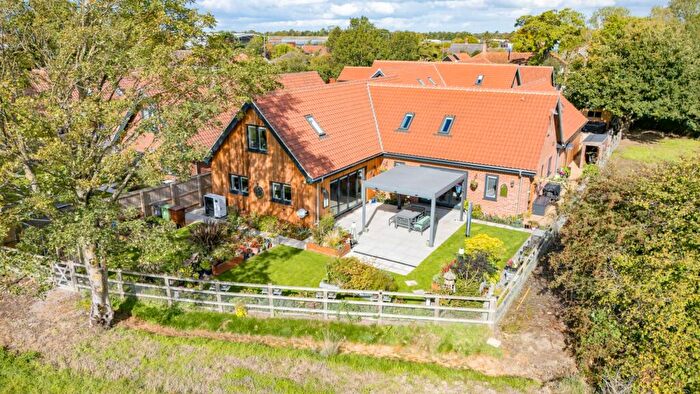
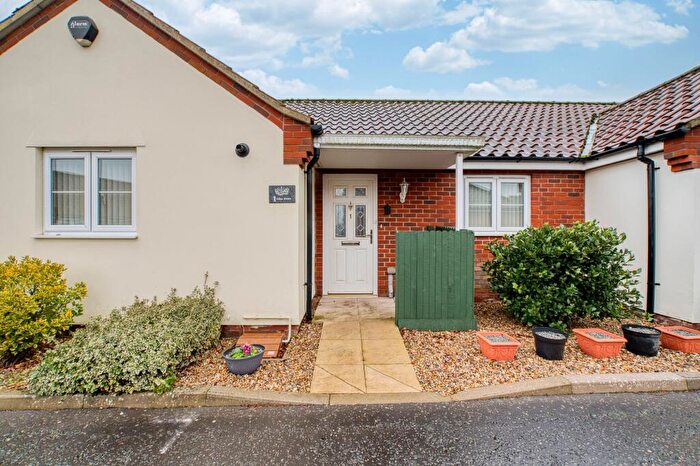
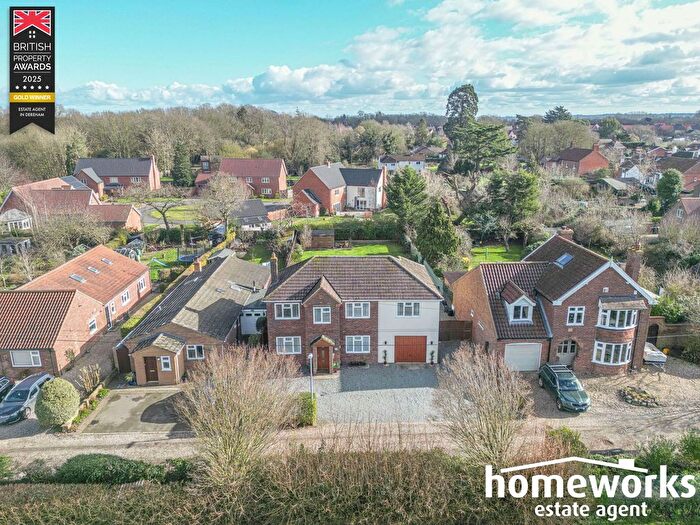
Houses for sale & to rent in Swanton Morley, Dereham
House Prices in Swanton Morley
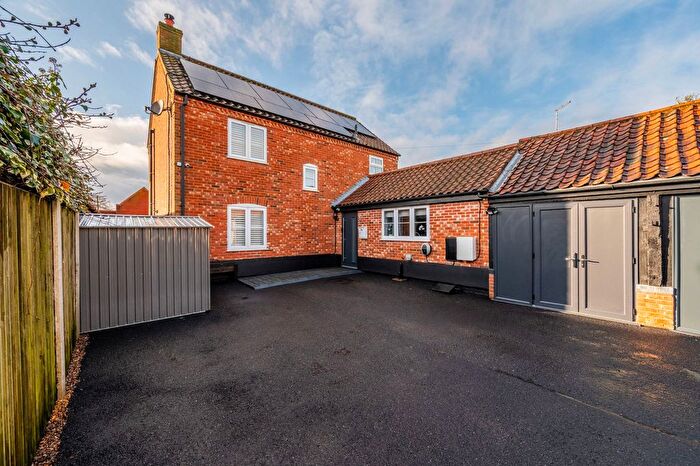
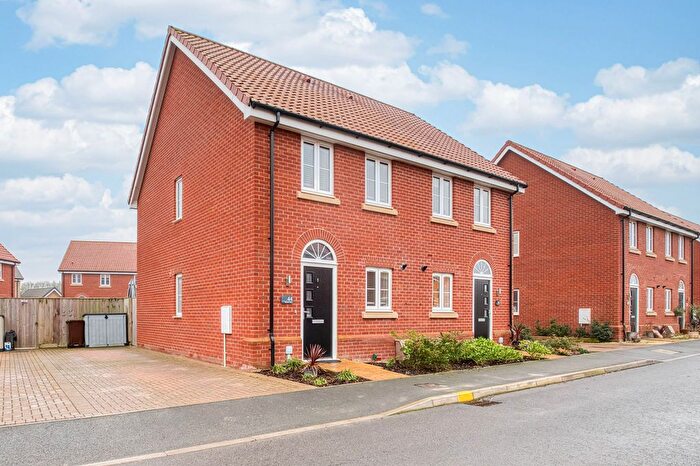
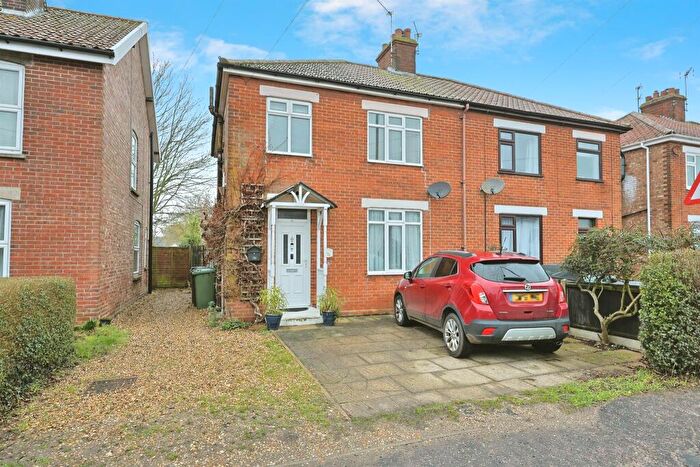
Properties in Swanton Morley have an average house price of £332,258.00 and had 61 Property Transactions within the last 3 years¹.
Swanton Morley is an area in Dereham, Norfolk with 764 households², where the most expensive property was sold for £718,000.00.
Properties for sale in Swanton Morley
Roads and Postcodes in Swanton Morley
Navigate through our locations to find the location of your next house in Swanton Morley, Dereham for sale or to rent.
| Streets | Postcodes |
|---|---|
| Ainsworth Close | NR20 4NE |
| Bedingfield Road | NR20 4NF |
| Bennett Road | NR20 4LY |
| Cherry Mews | NR20 4FJ |
| Church Road | NR20 3AD NR20 5HR |
| Church Street | NR20 3EA NR20 3EB |
| Council Houses | NR20 3EF |
| Cullum Close | NR20 4LZ |
| Dereham Road | NR20 4LT NR20 4LU |
| Elsing Road | NR20 4NY |
| Fakenham Road | NR20 4HA |
| Farrow Close | NR20 4RN |
| Frogs Hall Lane | NR20 4NX |
| Fustyweed | NR20 3EN |
| Gooseberry Hill | NR20 4PP |
| Gorgate Drive | NR20 4HB |
| Gorgate Road | NR20 4BG |
| Gray Drive | NR20 4PG |
| Greengate | NR20 4AD NR20 4LX NR20 4ND NR20 4NR |
| Hall Road | NR20 4BD |
| Hannah Road | NR20 4PF |
| Harris Road | NR20 4NJ |
| Heath Road | NR20 3EE |
| Hilton Road | NR20 4NG |
| Hoe Road East | NR20 4PZ |
| Hoe Road North | NR20 4PY |
| Hoe Road South | NR20 4PU |
| Holt Road | NR19 2QR NR20 4BE |
| Howard Close | NR20 4NL |
| Jasmine Walk | NR20 4FN |
| Keith Road | NR20 4NQ |
| Liberator Close | NR20 4GE |
| Lilac Mews | NR20 4FL |
| Lincoln Close | NR20 4NB |
| Loombe Close | NR20 4NW |
| Magnolia Mews | NR20 4FH |
| Manns Lane | NR20 4NP |
| Mason Road | NR20 4NN |
| Merryfield Close | NR20 4GD |
| Middleton Avenue | NR20 4PQ |
| Mill Lane | NR20 4BQ |
| Mill Street | NR20 3EH NR20 3EJ NR20 3EQ NR20 4QB |
| Norwich Road | NR20 4NT |
| Peaseland Green | NR20 3DY NR20 3DZ |
| Primrose Square | NR20 4PN |
| Rayner Drive | NR20 4LN |
| Rectory Road | NR20 3EG |
| Rump Close | NR20 4NH |
| Swanton Morley Road | NR20 5HS |
| Thompson Close | NR20 4PE |
| Town Street | NR20 4NZ NR20 4PB |
| Ward Crescent | NR20 4PH |
| Wensum Gardens | NR20 4UD |
| Woodgate | NR20 4NU |
| Woodgate Lane | NR20 4NS |
| Worthing Road | NR20 4QD |
| NR20 3EW NR20 4BH NR20 4HD |
Transport near Swanton Morley
- FAQ
- Price Paid By Year
- Property Type Price
Frequently asked questions about Swanton Morley
What is the average price for a property for sale in Swanton Morley?
The average price for a property for sale in Swanton Morley is £332,258. This amount is 14% higher than the average price in Dereham. There are 1,741 property listings for sale in Swanton Morley.
What streets have the most expensive properties for sale in Swanton Morley?
The streets with the most expensive properties for sale in Swanton Morley are Fakenham Road at an average of £718,000, Woodgate at an average of £525,000 and Church Road at an average of £477,500.
What streets have the most affordable properties for sale in Swanton Morley?
The streets with the most affordable properties for sale in Swanton Morley are Fustyweed at an average of £175,000, Magnolia Mews at an average of £202,000 and Farrow Close at an average of £203,000.
Which train stations are available in or near Swanton Morley?
Some of the train stations available in or near Swanton Morley are Wymondham, Spooner Row and Attleborough.
Property Price Paid in Swanton Morley by Year
The average sold property price by year was:
| Year | Average Sold Price | Price Change |
Sold Properties
|
|---|---|---|---|
| 2025 | £342,666 | 7% |
21 Properties |
| 2024 | £317,797 | -7% |
23 Properties |
| 2023 | £338,967 | -3% |
17 Properties |
| 2022 | £347,628 | 9% |
41 Properties |
| 2021 | £314,886 | 8% |
42 Properties |
| 2020 | £289,940 | 0,3% |
26 Properties |
| 2019 | £289,083 | 4% |
36 Properties |
| 2018 | £278,458 | -10% |
24 Properties |
| 2017 | £305,001 | 20% |
40 Properties |
| 2016 | £244,555 | 3% |
43 Properties |
| 2015 | £237,584 | 13% |
40 Properties |
| 2014 | £206,220 | -10% |
39 Properties |
| 2013 | £227,688 | 25% |
38 Properties |
| 2012 | £171,080 | -11% |
26 Properties |
| 2011 | £190,398 | -6% |
37 Properties |
| 2010 | £201,738 | 1% |
37 Properties |
| 2009 | £200,171 | 7% |
31 Properties |
| 2008 | £185,188 | -5% |
13 Properties |
| 2007 | £193,756 | -39% |
31 Properties |
| 2006 | £269,837 | 11% |
21 Properties |
| 2005 | £239,355 | 20% |
24 Properties |
| 2004 | £190,391 | 20% |
32 Properties |
| 2003 | £152,186 | -3% |
39 Properties |
| 2002 | £156,650 | 19% |
22 Properties |
| 2001 | £126,373 | 30% |
31 Properties |
| 2000 | £88,774 | -22% |
36 Properties |
| 1999 | £108,566 | 18% |
34 Properties |
| 1998 | £88,575 | 12% |
35 Properties |
| 1997 | £78,149 | 1% |
45 Properties |
| 1996 | £77,201 | 11% |
35 Properties |
| 1995 | £68,369 | - |
28 Properties |
Property Price per Property Type in Swanton Morley
Here you can find historic sold price data in order to help with your property search.
The average Property Paid Price for specific property types in the last three years are:
| Property Type | Average Sold Price | Sold Properties |
|---|---|---|
| Semi Detached House | £241,241.00 | 18 Semi Detached Houses |
| Detached House | £408,160.00 | 34 Detached Houses |
| Terraced House | £227,555.00 | 9 Terraced Houses |

