Houses for sale & to rent in Wensum, Fakenham
House Prices in Wensum
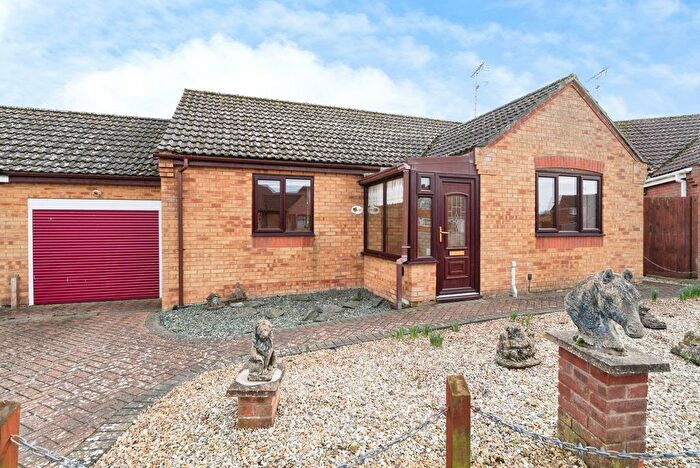
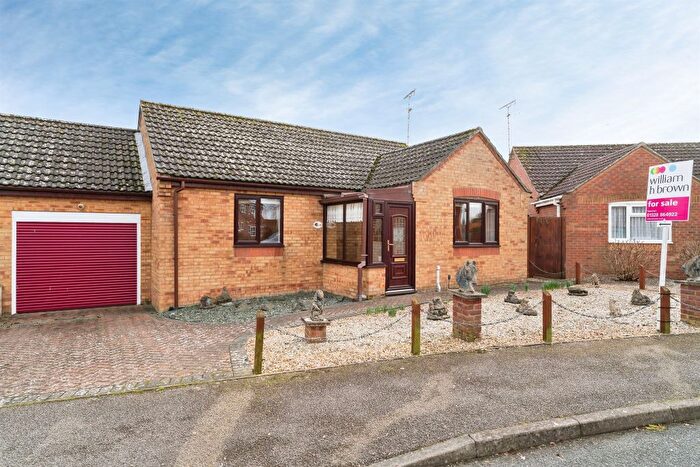
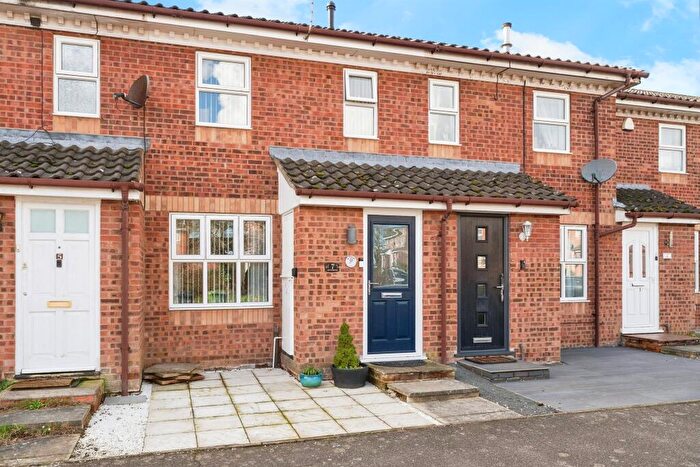
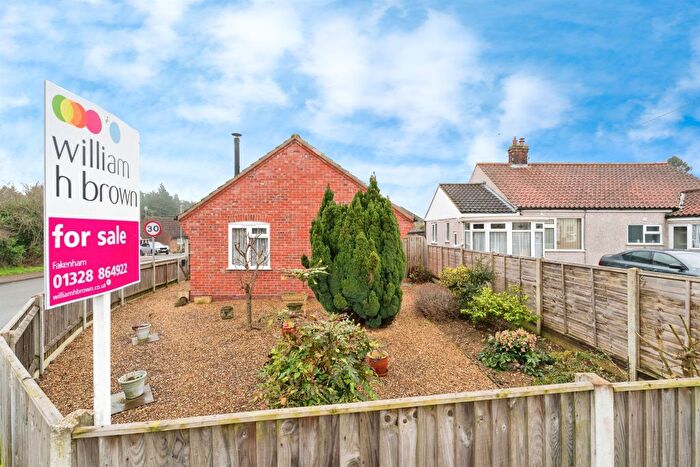
Properties in Wensum have an average house price of £380,915.00 and had 81 Property Transactions within the last 3 years¹.
Wensum is an area in Fakenham, Norfolk with 877 households², where the most expensive property was sold for £1,547,000.00.
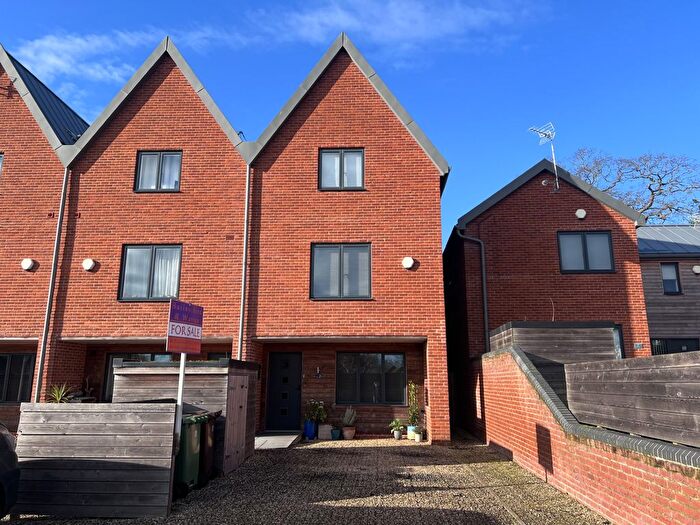
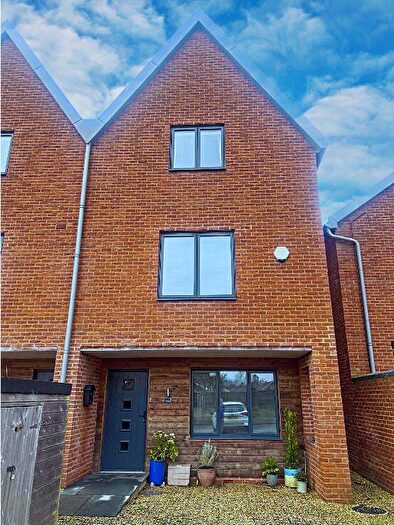
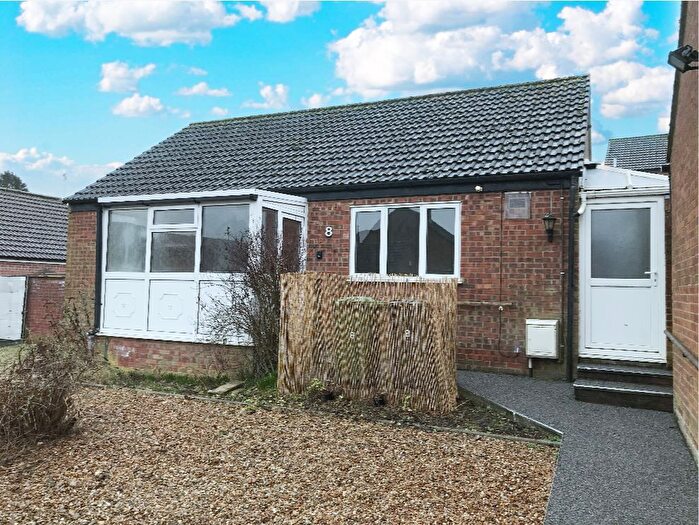
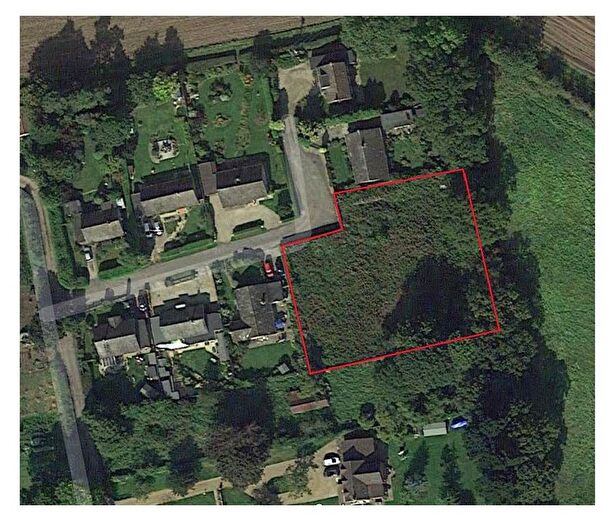
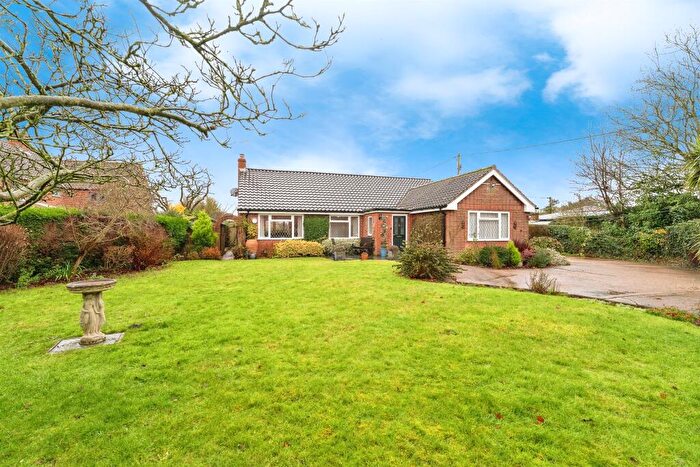
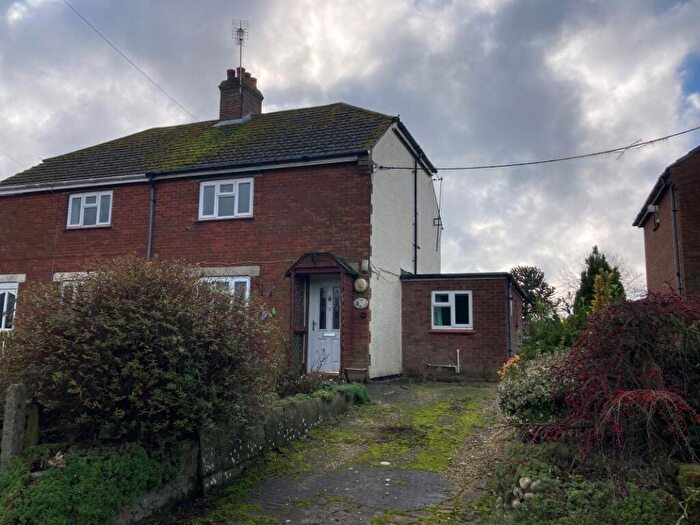
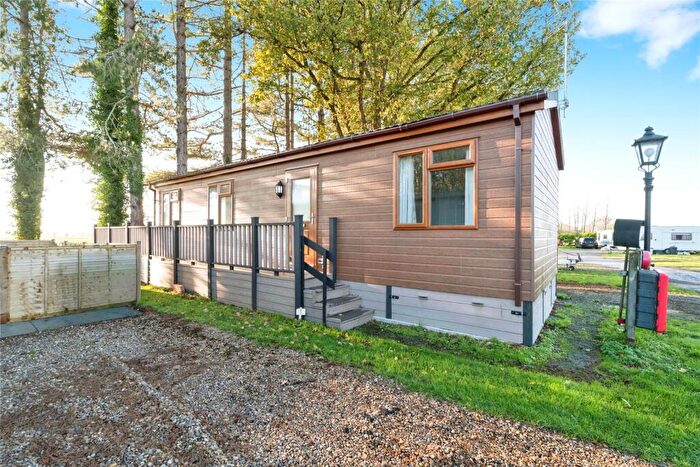
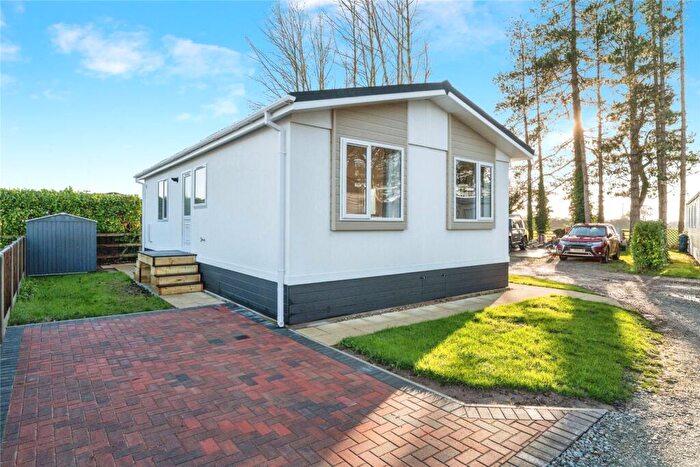
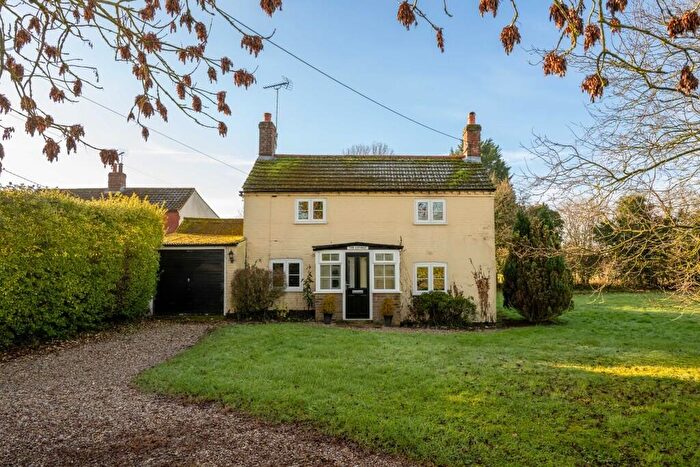
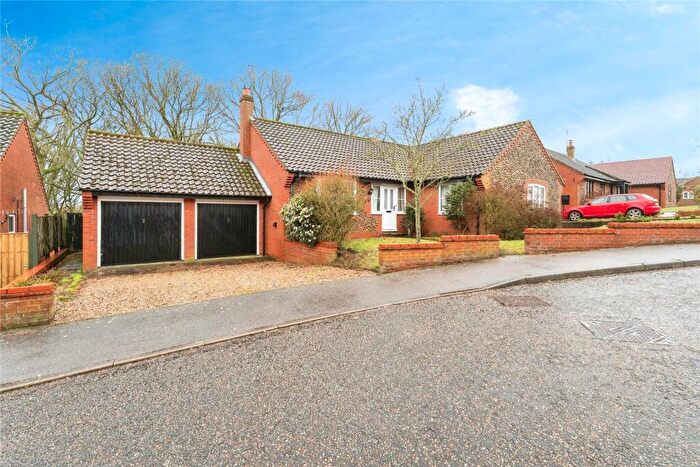
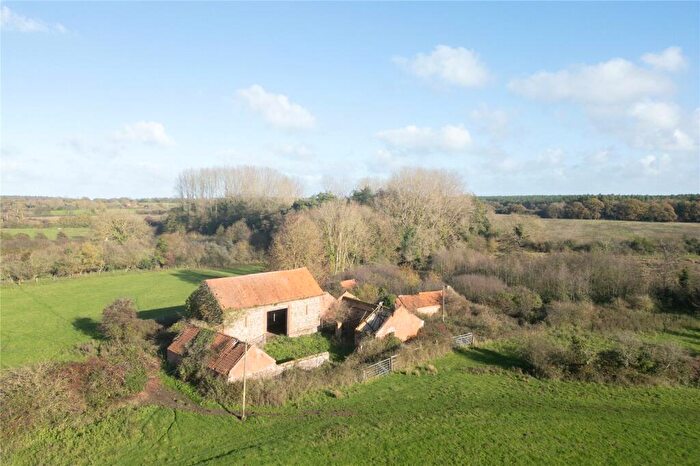
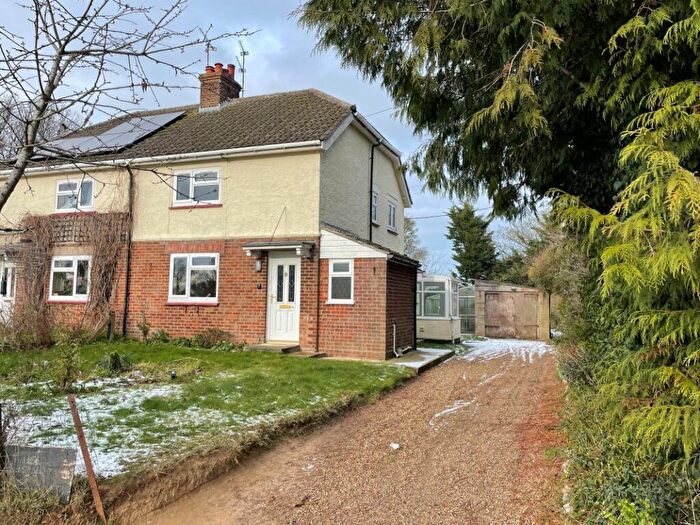
Properties for sale in Wensum
Roads and Postcodes in Wensum
Navigate through our locations to find the location of your next house in Wensum, Fakenham for sale or to rent.
| Streets | Postcodes |
|---|---|
| Balls Lane | NR21 0BX |
| Bell Close | NR21 0HX |
| Brick Kiln Road | NR21 0BQ |
| Bridge Road | NR21 0DZ |
| Bull Close Lane | NR21 0JR |
| Church Lane | NR21 0BW |
| Clarks Lane | NR21 0BS |
| Cushing Drive | NR21 0NY |
| Fakenham Road | NR21 0BD NR21 0EN NR21 0LN NR21 7AG NR21 7AN NR21 7AQ NR21 7AW |
| Field Dalling Road | NR21 0QS |
| Fulmodeston Road | NR21 0LT NR21 0NA |
| Great Ryburgh Road | NR21 0EE |
| Great Snoring Road | NR21 0HT |
| Green Farm Lane | NR21 0RX |
| Guist Bottom Road | NR21 0AG NR21 0AQ |
| Gunthorpe Road | NR21 0QR |
| Hares Close | NR21 0NZ |
| Heath Lane | NR21 0BN |
| Highfield Close | NR21 7AT |
| Highfield Lane | NR21 7AL |
| Hillcrest | NR21 0DY |
| Hindringham Road | NR21 0BL |
| Holt Road | NR21 0AX NR21 0AY NR21 0AZ NR21 0BA NR21 0JF |
| Kettlestone Road | NR21 0JE NR21 0JQ |
| Lacey Way | NR21 0GY |
| Langor Bridge | NR21 0LL NR21 0LW |
| Little Snoring Road | NR21 0JH |
| Manor Close | NR21 0JP |
| Mill Road | NR21 0EB |
| Moor End Lane | NR21 0EJ |
| Moor End Road | NR21 0EQ |
| North Lane | NR21 0BP |
| Oaklands | NR21 0JG |
| Orchard Grove | NR21 0DA |
| Pit Cottages | NR21 0QH NR21 0QP |
| Sharrington Road | NR21 0QX NR21 0QY NR21 0QZ |
| Slade Road | NR21 0QJ |
| Station Road | NR21 0AE NR21 0BG NR21 0DX |
| Stevens Road | NR21 0GZ |
| The Common | NR21 0QG |
| The Croft | NR21 0JS |
| The Glebe | NR21 0LU |
| The Hill | NR21 0HZ |
| The Pastures | NR21 0RY |
| The Street | NR21 0AJ NR21 0AS NR21 0AU NR21 0HU NR21 0JB NR21 0LS NR21 0RB |
| The Warren | NR21 0JU |
| Thursford Road | NR21 0JJ NR21 0JN NR21 0JW |
| Walsingham Road | NR21 0PB |
| Wensum Court | NR21 0ER |
| Westwood Lane | NR21 7AP |
| Wood Norton Road | NR21 0EX NR21 0EY |
Transport near Wensum
-
Sheringham Station
-
West Runton Station
-
Roughton Road Station
-
Cromer Station
-
Gunton Station
-
North Walsham Station
- FAQ
- Price Paid By Year
- Property Type Price
Frequently asked questions about Wensum
What is the average price for a property for sale in Wensum?
The average price for a property for sale in Wensum is £380,915. This amount is 18% higher than the average price in Fakenham. There are 977 property listings for sale in Wensum.
What streets have the most expensive properties for sale in Wensum?
The streets with the most expensive properties for sale in Wensum are Bull Close Lane at an average of £1,150,000, Field Dalling Road at an average of £614,000 and Wood Norton Road at an average of £555,000.
What streets have the most affordable properties for sale in Wensum?
The streets with the most affordable properties for sale in Wensum are Hares Close at an average of £172,400, Holt Road at an average of £183,000 and Hillcrest at an average of £190,000.
Which train stations are available in or near Wensum?
Some of the train stations available in or near Wensum are Sheringham, West Runton and Roughton Road.
Property Price Paid in Wensum by Year
The average sold property price by year was:
| Year | Average Sold Price | Price Change |
Sold Properties
|
|---|---|---|---|
| 2025 | £361,391 | -2% |
23 Properties |
| 2024 | £367,924 | -13% |
33 Properties |
| 2023 | £416,024 | 12% |
25 Properties |
| 2022 | £364,419 | 3% |
28 Properties |
| 2021 | £355,136 | 2% |
47 Properties |
| 2020 | £347,579 | 9% |
41 Properties |
| 2019 | £316,261 | -10% |
21 Properties |
| 2018 | £348,000 | 22% |
31 Properties |
| 2017 | £272,743 | -10% |
39 Properties |
| 2016 | £299,640 | 10% |
44 Properties |
| 2015 | £270,783 | 4% |
60 Properties |
| 2014 | £259,511 | -2% |
44 Properties |
| 2013 | £264,720 | 7% |
36 Properties |
| 2012 | £245,979 | -15% |
24 Properties |
| 2011 | £282,793 | -5% |
23 Properties |
| 2010 | £296,975 | 29% |
35 Properties |
| 2009 | £212,206 | -15% |
30 Properties |
| 2008 | £243,791 | -25% |
17 Properties |
| 2007 | £304,940 | 10% |
40 Properties |
| 2006 | £274,705 | 33% |
43 Properties |
| 2005 | £183,538 | -19% |
26 Properties |
| 2004 | £219,136 | 12% |
45 Properties |
| 2003 | £193,516 | 25% |
42 Properties |
| 2002 | £144,272 | 15% |
47 Properties |
| 2001 | £123,234 | -2% |
50 Properties |
| 2000 | £125,836 | 38% |
45 Properties |
| 1999 | £77,530 | -1% |
45 Properties |
| 1998 | £78,095 | -6% |
41 Properties |
| 1997 | £82,800 | 11% |
40 Properties |
| 1996 | £73,740 | -16% |
49 Properties |
| 1995 | £85,424 | - |
32 Properties |
Property Price per Property Type in Wensum
Here you can find historic sold price data in order to help with your property search.
The average Property Paid Price for specific property types in the last three years are:
| Property Type | Average Sold Price | Sold Properties |
|---|---|---|
| Semi Detached House | £251,384.00 | 26 Semi Detached Houses |
| Detached House | £497,990.00 | 42 Detached Houses |
| Terraced House | £261,730.00 | 13 Terraced Houses |

