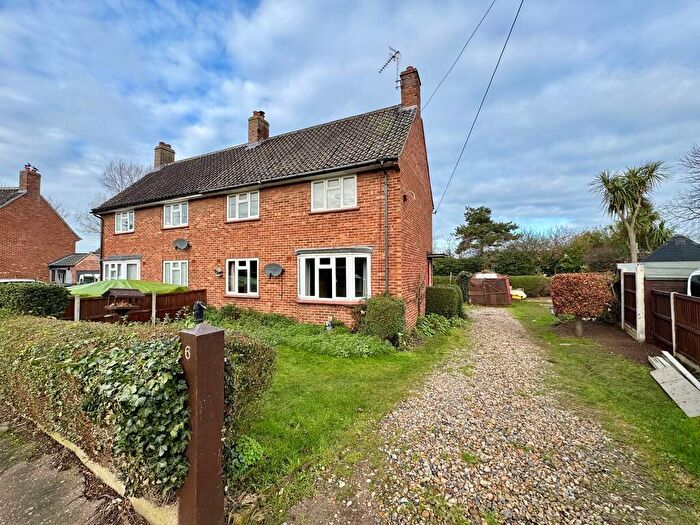
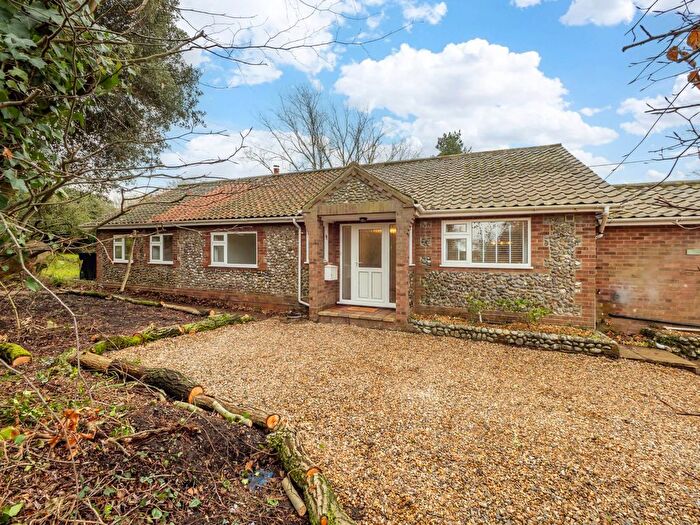
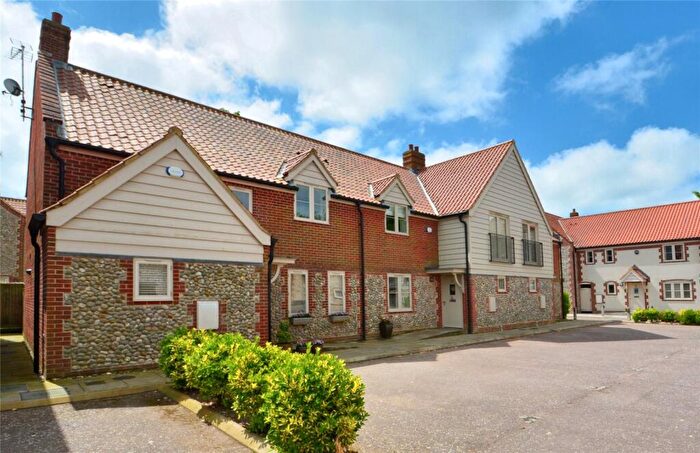
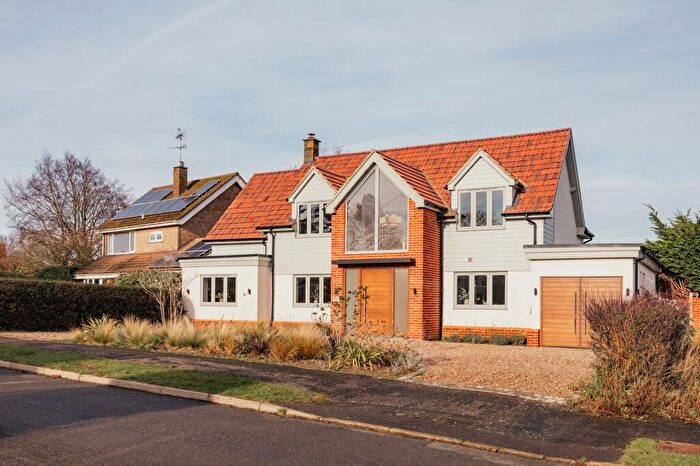
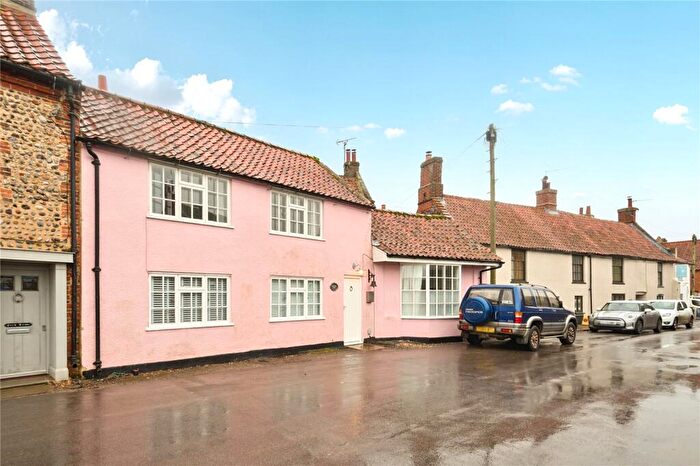
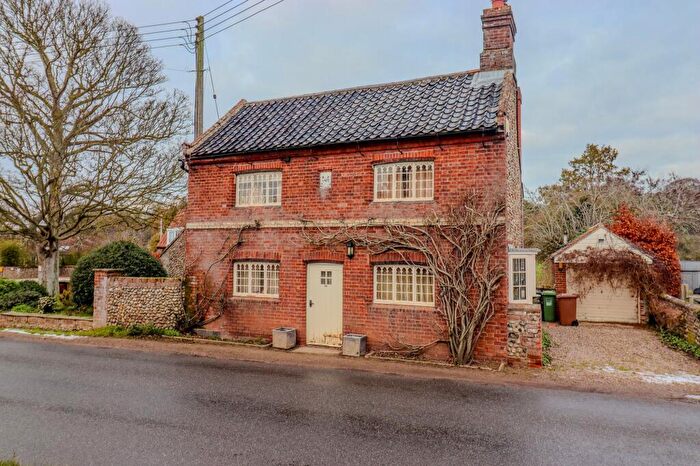
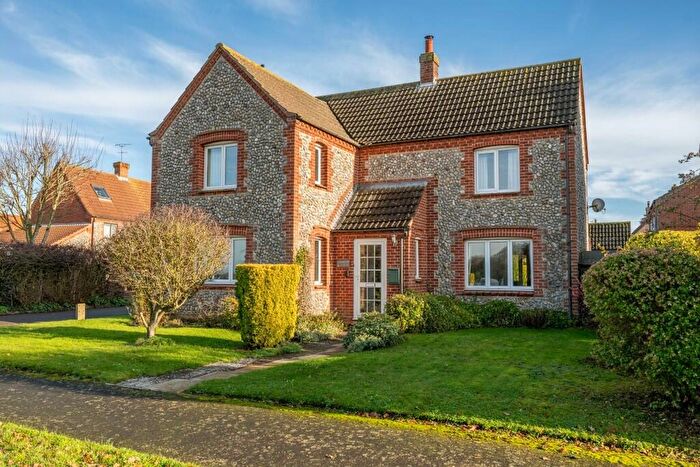
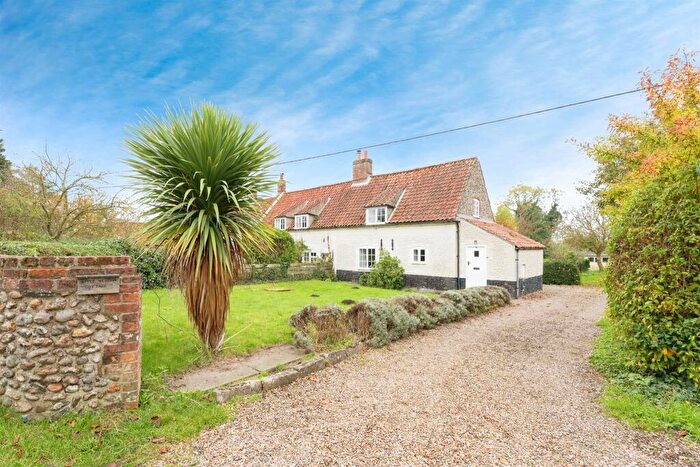
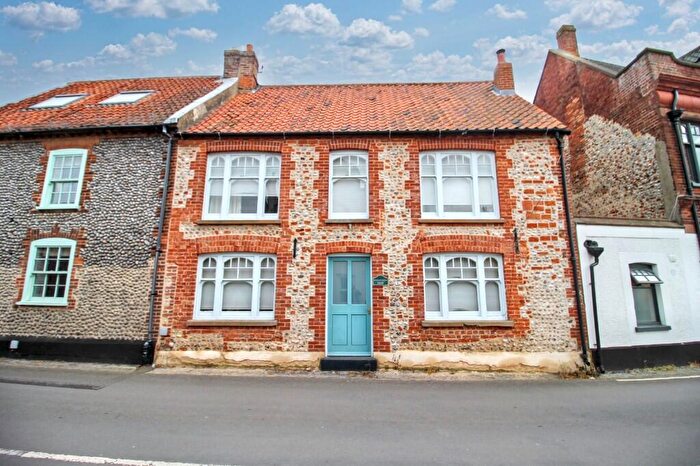
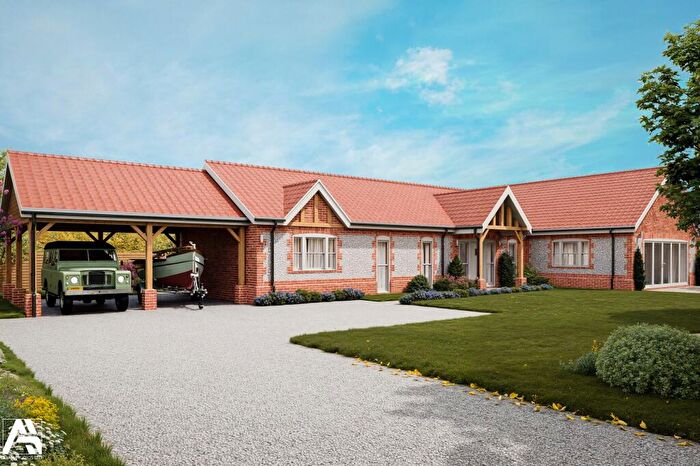
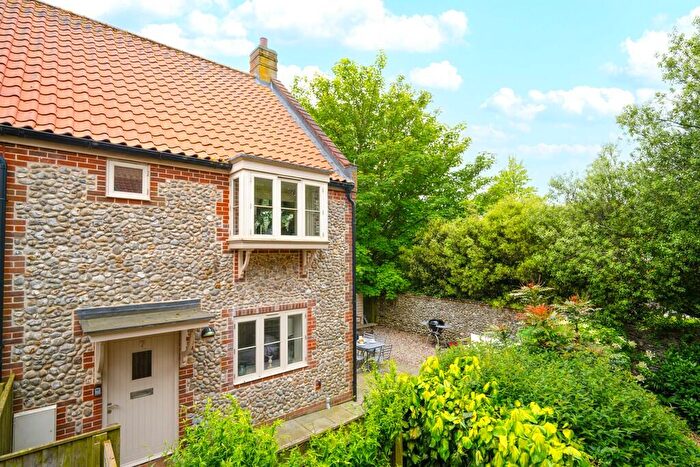
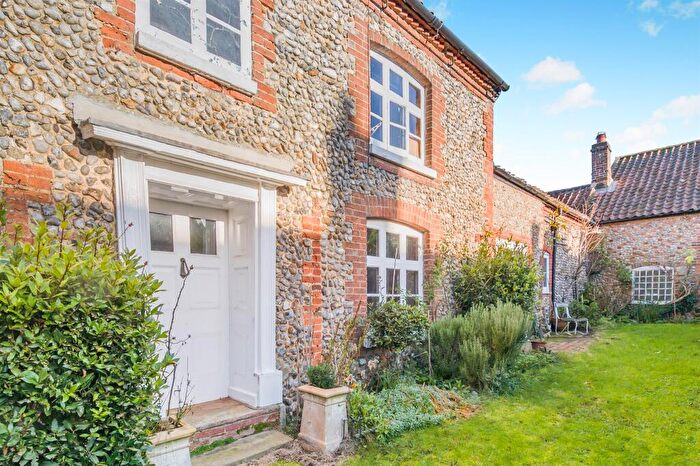
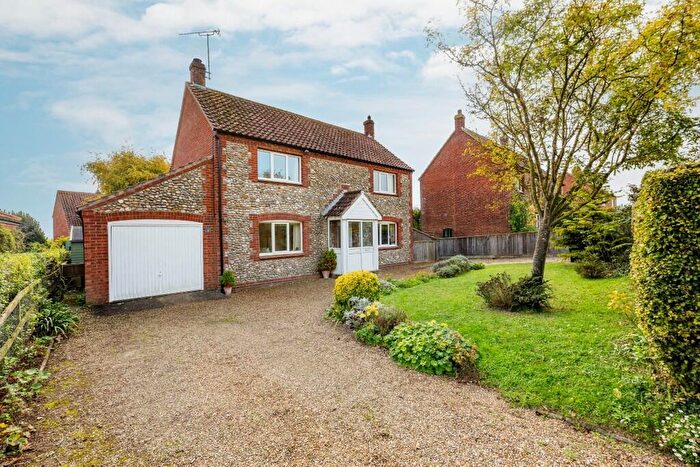
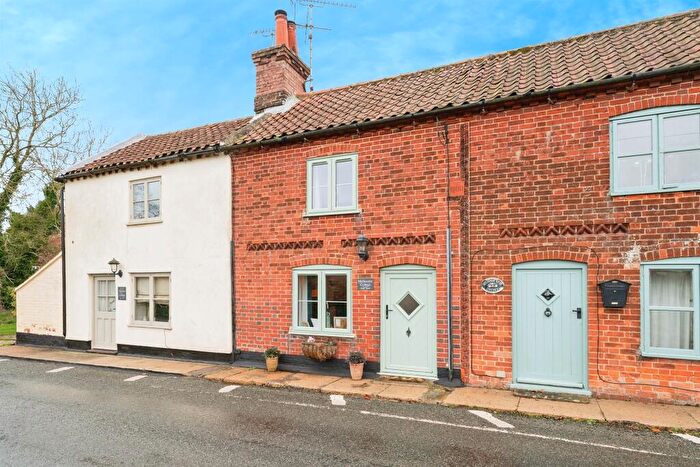
Houses for sale & to rent in Glaven Valley, Holt
House Prices in Glaven Valley
Properties in Glaven Valley have an average house price of £836,881.00 and had 86 Property Transactions within the last 3 years¹.
Glaven Valley is an area in Holt, Norfolk with 672 households², where the most expensive property was sold for £6,000,000.00.
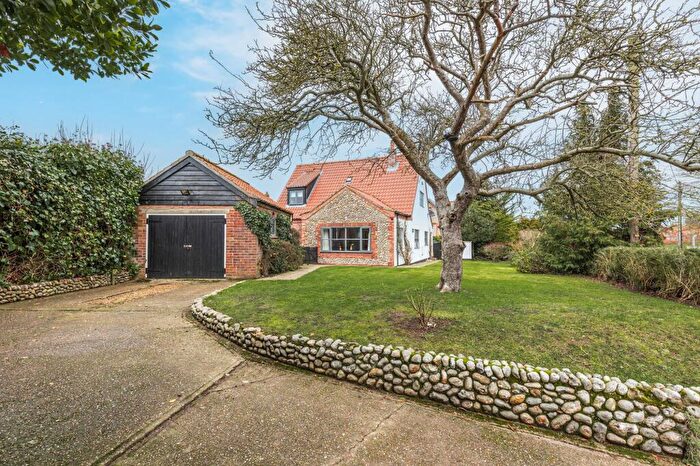
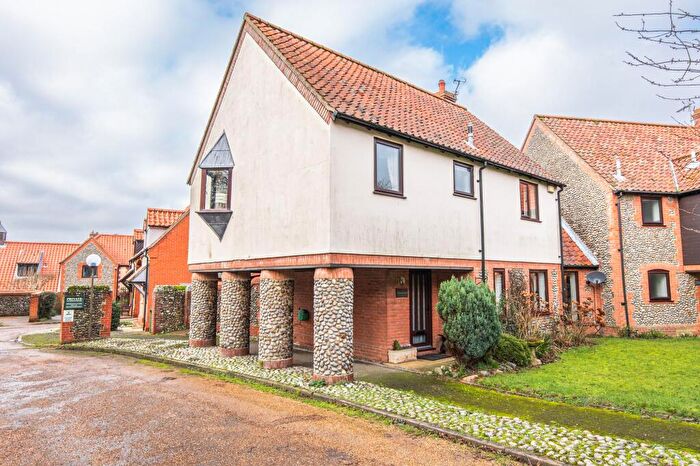
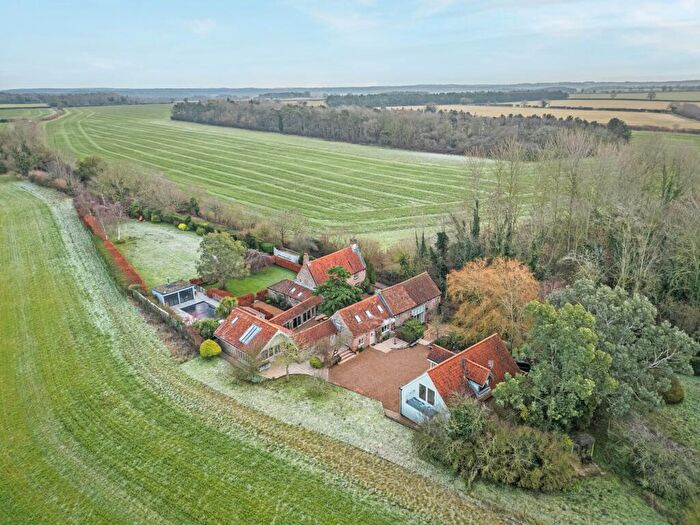
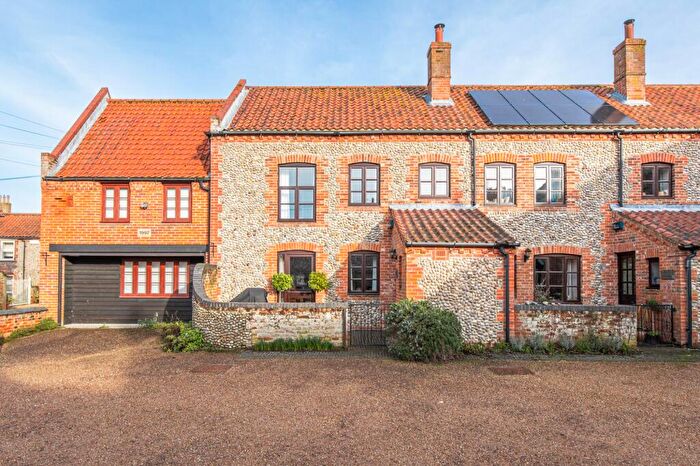
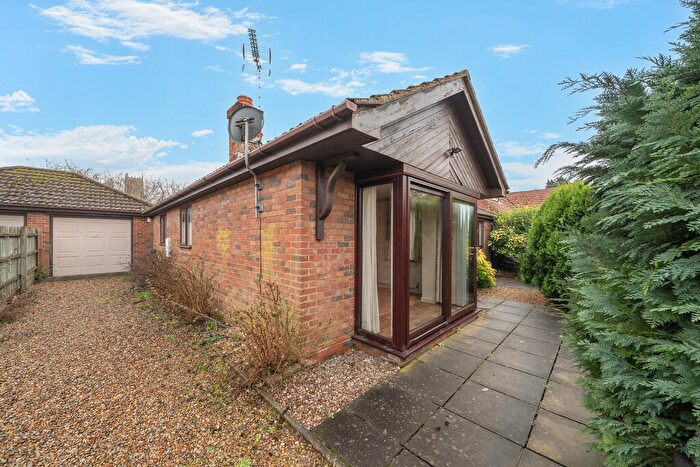
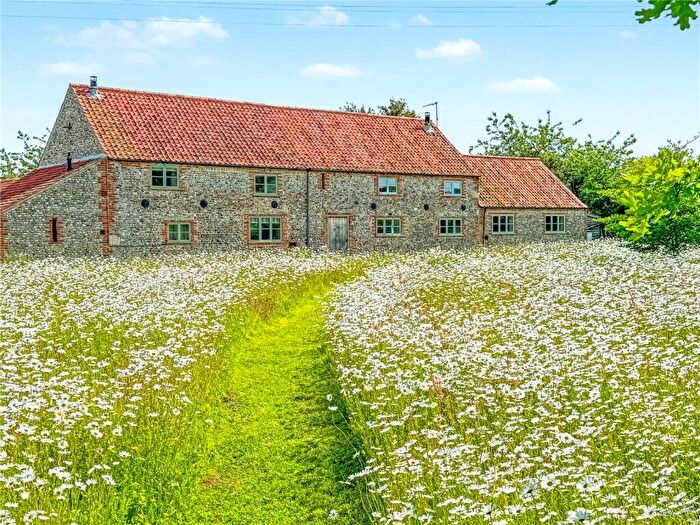
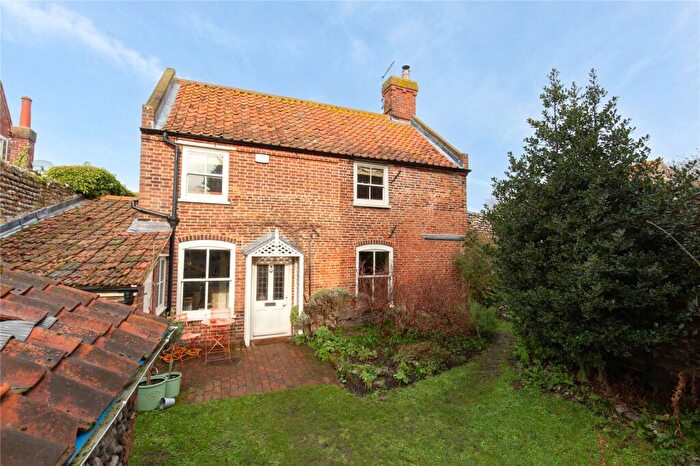
Properties for sale in Glaven Valley
Roads and Postcodes in Glaven Valley
Navigate through our locations to find the location of your next house in Glaven Valley, Holt for sale or to rent.
| Streets | Postcodes |
|---|---|
| Back Lane | NR25 7NP NR25 7NR |
| Barnaway Lane | NR25 7JH |
| Binham Road | NR25 7LJ NR25 7LL |
| Blakeney Road | NR25 7BQ NR25 7JL NR25 7JW NR25 7TL NR25 7TN |
| Blakeney Short Lane | NR25 7JT |
| Chapel Street | NR25 7TQ |
| Church Lane | NR25 7YA |
| Cley Road | NR25 7NL |
| Coronation Lane | NR25 7NS |
| Field Dalling Road | NR25 7JY NR25 7LB NR25 7LD |
| Foundry Row | NR25 7QF |
| Glandford Road | NR25 7TW |
| Hall Lane | NR25 7TG |
| High Street | NR25 7AL NR25 7NA NR25 7NT NR25 7NU NR25 7NX NR25 7PS |
| Highfield | NR25 7LF |
| Hillside | NR25 7QQ |
| Holt Road | NR25 7AR NR25 7AS NR25 7LE NR25 7QB NR25 7QN NR25 7QW NR25 7YB |
| Hurdle Lane | NR25 7JR |
| Kingsway | NR25 7PL |
| Langham Road | NR25 7LG NR25 7LQ NR25 7PG NR25 7PJ NR25 7PW |
| Leatherpool Lane | NR25 7TF |
| Letheringsett Road | NR25 7QD |
| Little Lane | NR25 7NH |
| Long Lane | NR25 7DD |
| Mariners Hill | NR25 7NB |
| Morston Road | NR25 7BD NR25 7BE NR25 7BG NR25 7PF |
| New Road | NR25 7NY NR25 7NZ NR25 7PA |
| North Street | NR25 7DH |
| Old Rectory Lane | NR25 7PY |
| Pintail Drive | NR25 7DF |
| Post Yard | NR25 7JQ |
| Pyes Close | NR25 7AY |
| Queens Close | NR25 7PQ |
| Riverside Road | NR25 7YD NR25 7YE |
| Samphire Close | NR25 7PE |
| Saxlingham Road | NR25 7PB |
| School Road | NR25 7JZ NR25 7LA |
| Smokers Hole | NR25 7JU |
| South Close | NR25 7BN |
| Stiffkey Road | NR25 7BJ |
| The Common | NR25 7QJ |
| The Pastures | NR25 7LY |
| The Quay | NR25 7NF |
| The Street | NR25 7AA NR25 7AD NR25 7BH NR25 7QG NR25 7TH NR25 7TJ |
| Thornage Road | NR25 7JB NR25 7JD NR25 7JF |
| Westgate Street | NR25 7NQ |
| Whiteways | NR25 7PX |
| Wilsons Way | NR25 7PU |
| Wiveton Road | NR25 7NJ |
| NR25 7JE NR25 7JP |
Transport near Glaven Valley
- FAQ
- Price Paid By Year
- Property Type Price
Frequently asked questions about Glaven Valley
What is the average price for a property for sale in Glaven Valley?
The average price for a property for sale in Glaven Valley is £836,881. This amount is 65% higher than the average price in Holt. There are 194 property listings for sale in Glaven Valley.
What streets have the most expensive properties for sale in Glaven Valley?
The streets with the most expensive properties for sale in Glaven Valley are Morston Road at an average of £2,013,750, Binham Road at an average of £1,450,000 and Wiveton Road at an average of £1,435,000.
What streets have the most affordable properties for sale in Glaven Valley?
The streets with the most affordable properties for sale in Glaven Valley are Highfield at an average of £200,000, Letheringsett Road at an average of £251,000 and Queens Close at an average of £350,000.
Which train stations are available in or near Glaven Valley?
Some of the train stations available in or near Glaven Valley are Sheringham, West Runton and Cromer.
Property Price Paid in Glaven Valley by Year
The average sold property price by year was:
| Year | Average Sold Price | Price Change |
Sold Properties
|
|---|---|---|---|
| 2025 | £645,019 | -38% |
21 Properties |
| 2024 | £890,391 | -2% |
37 Properties |
| 2023 | £910,069 | 8% |
28 Properties |
| 2022 | £840,005 | 31% |
30 Properties |
| 2021 | £580,812 | 1% |
43 Properties |
| 2020 | £572,121 | 2% |
41 Properties |
| 2019 | £560,485 | 17% |
35 Properties |
| 2018 | £462,725 | -27% |
30 Properties |
| 2017 | £587,655 | 13% |
45 Properties |
| 2016 | £512,741 | 6% |
47 Properties |
| 2015 | £481,450 | 11% |
56 Properties |
| 2014 | £429,658 | -6% |
47 Properties |
| 2013 | £456,815 | 13% |
46 Properties |
| 2012 | £396,906 | -39% |
30 Properties |
| 2011 | £549,989 | 28% |
29 Properties |
| 2010 | £398,618 | 13% |
34 Properties |
| 2009 | £347,119 | -19% |
21 Properties |
| 2008 | £411,880 | 6% |
30 Properties |
| 2007 | £386,551 | 10% |
44 Properties |
| 2006 | £346,036 | -5% |
53 Properties |
| 2005 | £364,347 | 19% |
47 Properties |
| 2004 | £296,050 | 16% |
32 Properties |
| 2003 | £249,691 | 9% |
49 Properties |
| 2002 | £226,336 | 17% |
33 Properties |
| 2001 | £187,898 | 5% |
35 Properties |
| 2000 | £178,039 | 20% |
41 Properties |
| 1999 | £141,946 | 1% |
53 Properties |
| 1998 | £140,649 | 23% |
29 Properties |
| 1997 | £108,488 | 19% |
41 Properties |
| 1996 | £87,836 | 10% |
50 Properties |
| 1995 | £79,387 | - |
31 Properties |
Property Price per Property Type in Glaven Valley
Here you can find historic sold price data in order to help with your property search.
The average Property Paid Price for specific property types in the last three years are:
| Property Type | Average Sold Price | Sold Properties |
|---|---|---|
| Semi Detached House | £480,623.00 | 15 Semi Detached Houses |
| Detached House | £1,078,146.00 | 51 Detached Houses |
| Terraced House | £495,105.00 | 19 Terraced Houses |
| Flat | £370,000.00 | 1 Flat |

