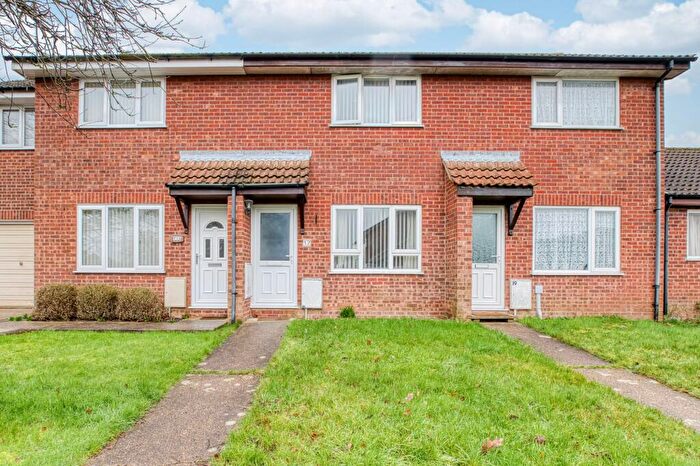
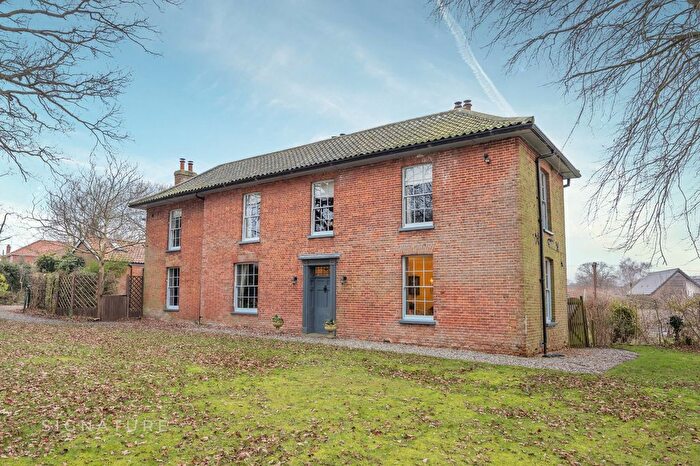
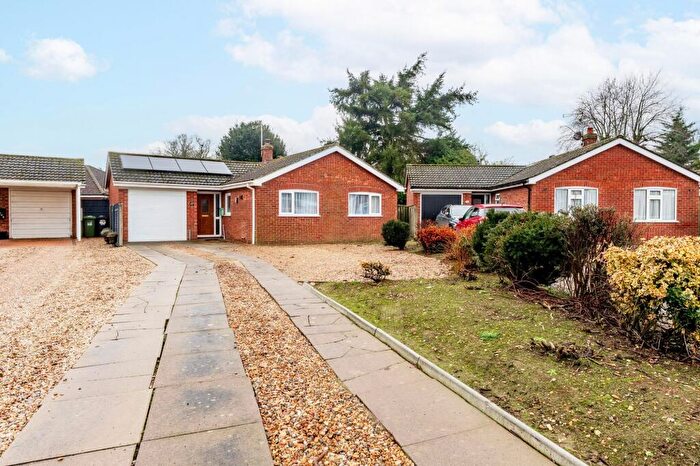
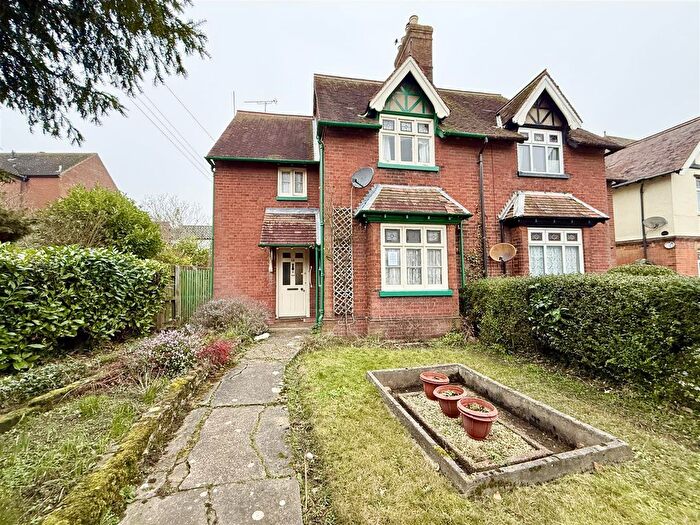
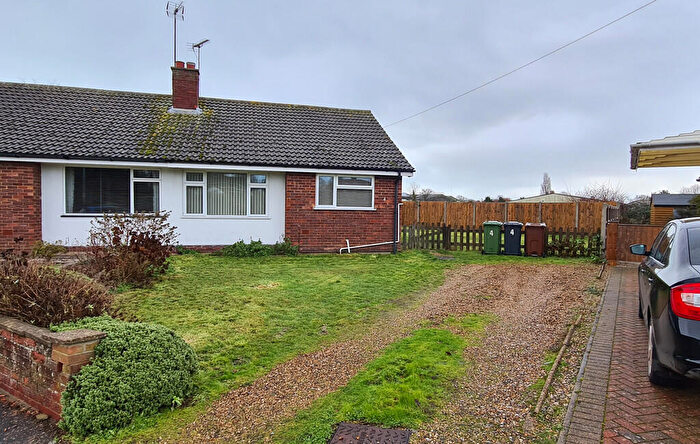
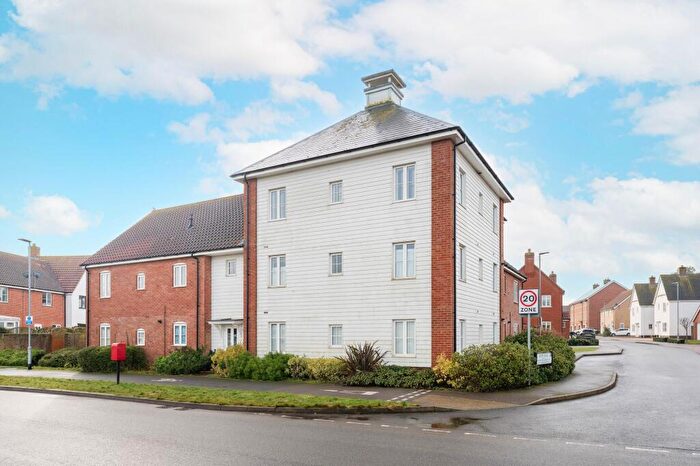
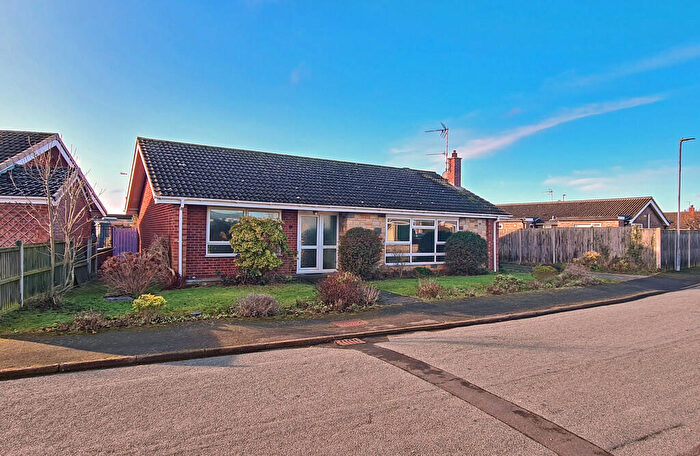
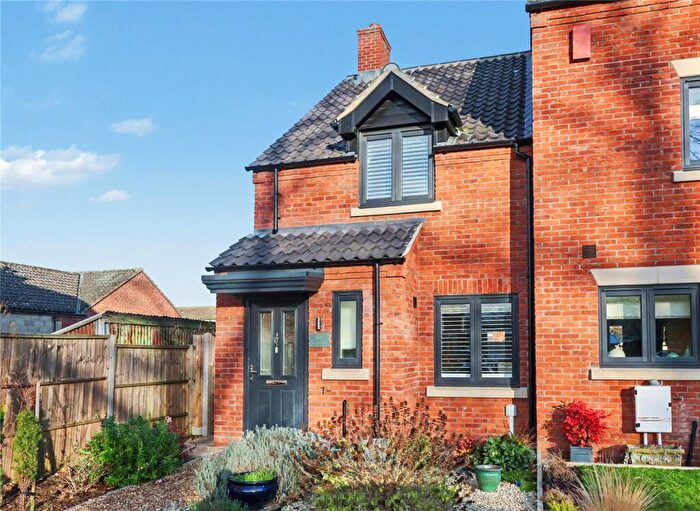
Houses for sale & to rent in North Walsham North, North Walsham
House Prices in North Walsham North
Properties in North Walsham North have an average house price of £253,736.00 and had 186 Property Transactions within the last 3 years¹.
North Walsham North is an area in North Walsham, Norfolk with 1,813 households², where the most expensive property was sold for £575,000.00.
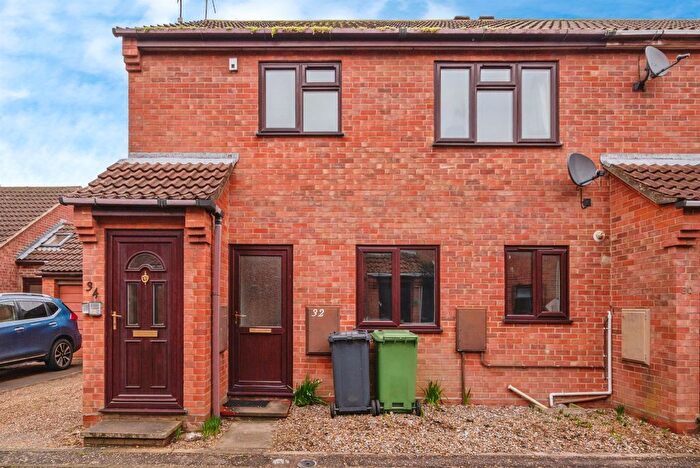
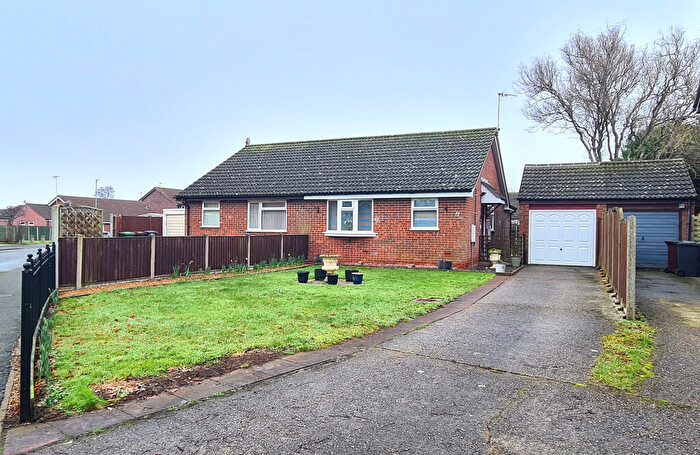
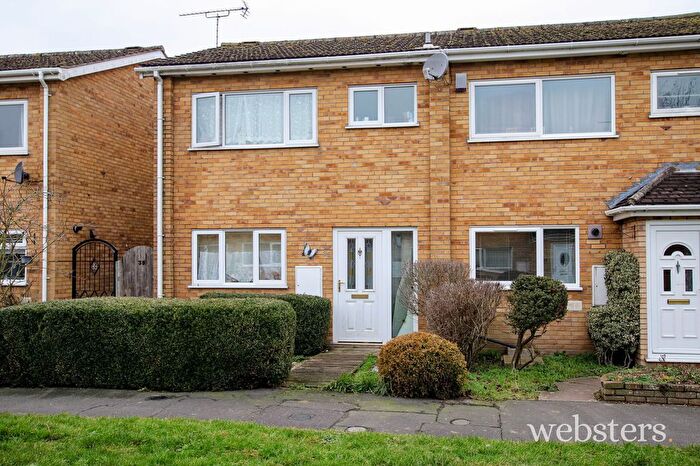
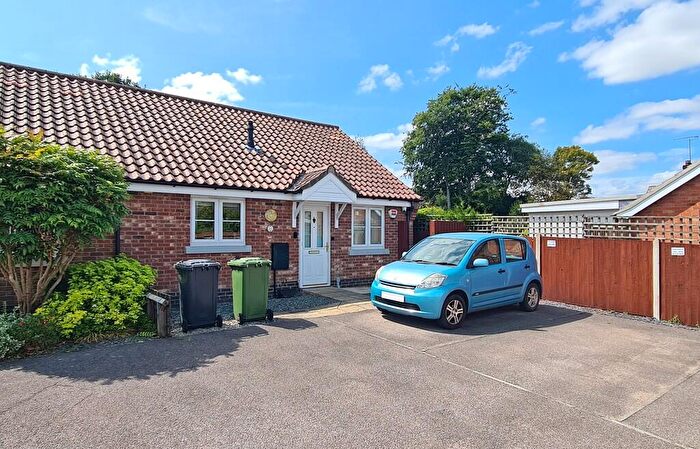
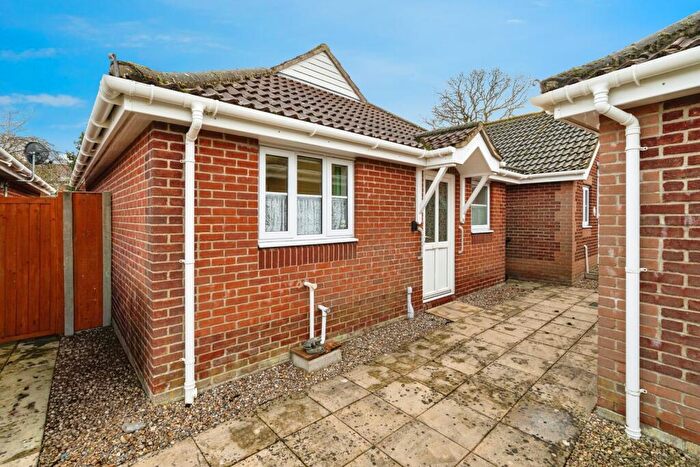
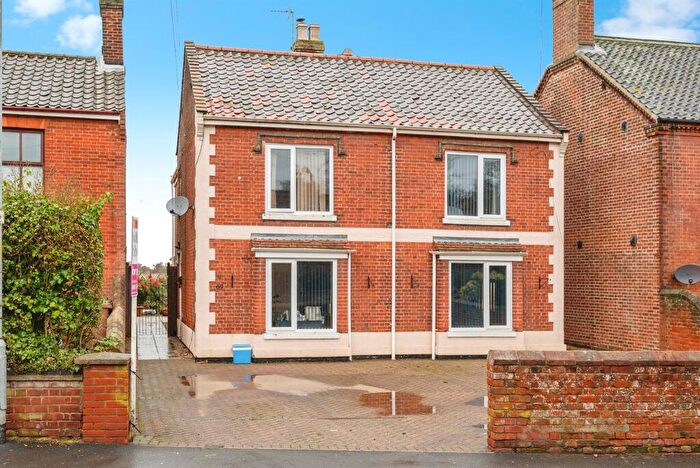
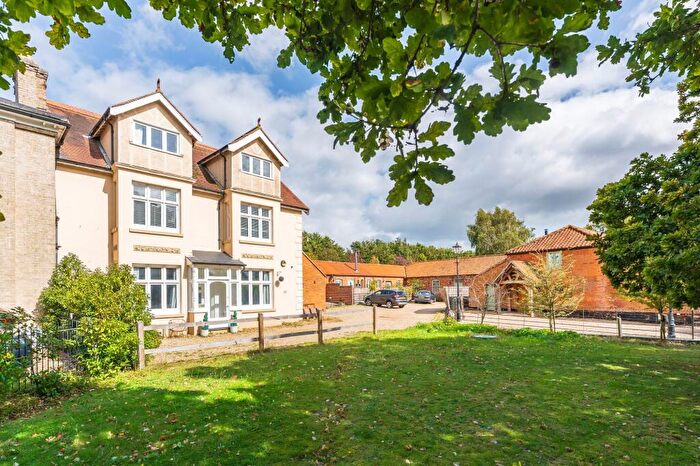
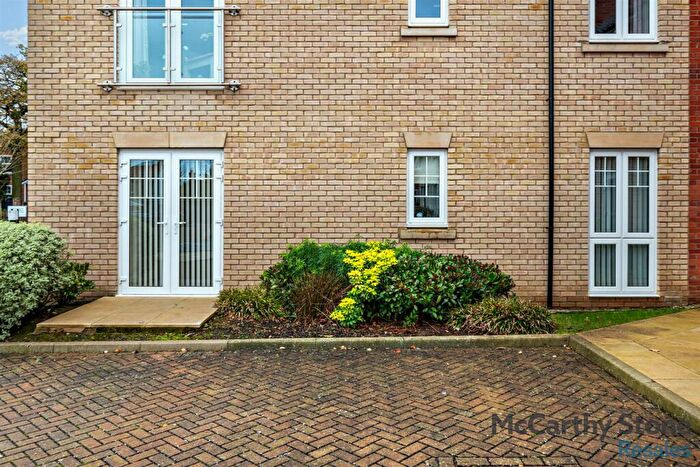
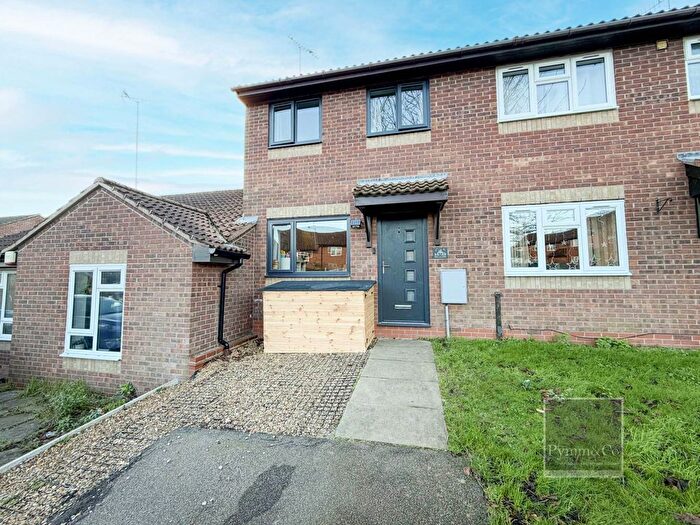
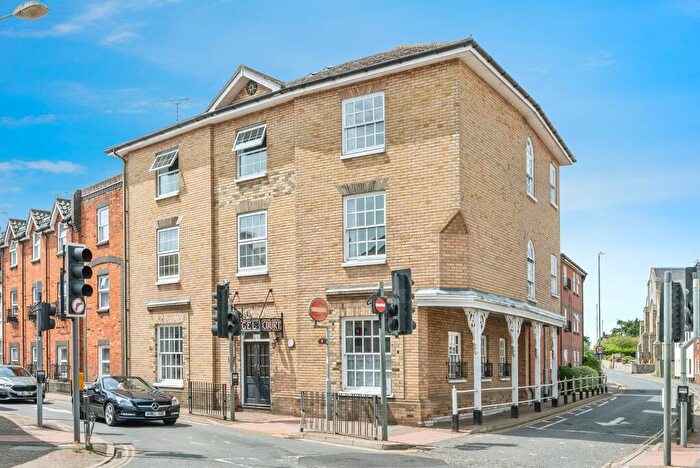
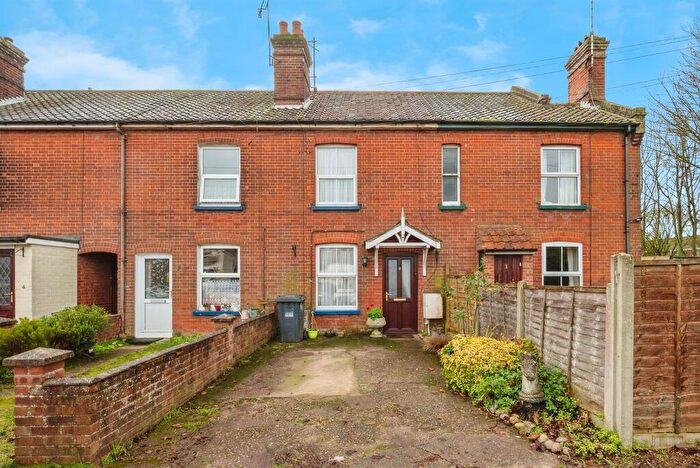
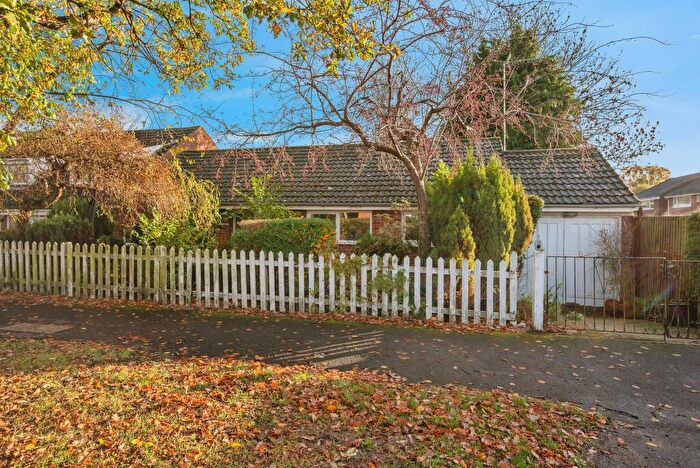
Properties for sale in North Walsham North
Roads and Postcodes in North Walsham North
Navigate through our locations to find the location of your next house in North Walsham North, North Walsham for sale or to rent.
| Streets | Postcodes |
|---|---|
| Acacia Drive | NR28 0UX |
| Acorn Road | NR28 0UA |
| Alder Close | NR28 0UT |
| Antingham Drive | NR28 9BE |
| Arnold Pitcher Close | NR28 0FG |
| Ashfield Road | NR28 9EL |
| Bacton Road | NR28 0DN NR28 0DW NR28 0RA NR28 9DR NR28 9DS |
| Beatrice Close | NR28 0BB |
| Beech Drive | NR28 0BZ |
| Birch Close | NR28 0UD |
| Bluebell Road | NR28 9EH NR28 9EJ NR28 9ET |
| Cooper Road | NR28 9EN |
| Corbett Road | NR28 0JE |
| Crow Road | NR28 0DJ |
| Debenne Road | NR28 0LZ |
| Garden Close | NR28 0AY |
| Glebe Court | NR28 9EX |
| Gooch Close | NR28 0SZ |
| Hadfield Road | NR28 0BE |
| Hamilton Close | NR28 0AQ |
| Hamlet Close | NR28 0DL |
| Hannant Road | NR28 9ES |
| Harbord Close | NR28 0TA |
| Hardy Close | NR28 0TQ |
| Harvey Drive | NR28 0TJ |
| Hazell Road | NR28 0ST |
| Hipperson Close | NR28 0SU |
| Juler Close | NR28 0SY |
| Little London | NR28 0RB |
| Lynfield Road | NR28 0BG NR28 0DP NR28 0SW |
| Lyngate Road | NR28 0DH |
| Maybank | NR28 0EZ |
| Mayfield Way | NR28 0DQ |
| Meadow Close | NR28 0AX |
| Melbourne Road | NR28 9EP |
| Mundesley Road | NR28 0DA NR28 0DB NR28 0DD NR28 0PB NR28 0RD NR28 0RE |
| Nelson Way | NR28 0AL |
| Northfield Road | NR28 0AR NR28 0AS |
| Northmead Drive | NR28 0AU |
| Oaklands Park | NR28 0AG |
| Orchard Close | NR28 0AZ |
| Osborne Close | NR28 0SX |
| Page Close | NR28 0LX |
| Pellew Place | NR28 0UE |
| Petre Close | NR28 0SS |
| Pickford Close | NR28 0UH |
| Preston Road | NR28 9ER |
| Rye Close | NR28 9EY |
| Shepheard Close | NR28 0LY |
| St Marys Way | NR28 0AP |
| Stanley Road | NR28 9EW |
| Swafield Rise | NR28 0DF NR28 0DG |
| Sycamore Close | NR28 0UB |
| The Lea | NR28 9DN |
| Victory Court | NR28 0AE |
| Wharton Drive | NR28 0UG |
| Wherry Close | NR28 0UQ |
| Williams Way | NR28 0BA |
| Willow Close | NR28 0UR |
| Wooll Drive | NR28 0UF |
Transport near North Walsham North
- FAQ
- Price Paid By Year
- Property Type Price
Frequently asked questions about North Walsham North
What is the average price for a property for sale in North Walsham North?
The average price for a property for sale in North Walsham North is £253,736. This amount is 13% lower than the average price in North Walsham. There are 742 property listings for sale in North Walsham North.
What streets have the most expensive properties for sale in North Walsham North?
The streets with the most expensive properties for sale in North Walsham North are Oaklands Park at an average of £507,500, Maybank at an average of £420,000 and Hannant Road at an average of £410,000.
What streets have the most affordable properties for sale in North Walsham North?
The streets with the most affordable properties for sale in North Walsham North are Victory Court at an average of £111,250, Osborne Close at an average of £164,000 and Wooll Drive at an average of £167,000.
Which train stations are available in or near North Walsham North?
Some of the train stations available in or near North Walsham North are North Walsham, Gunton and Worstead.
Property Price Paid in North Walsham North by Year
The average sold property price by year was:
| Year | Average Sold Price | Price Change |
Sold Properties
|
|---|---|---|---|
| 2025 | £260,630 | 5% |
42 Properties |
| 2024 | £246,955 | -4% |
78 Properties |
| 2023 | £257,363 | -9% |
66 Properties |
| 2022 | £280,700 | 20% |
49 Properties |
| 2021 | £223,930 | 4% |
99 Properties |
| 2020 | £215,888 | 10% |
67 Properties |
| 2019 | £193,521 | -4% |
87 Properties |
| 2018 | £200,935 | -4% |
87 Properties |
| 2017 | £208,289 | 18% |
78 Properties |
| 2016 | £170,790 | 2% |
78 Properties |
| 2015 | £168,095 | 10% |
97 Properties |
| 2014 | £151,281 | -8% |
97 Properties |
| 2013 | £163,703 | 21% |
63 Properties |
| 2012 | £129,141 | -11% |
66 Properties |
| 2011 | £143,174 | -3% |
70 Properties |
| 2010 | £147,444 | 11% |
63 Properties |
| 2009 | £130,584 | -13% |
81 Properties |
| 2008 | £147,977 | -2% |
42 Properties |
| 2007 | £150,880 | 8% |
142 Properties |
| 2006 | £138,261 | 5% |
157 Properties |
| 2005 | £131,521 | 16% |
97 Properties |
| 2004 | £110,397 | 4% |
121 Properties |
| 2003 | £106,358 | 14% |
122 Properties |
| 2002 | £91,371 | 24% |
137 Properties |
| 2001 | £69,546 | 12% |
154 Properties |
| 2000 | £61,291 | 10% |
148 Properties |
| 1999 | £55,235 | 14% |
142 Properties |
| 1998 | £47,532 | -3% |
96 Properties |
| 1997 | £49,144 | 2% |
168 Properties |
| 1996 | £48,310 | 5% |
142 Properties |
| 1995 | £45,913 | - |
113 Properties |
Property Price per Property Type in North Walsham North
Here you can find historic sold price data in order to help with your property search.
The average Property Paid Price for specific property types in the last three years are:
| Property Type | Average Sold Price | Sold Properties |
|---|---|---|
| Semi Detached House | £238,173.00 | 52 Semi Detached Houses |
| Detached House | £327,448.00 | 68 Detached Houses |
| Terraced House | £201,981.00 | 55 Terraced Houses |
| Flat | £130,409.00 | 11 Flats |

