
Houses for sale in Mid Forest, Swaffham
House Prices in Mid Forest
Properties in Mid Forest have an average house price of £394k and had 16 Property Transactions within the last 3 years¹.
Mid Forest is an area in Swaffham, Norfolk with 200 households², where the most expensive property was sold for £805k.
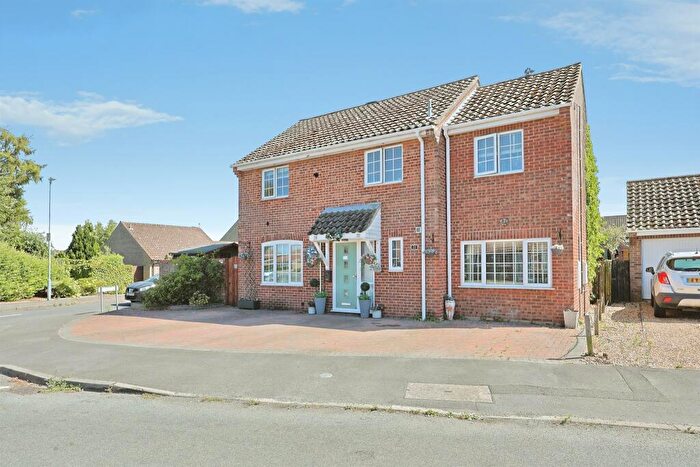
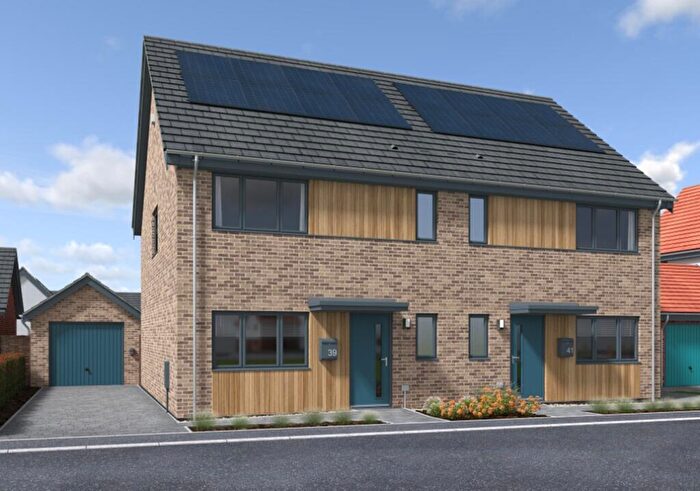
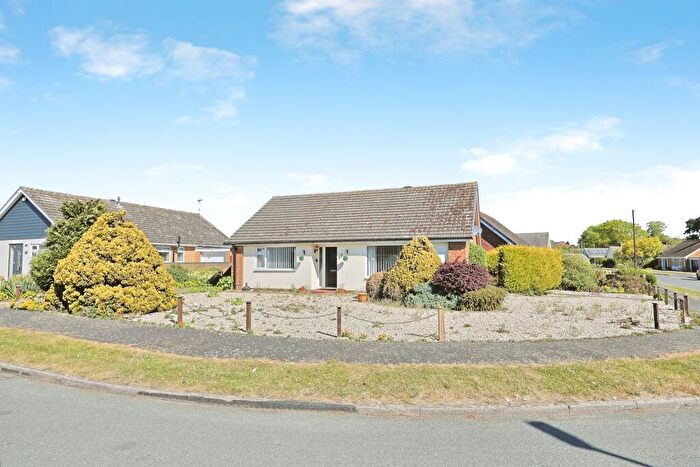
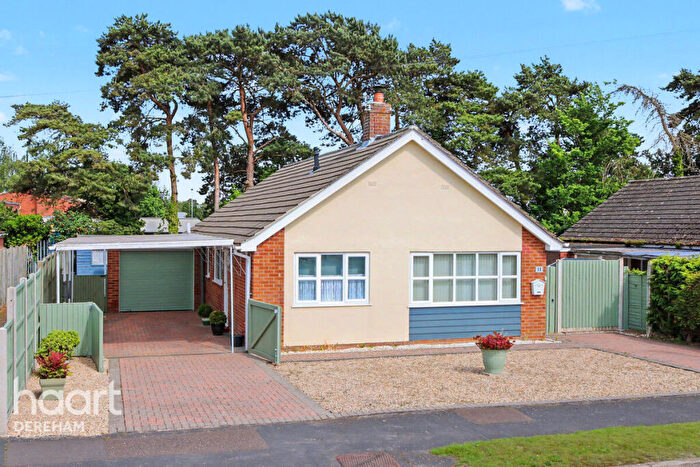
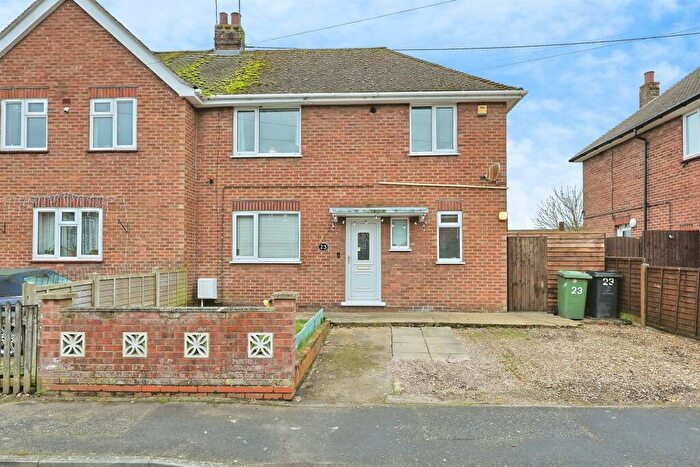
Properties for sale in Mid Forest
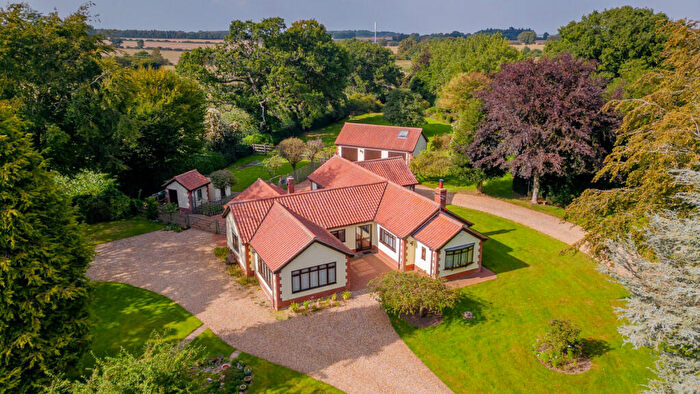

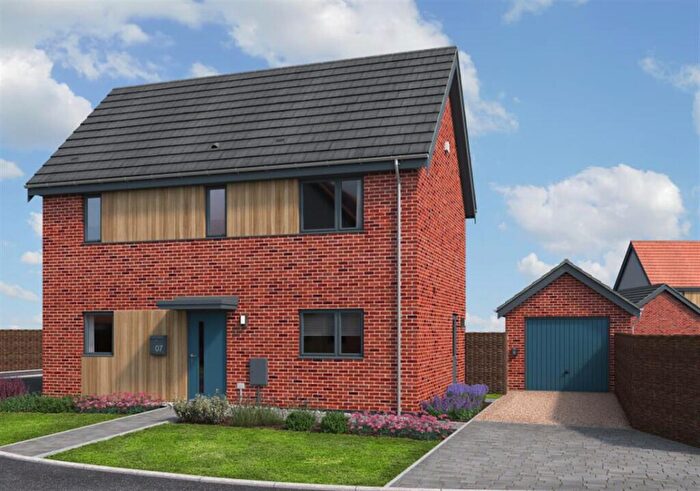
![]()
If you are looking to sell your house, let it out, or receive a property valuation, an expert can help you.
Click the button below to get started.
Roads and Postcodes in Mid Forest
Navigate through our locations to find the location of your next house in Mid Forest, Swaffham for sale or to rent.
| Streets | Postcodes |
|---|---|
| All Saints Way | PE37 8BT PE37 8BU |
| Chestnut Walk | PE37 8AX |
| Church Walk | PE37 8BJ |
| Malthouse Croft | PE37 8HH |
| Old Hall Lane | PE37 8BA |
| Pine Avenue | PE37 8AP |
| Swaffham Road | PE37 8AW |
| The Green | PE37 8BB |
| The Street | PE37 8BD |
| Walters Cottages | PE37 8BH |
| Westview | PE37 8DY |
| PE37 8AN PE37 8AR PE37 8AS PE37 8AU PE37 8AY PE37 8BE PE37 8BL PE37 8DR PE37 8DS |
Property price trends in Mid Forest
According to the latest Land Registry data, the average home in Mid Forest sold for £260,000 in 2026. That figure comes from 199 sales logged over the past 31 years.
Prices have fallen back over the last three years. Compared with 2023, when the typical sale came in around £406,250, that's a fall of roughly 36%.
Looking back five years, average prices are down about 36.9% since 2021, a drop of around £152,100 in cash terms.
Zoom out to the past decade for the fuller picture. Back in 2016, homes here averaged £276,750, so the typical sold price has fallen about 6.1% since then, around 0.6% a year lower. Stretch the view to fifteen years and that annual pace edges up closer to 1.2%.
Frequently asked questions about Mid Forest
What is the average price for a property for sale in Mid Forest?
The average price for a property for sale in Mid Forest is £394,125. This amount is 52% higher than the average price in Swaffham. There are 714 property listings for sale in Mid Forest.
What streets have the most expensive properties for sale in Mid Forest?
The streets with the most expensive properties for sale in Mid Forest are The Street at an average of £385,000 and All Saints Way at an average of £347,666.
What streets have the most affordable properties for sale in Mid Forest?
The streets with the most affordable properties for sale in Mid Forest are Swaffham Road at an average of £270,000 and Chestnut Walk at an average of £277,497.
Which train stations are available in or near Mid Forest?
Some of the train stations available in or near Mid Forest are Downham Market, Watlington and Brandon.
Property Price Paid in Mid Forest by Year
The average sold property price by year was:
| Year | Average Sold Price | Price Change |
Sold Properties
|
|---|---|---|---|
| 2026 | £260,000 | -74% |
1 Property |
| 2025 | £452,573 | 31% |
7 Properties |
| 2024 | £313,250 | -30% |
4 Properties |
| 2023 | £406,250 | 11% |
4 Properties |
| 2022 | £363,125 | -13% |
4 Properties |
| 2021 | £412,100 | 43% |
10 Properties |
| 2020 | £236,158 | -65% |
6 Properties |
| 2019 | £390,500 | 23% |
6 Properties |
| 2018 | £301,990 | -6% |
5 Properties |
| 2017 | £321,333 | 14% |
6 Properties |
Property Price per Property Type in Mid Forest
Here you can find historic sold price data in order to help with your property search.
The average Property Paid Price for specific property types in the last three years are:
| Property Type | Average Sold Price | Sold Properties |
|---|---|---|
| Semi Detached House | £284,713.00 | 7 Semi Detached Houses |
| Detached House | £479,224.00 | 9 Detached Houses |
