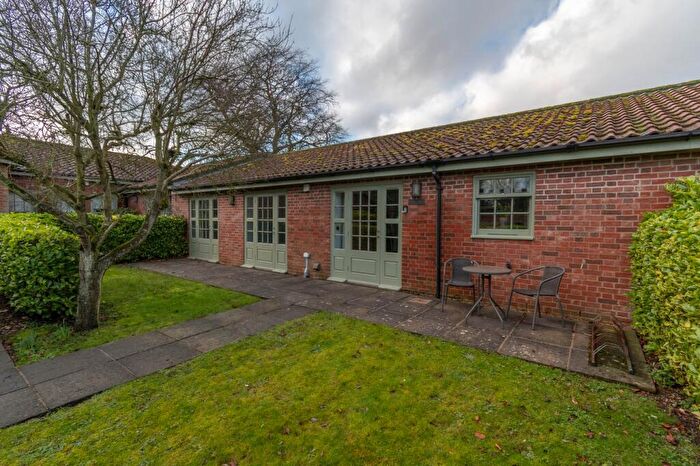
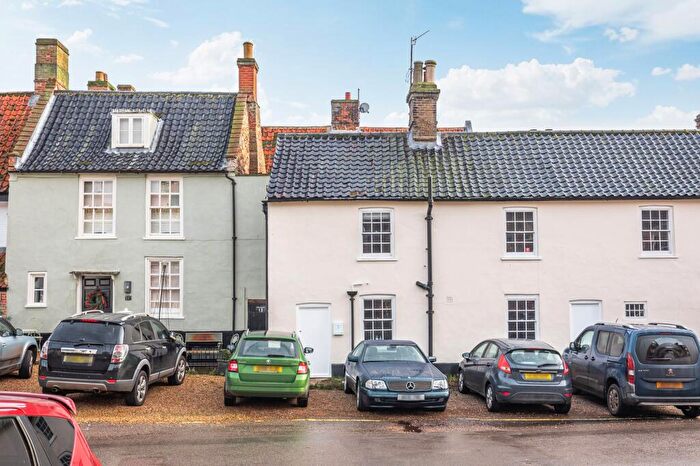
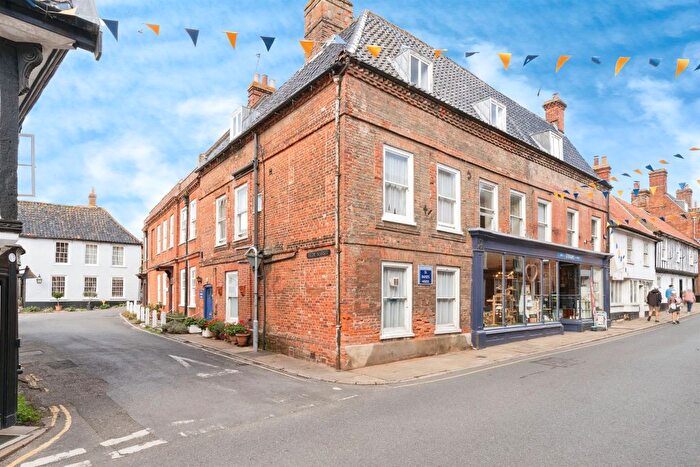
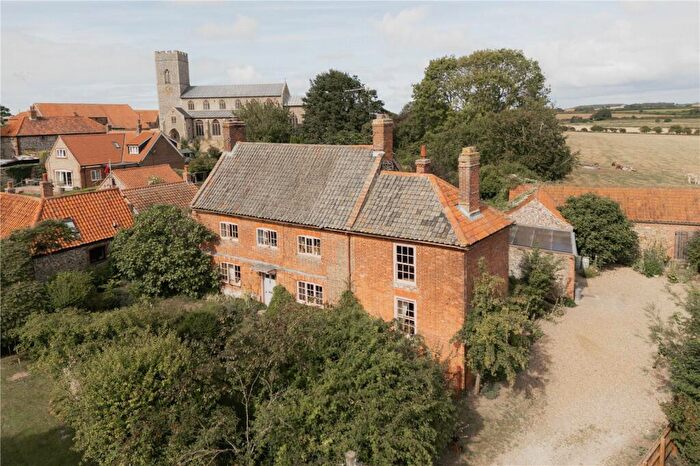
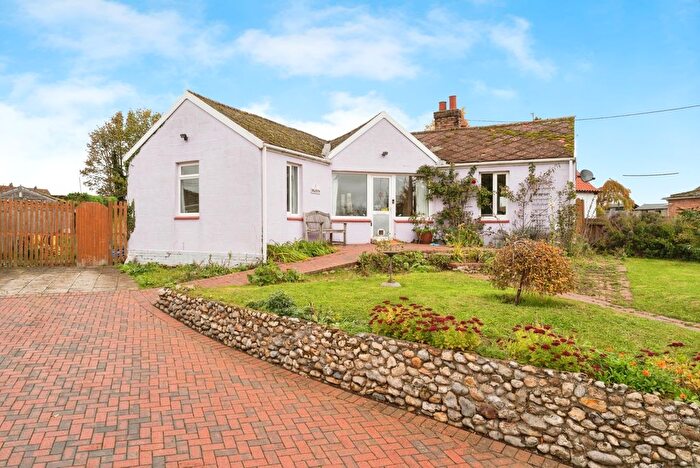
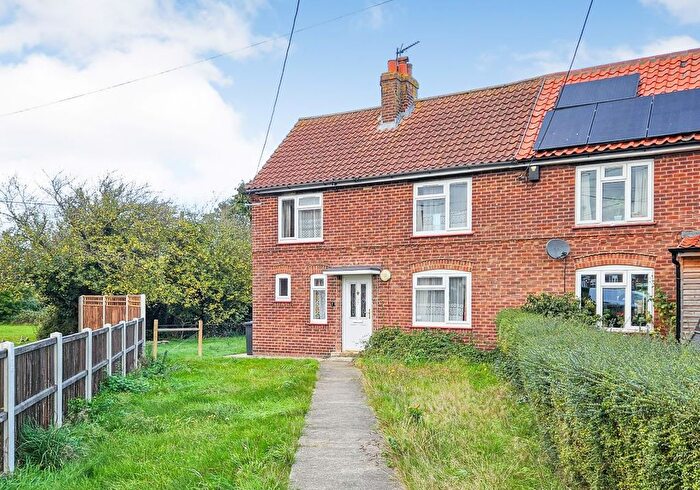
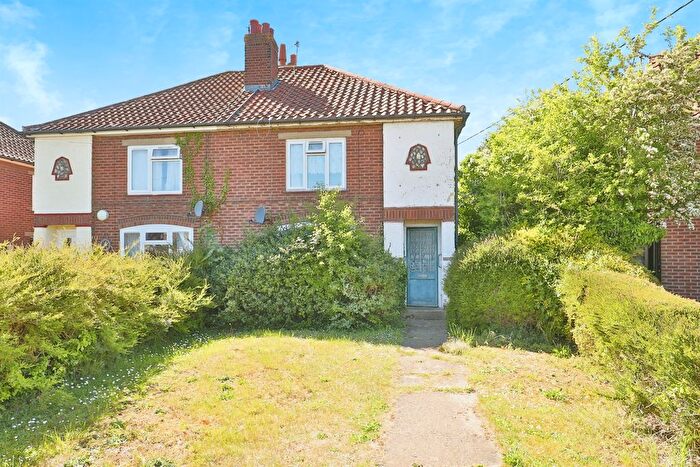
Houses for sale & to rent in Walsingham, Walsingham
House Prices in Walsingham
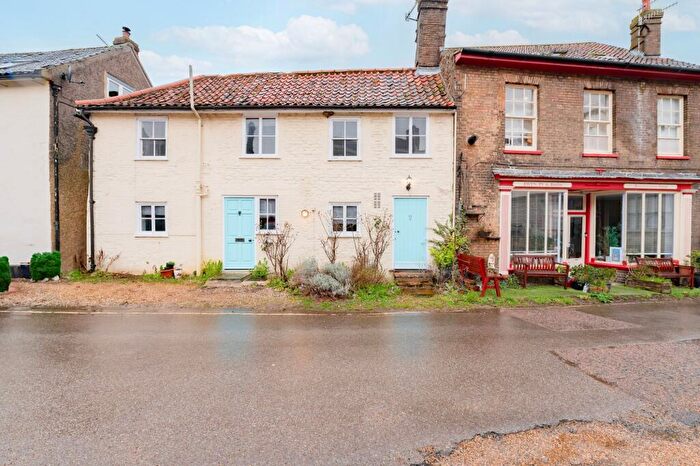
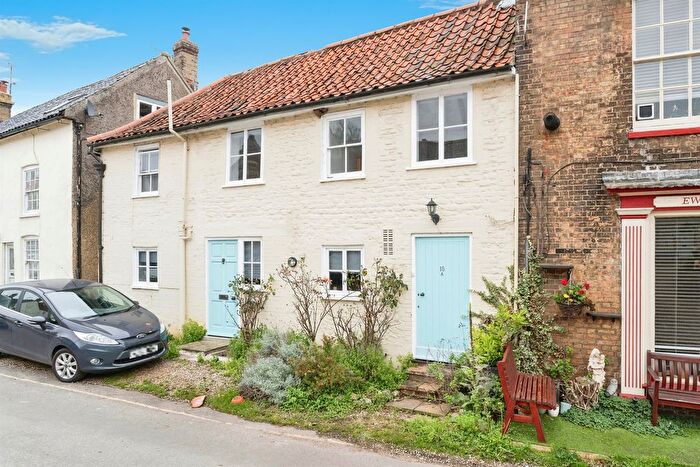
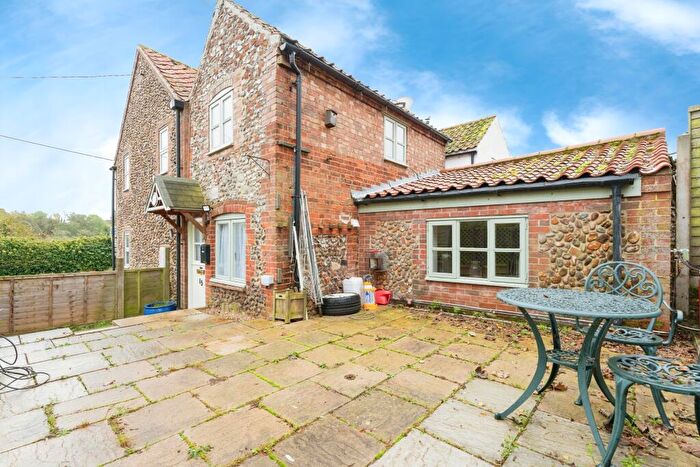
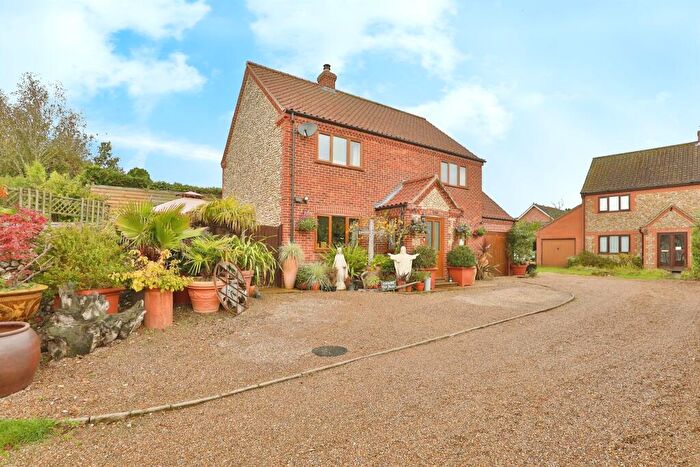
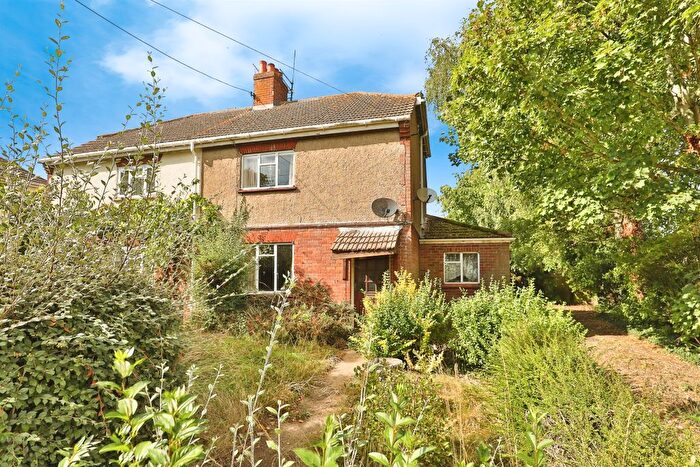
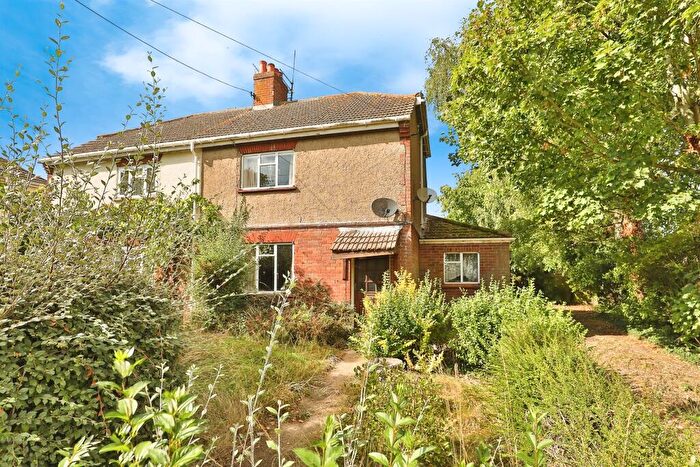
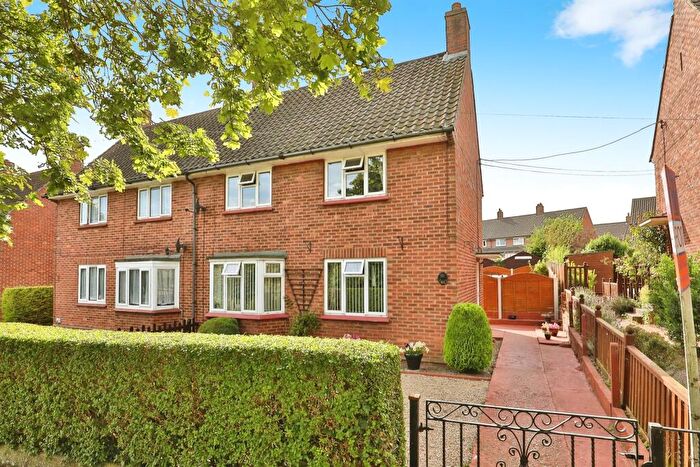
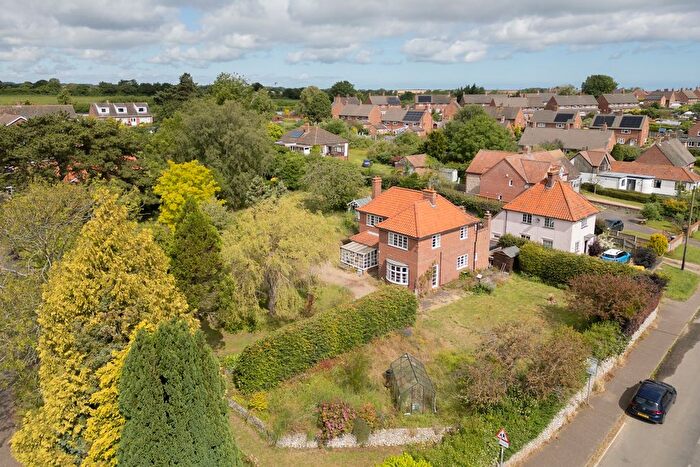
Properties in Walsingham have an average house price of £407,788.00 and had 33 Property Transactions within the last 3 years¹.
Walsingham is an area in Walsingham, Norfolk with 426 households², where the most expensive property was sold for £960,000.00.
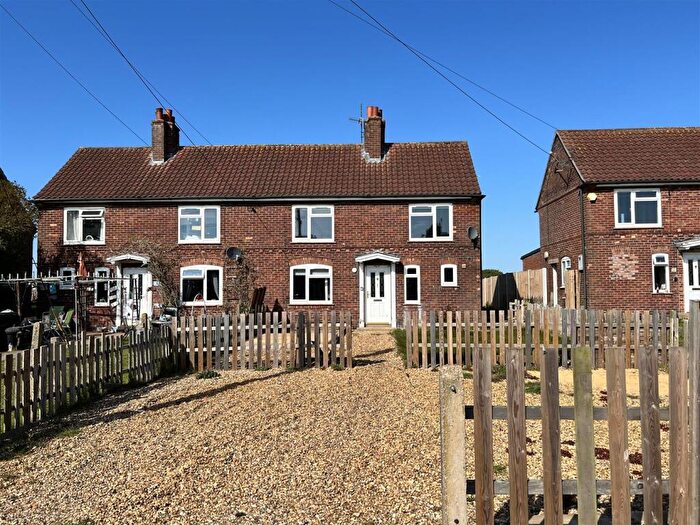
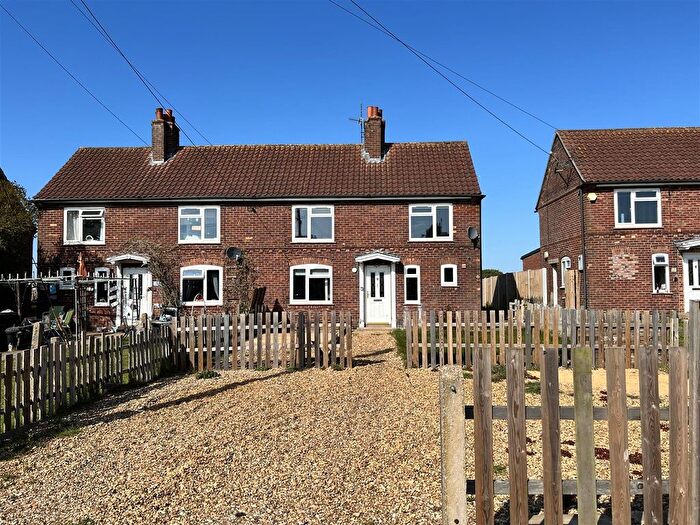
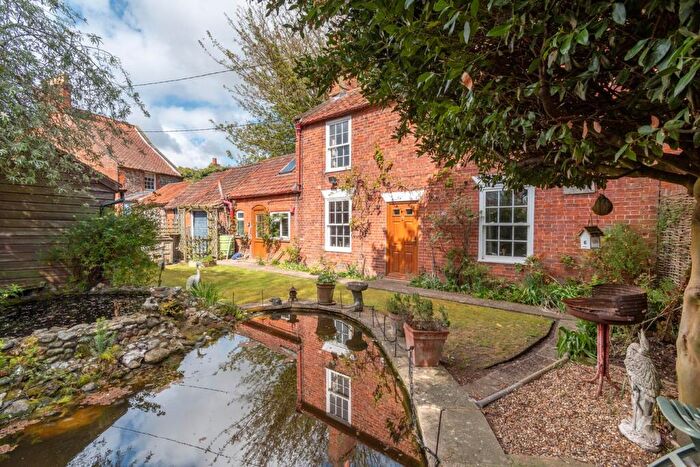
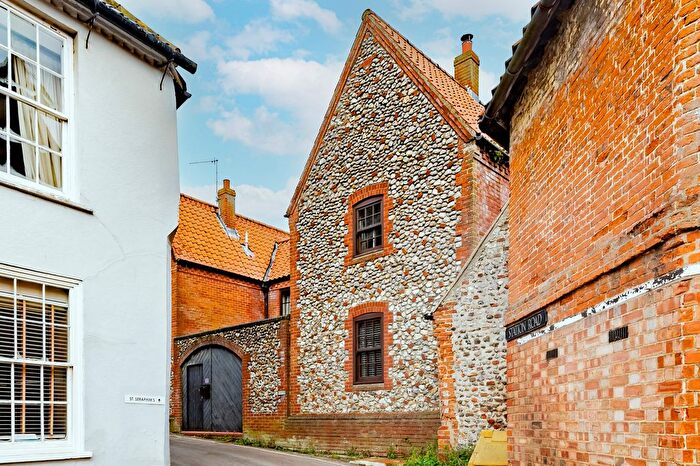
Properties for sale in Walsingham
Previously listed properties in Walsingham
Roads and Postcodes in Walsingham
Navigate through our locations to find the location of your next house in Walsingham, Walsingham for sale or to rent.
| Streets | Postcodes |
|---|---|
| Back Lane | NR22 6BH |
| Bridewell Street | NR22 6BJ NR22 6ED |
| Bunkers Hill | NR22 6AZ NR22 6BD |
| Church Street | NR22 6BL |
| Cleaves Drive | NR22 6EQ |
| Cokers Hill | NR22 6BN |
| Common Place | NR22 6BW NR22 6BP NR22 6EE |
| Crown Yard | NR22 6BQ |
| Edgar Road | NR22 6BA NR22 6BB NR22 6EJ |
| Egmere Road | NR22 6BT NR22 6BS |
| Egmere Wells Cottages | NR22 6AU |
| Fakenham Road | NR22 6AH NR22 6AQ NR22 6AE NR22 6BX |
| Folgate Lane | NR22 6BG |
| Friday Market Place | NR22 6DB NR22 6EG NR22 6EL |
| Green Way | NR22 6AS NR22 6AP NR22 6AR |
| Guild Street | NR22 6BU |
| High Street | NR22 6AA NR22 6BY NR22 6BZ |
| Hindringham Road | NR22 6DR |
| Knight Street | NR22 6DA NR22 6EF |
| Mount Pleasant | NR22 6DD NR22 6DE |
| Old Wells Road | NR22 6EH |
| Scarborough Road | NR22 6AB NR22 6DF NR22 6DS |
| Snoring Road | NR22 6AG NR22 6EA |
| St Peters Road | NR22 6DW |
| Stantons Track | NR22 6AJ |
| Station Road | NR22 6DG NR22 6EB |
| Sunk Road | NR22 6DQ |
| Swan Entry | NR22 6DH |
| The Hill | NR22 6DP |
| Thursford Road | NR22 6DT |
| Walsingham Road | NR22 6AX |
| Wells Road | NR22 6DL NR22 6DN NR22 6DX NR22 6AY NR22 6DJ NR22 6DU |
| Westgate | NR22 6DY NR22 6DZ |
| NR22 6AN NR22 6AD NR22 6AL NR22 6AW |
Transport near Walsingham
- FAQ
- Price Paid By Year
- Property Type Price
Frequently asked questions about Walsingham
What is the average price for a property for sale in Walsingham?
The average price for a property for sale in Walsingham is £407,788. There are 87 property listings for sale in Walsingham.
What streets have the most expensive properties for sale in Walsingham?
The streets with the most expensive properties for sale in Walsingham are Folgate Lane at an average of £779,000, Hindringham Road at an average of £562,500 and Guild Street at an average of £445,000.
What streets have the most affordable properties for sale in Walsingham?
The streets with the most affordable properties for sale in Walsingham are Mount Pleasant at an average of £168,250, Cleaves Drive at an average of £312,506 and Egmere Wells Cottages at an average of £332,500.
Which train stations are available in or near Walsingham?
Some of the train stations available in or near Walsingham are Sheringham, West Runton and Cromer.
Property Price Paid in Walsingham by Year
The average sold property price by year was:
| Year | Average Sold Price | Price Change |
Sold Properties
|
|---|---|---|---|
| 2025 | £325,875 | -37% |
8 Properties |
| 2024 | £446,963 | 6% |
13 Properties |
| 2023 | £419,958 | -15% |
12 Properties |
| 2022 | £481,671 | 18% |
16 Properties |
| 2021 | £397,002 | 17% |
23 Properties |
| 2020 | £327,786 | 1% |
19 Properties |
| 2019 | £323,633 | 15% |
15 Properties |
| 2018 | £273,500 | -4% |
13 Properties |
| 2017 | £284,010 | -3% |
19 Properties |
| 2016 | £292,444 | 15% |
9 Properties |
| 2015 | £247,716 | 3% |
26 Properties |
| 2014 | £239,545 | -1% |
17 Properties |
| 2013 | £241,607 | 9% |
14 Properties |
| 2012 | £218,787 | -24% |
12 Properties |
| 2011 | £271,150 | -10% |
20 Properties |
| 2010 | £298,696 | 17% |
15 Properties |
| 2009 | £249,272 | -12% |
11 Properties |
| 2008 | £278,722 | 17% |
18 Properties |
| 2007 | £232,716 | -4% |
18 Properties |
| 2006 | £242,342 | 5% |
27 Properties |
| 2005 | £230,609 | 7% |
15 Properties |
| 2004 | £215,405 | 14% |
14 Properties |
| 2003 | £184,291 | -3% |
17 Properties |
| 2002 | £189,460 | 18% |
25 Properties |
| 2001 | £154,541 | 28% |
17 Properties |
| 2000 | £111,650 | 31% |
16 Properties |
| 1999 | £77,548 | -26% |
14 Properties |
| 1998 | £97,467 | 21% |
23 Properties |
| 1997 | £77,458 | 9% |
12 Properties |
| 1996 | £70,177 | -23% |
11 Properties |
| 1995 | £86,633 | - |
10 Properties |
Property Price per Property Type in Walsingham
Here you can find historic sold price data in order to help with your property search.
The average Property Paid Price for specific property types in the last three years are:
| Property Type | Average Sold Price | Sold Properties |
|---|---|---|
| Semi Detached House | £376,642.00 | 14 Semi Detached Houses |
| Detached House | £467,543.00 | 12 Detached Houses |
| Terraced House | £367,642.00 | 7 Terraced Houses |

