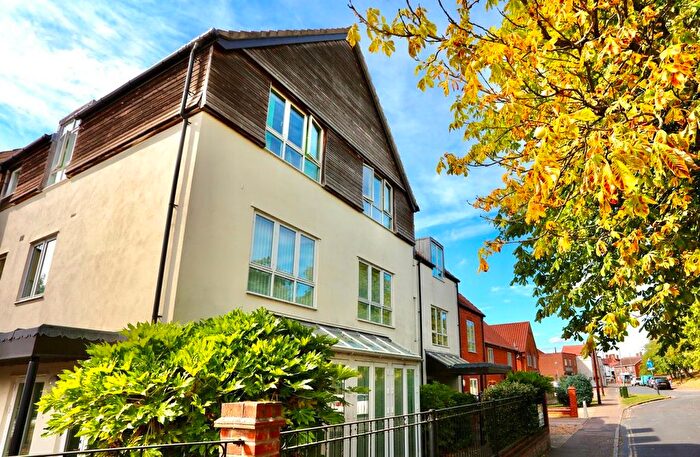
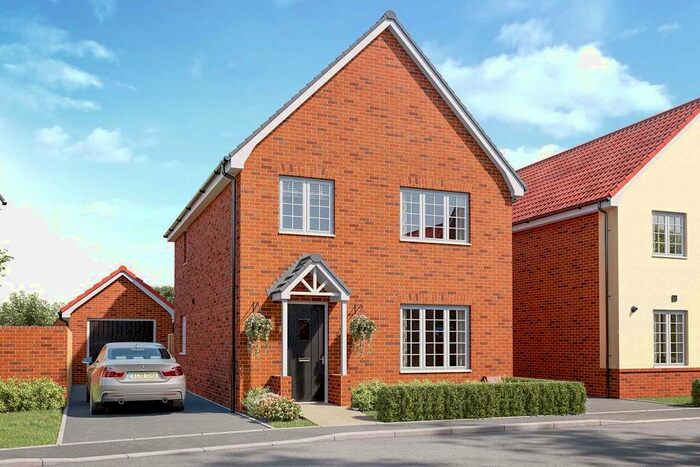
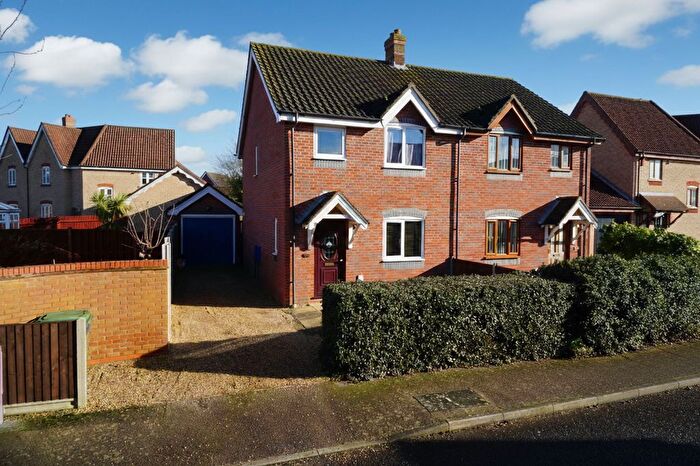
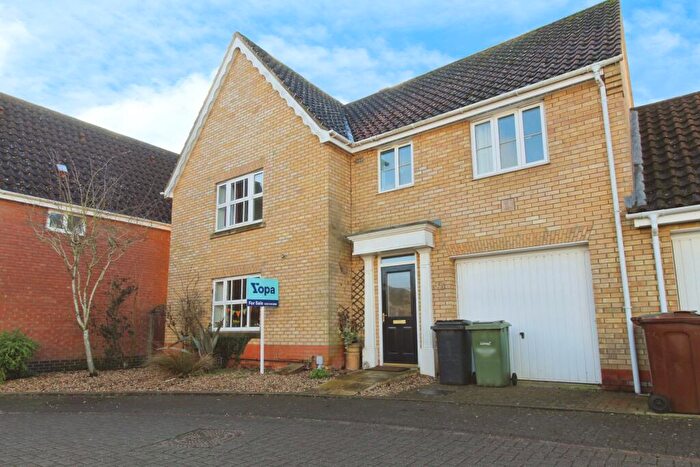
Houses for sale & to rent in Cromwells, Wymondham
House Prices in Cromwells
Properties in Cromwells have an average house price of £321,324.00 and had 100 Property Transactions within the last 3 years¹.
Cromwells is an area in Wymondham, Norfolk with 1,002 households², where the most expensive property was sold for £1,000,000.00.
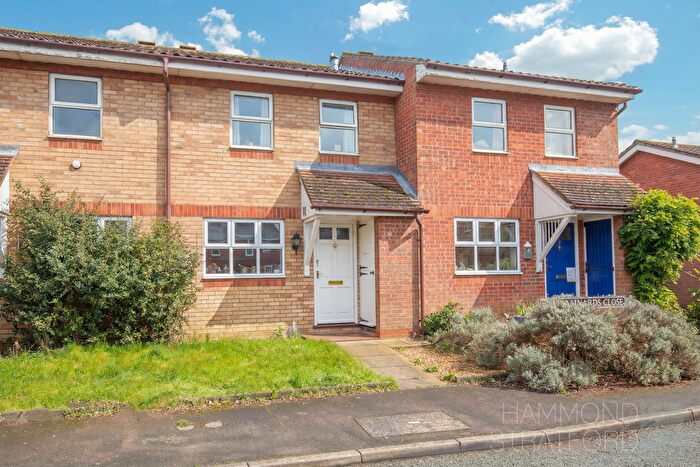
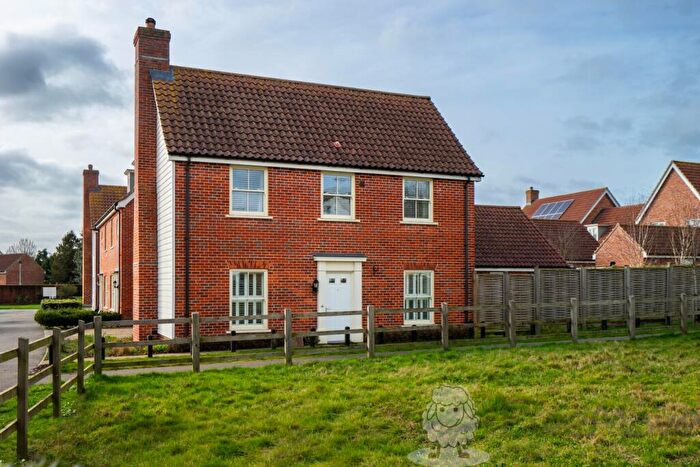
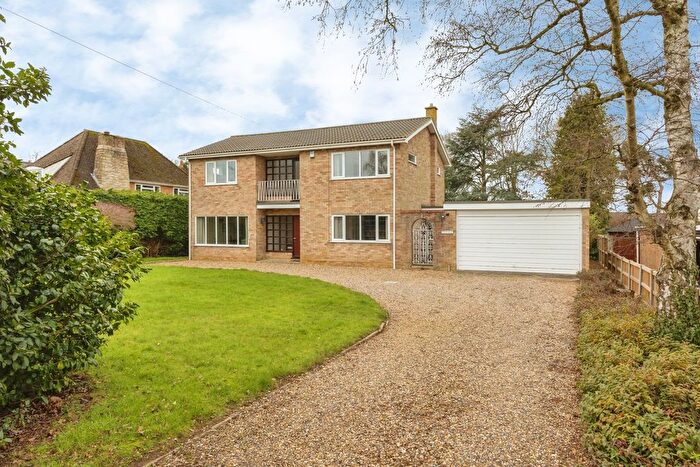
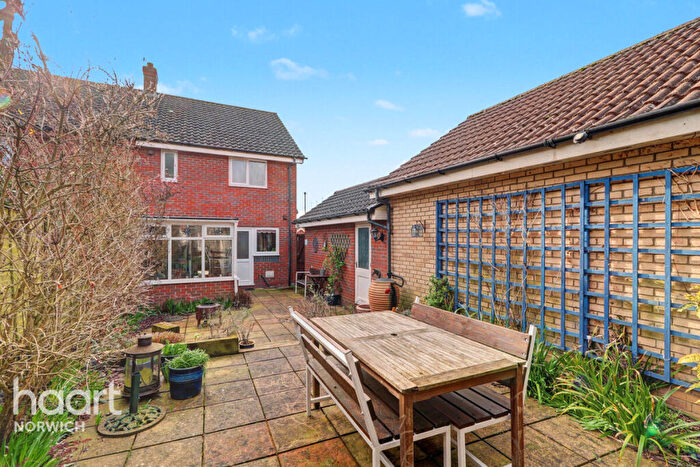
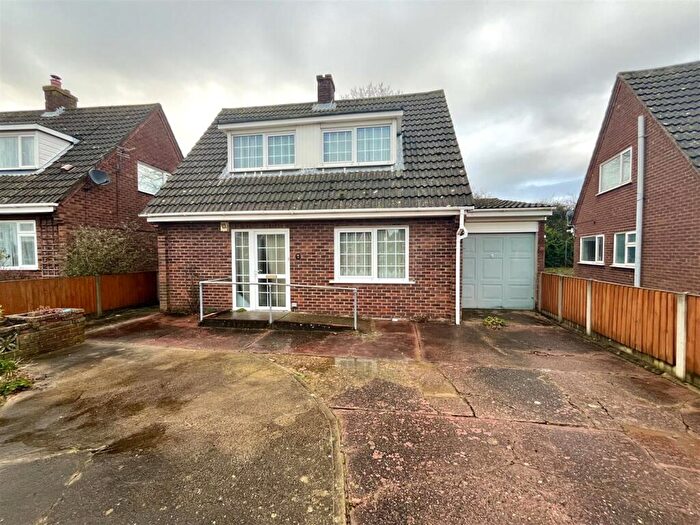
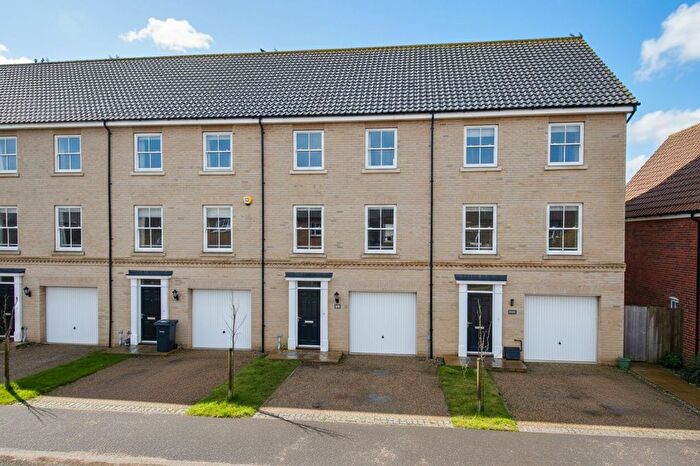
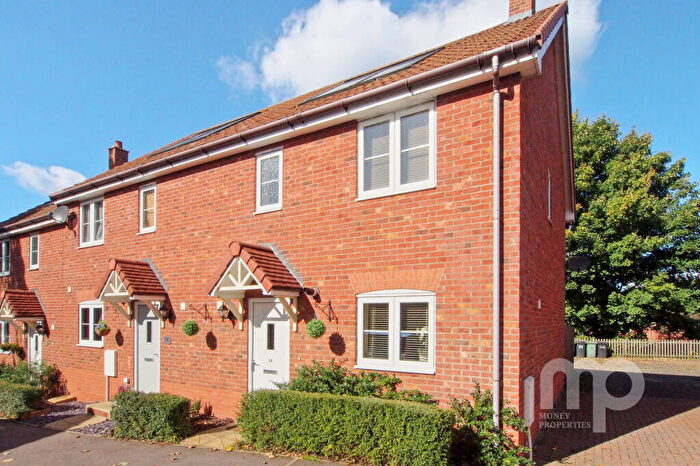
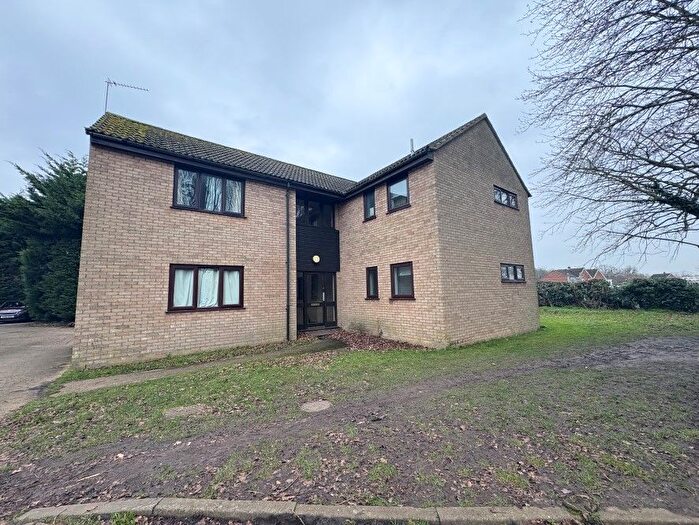
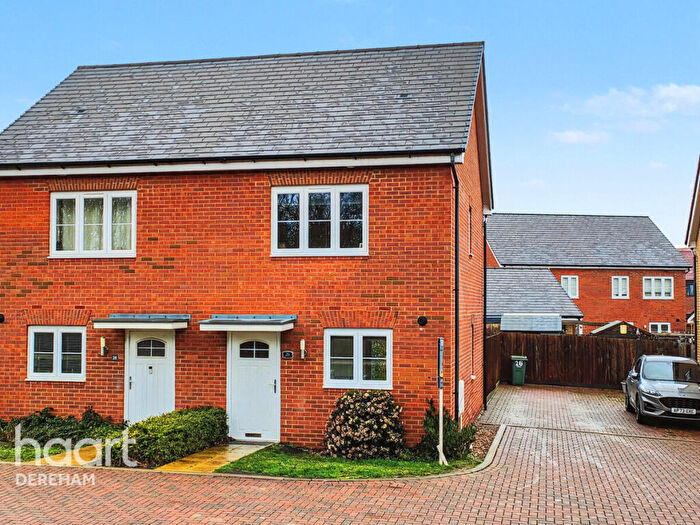
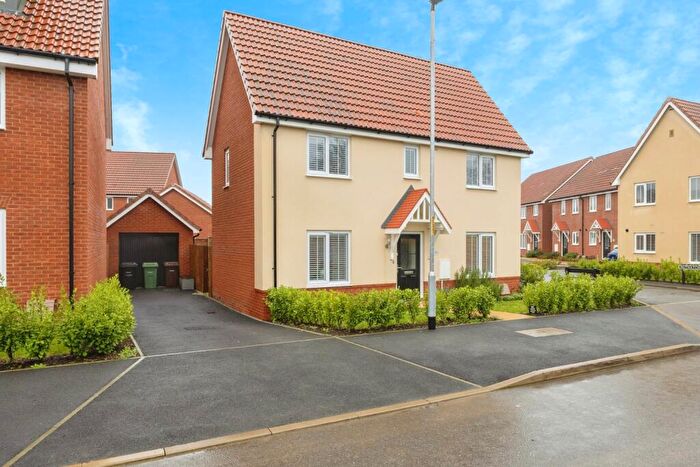
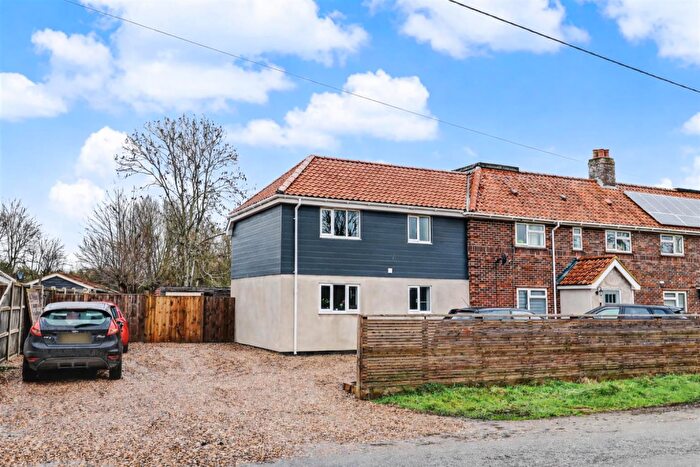
Properties for sale in Cromwells
Roads and Postcodes in Cromwells
Navigate through our locations to find the location of your next house in Cromwells, Wymondham for sale or to rent.
| Streets | Postcodes |
|---|---|
| Abbey Road | NR18 9BB NR18 9BY |
| Allenbrooks Way | NR18 0NW |
| Bradmans Lane | NR18 9BS |
| Broom Road | NR18 9LB |
| Browick Road | NR18 0QN NR18 9RB |
| Bunwell Road | NR18 9LH NR18 9LQ |
| Burnthouse Lane | NR18 9NP |
| Cantley Villas | NR18 9JR |
| Cavick Road | NR18 9PJ |
| Cemetery Lane | NR18 0BN |
| Chapel Loke | NR18 9LS |
| Chapel Road | NR18 9LN |
| Chestnut Drive | NR18 9SB |
| Church Farm Cottages | NR18 9JY |
| Compass Road | NR18 9NN |
| Elan Close | NR18 9LW |
| Eleven Mile Lane | NR18 9JL |
| Elise Way | NR18 9LX |
| Esprit Close | NR18 9LY |
| Evora Road | NR18 9NE |
| Exige Way | NR18 9ND |
| Granary Loke | NR18 9JW |
| Green Lane | NR18 9AD |
| Guilers Lane | NR18 9JX |
| Harry Daniels Close | NR18 9HZ |
| High Banks | NR18 0UZ |
| Hill Road | NR18 9LG |
| London Road | NR18 9AN NR18 9BP NR18 9JD NR18 9SJ NR18 9SL NR18 9SN |
| Long Road | NR18 9NT |
| Morley Lane | NR18 9BT |
| Park Close | NR18 9BA |
| Park Lane | NR18 9BE NR18 9BG NR18 9NG |
| Preston Avenue | NR18 9JE |
| Queen Street | NR18 9JU |
| Rightup Lane | NR18 9NB |
| Sawyers Lane | NR18 9JH NR18 9SH |
| School Lane | NR18 9JP |
| Silfield Avenue | NR18 9BD |
| Silfield Road | NR18 9AU NR18 9AX NR18 9AY NR18 9AZ NR18 9NH NR18 9NJ NR18 9NU |
| Silfield Street | NR18 9NL NR18 9NS |
| Slovenwood Lane | NR18 9NX |
| St Thomas Drive | NR18 9AR |
| Stanfield Road | NR18 9QF |
| Station Approach | NR18 0JZ |
| Station Road | NR18 0JX NR18 9AH |
| Strayground Lane | NR18 9NA |
| Suton Street | NR18 9JJ |
| The Lizard | NR18 9BH |
| Top Common | NR18 9JS |
| White Villas | NR18 9AT |
| NR18 9PA NR18 9RL |
Transport near Cromwells
- FAQ
- Price Paid By Year
- Property Type Price
Frequently asked questions about Cromwells
What is the average price for a property for sale in Cromwells?
The average price for a property for sale in Cromwells is £321,324. This amount is 2% higher than the average price in Wymondham. There are 1,709 property listings for sale in Cromwells.
What streets have the most expensive properties for sale in Cromwells?
The streets with the most expensive properties for sale in Cromwells are Long Road at an average of £1,000,000, Suton Street at an average of £710,000 and Bunwell Road at an average of £602,500.
What streets have the most affordable properties for sale in Cromwells?
The streets with the most affordable properties for sale in Cromwells are Chapel Road at an average of £172,000, Silfield Avenue at an average of £180,000 and Esprit Close at an average of £209,166.
Which train stations are available in or near Cromwells?
Some of the train stations available in or near Cromwells are Wymondham, Spooner Row and Attleborough.
Property Price Paid in Cromwells by Year
The average sold property price by year was:
| Year | Average Sold Price | Price Change |
Sold Properties
|
|---|---|---|---|
| 2025 | £317,603 | -5% |
29 Properties |
| 2024 | £332,529 | 7% |
42 Properties |
| 2023 | £308,818 | -13% |
29 Properties |
| 2022 | £349,338 | 3% |
53 Properties |
| 2021 | £340,076 | 9% |
58 Properties |
| 2020 | £310,375 | 7% |
40 Properties |
| 2019 | £287,487 | 1% |
44 Properties |
| 2018 | £285,336 | -1% |
46 Properties |
| 2017 | £289,032 | 9% |
39 Properties |
| 2016 | £263,627 | 17% |
56 Properties |
| 2015 | £218,152 | -5% |
50 Properties |
| 2014 | £230,149 | -8% |
46 Properties |
| 2013 | £248,404 | 24% |
64 Properties |
| 2012 | £187,688 | -14% |
39 Properties |
| 2011 | £214,891 | 4% |
66 Properties |
| 2010 | £205,295 | 4% |
32 Properties |
| 2009 | £196,381 | -33% |
30 Properties |
| 2008 | £262,133 | 11% |
15 Properties |
| 2007 | £233,236 | 19% |
59 Properties |
| 2006 | £189,419 | -5% |
83 Properties |
| 2005 | £198,055 | 26% |
39 Properties |
| 2004 | £147,353 | -20% |
30 Properties |
| 2003 | £176,192 | 28% |
47 Properties |
| 2002 | £126,690 | 14% |
45 Properties |
| 2001 | £109,018 | 19% |
58 Properties |
| 2000 | £87,950 | 9% |
31 Properties |
| 1999 | £79,953 | 14% |
40 Properties |
| 1998 | £68,847 | 7% |
94 Properties |
| 1997 | £64,185 | -10% |
38 Properties |
| 1996 | £70,681 | 23% |
33 Properties |
| 1995 | £54,693 | - |
15 Properties |
Property Price per Property Type in Cromwells
Here you can find historic sold price data in order to help with your property search.
The average Property Paid Price for specific property types in the last three years are:
| Property Type | Average Sold Price | Sold Properties |
|---|---|---|
| Semi Detached House | £279,123.00 | 34 Semi Detached Houses |
| Detached House | £422,033.00 | 39 Detached Houses |
| Terraced House | £234,000.00 | 25 Terraced Houses |
| Flat | £166,500.00 | 2 Flats |

