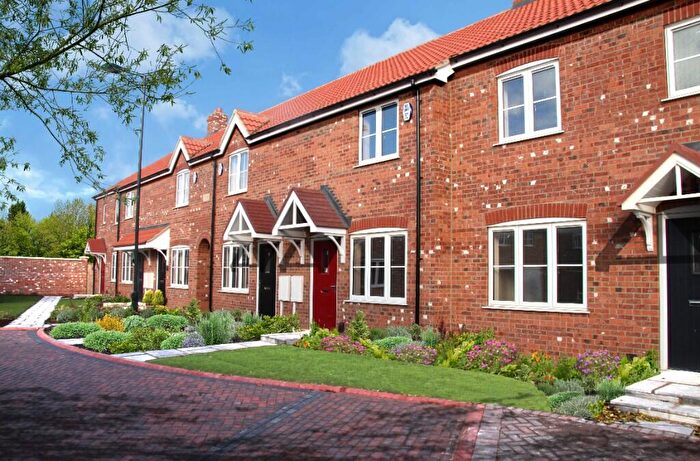
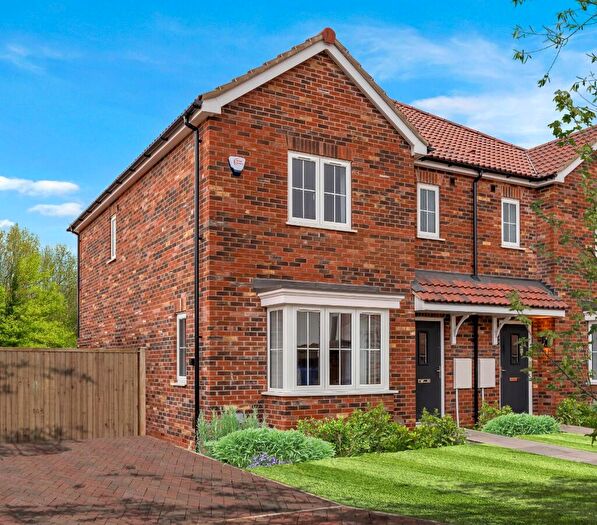
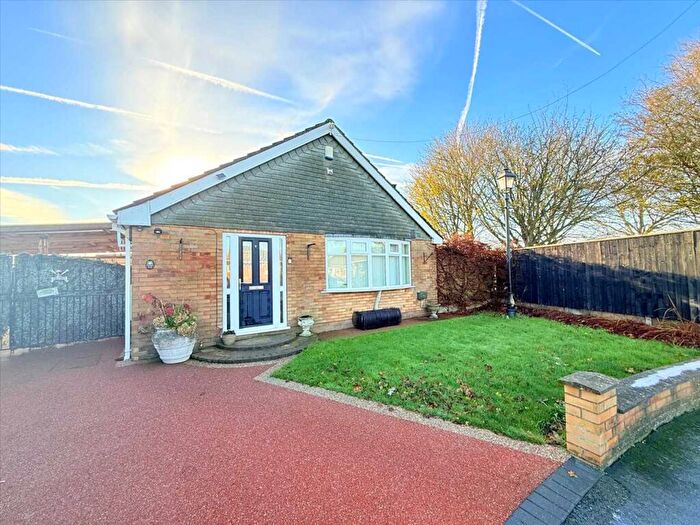
Houses for sale & to rent in Immingham, Grimsby
House Prices in Immingham
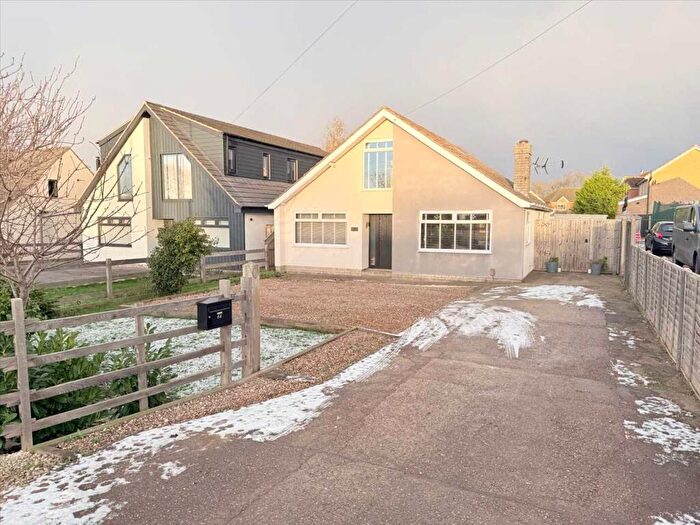
Properties in Immingham have an average house price of £228,567.00 and had 81 Property Transactions within the last 3 years¹.
Immingham is an area in Grimsby, North East Lincolnshire with 537 households², where the most expensive property was sold for £550,000.00.
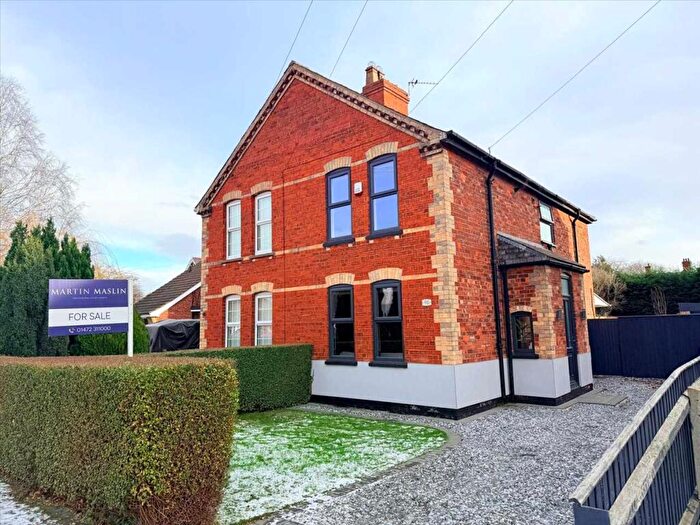
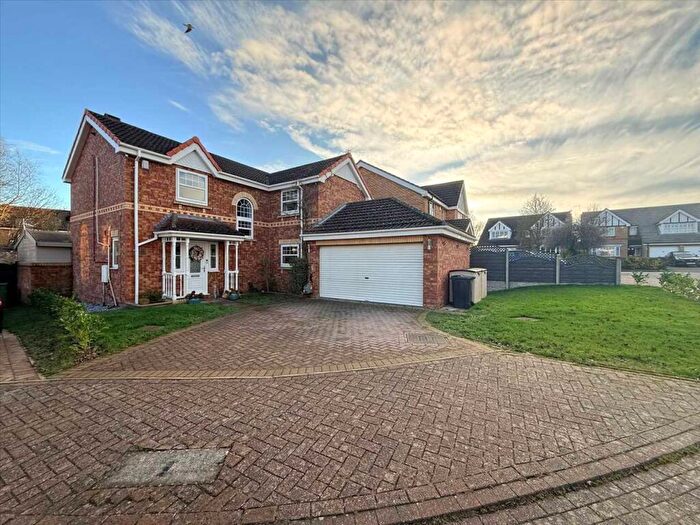
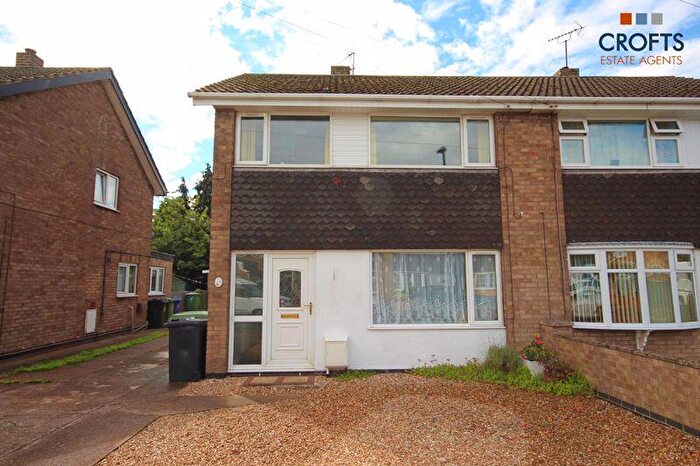
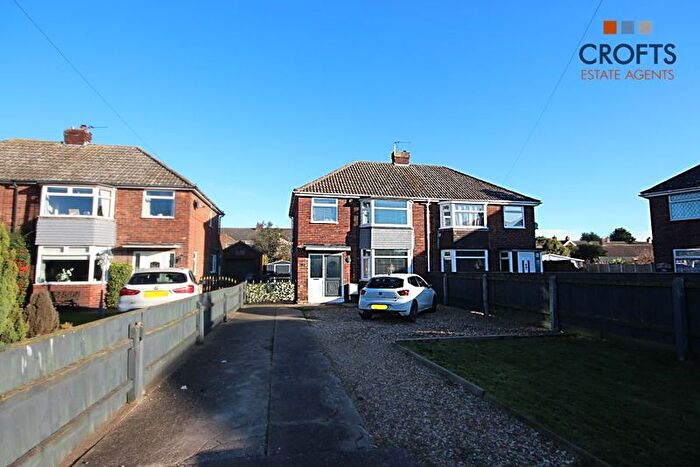
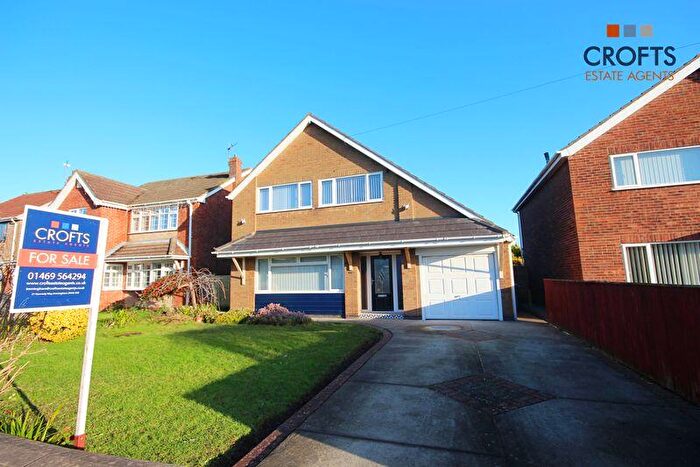
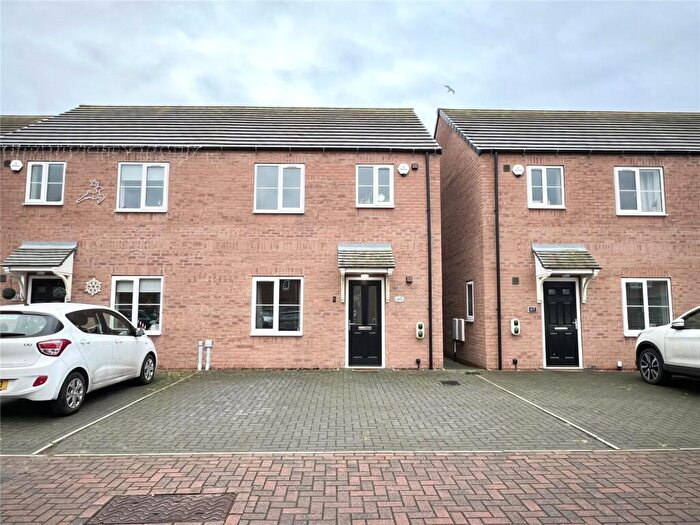
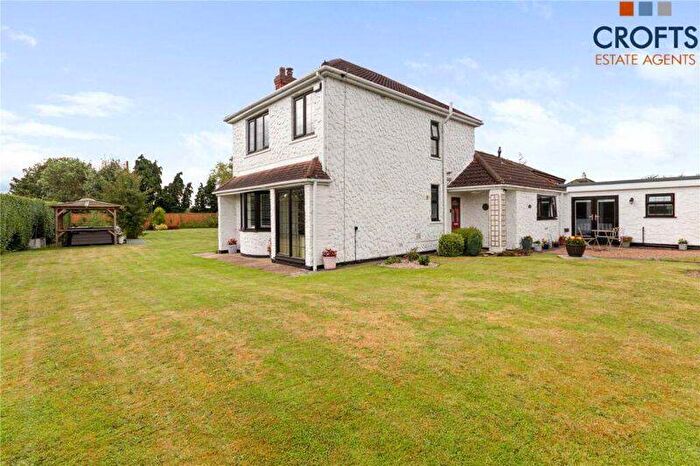
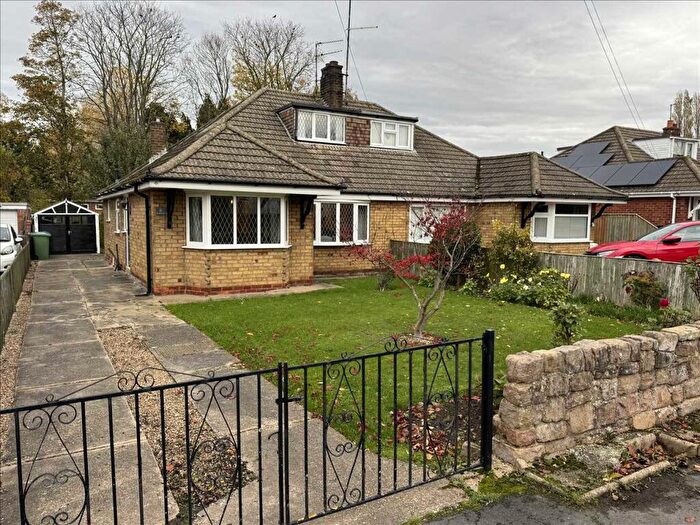
Properties for sale in Immingham
Roads and Postcodes in Immingham
Navigate through our locations to find the location of your next house in Immingham, Grimsby for sale or to rent.
| Streets | Postcodes |
|---|---|
| Almond Grove | DN41 8FE |
| Anthony Way | DN41 8BD |
| Ayscough Avenue | DN41 8AS DN41 8AT |
| Beels Road | DN41 8DN |
| Blacksmiths Court | DN41 8BF |
| Buttercross Close | DN41 8TB |
| Carr Lane | DN41 8BA |
| Church Lane | DN41 8AA |
| Clarkson Drive | DN41 8BQ |
| Ephams Lane | DN41 8BX |
| Europa Way | DN41 8DS |
| Green Lane | DN36 4ZJ |
| Healing Road | DN41 8AD DN41 8AZ DN41 8BJ |
| Hobson Way | DN41 8DZ |
| Holly Close | DN41 8TG |
| Hunsley Drive | DN41 8BG |
| Immingham Road | DN41 8BP DN41 8BS |
| Keelby Road | DN41 8BN DN41 8BW |
| Kiln Lane | DN41 8DL DN41 8DQ |
| Kiln Lane Trading Estate | DN41 8DY |
| Laporte Road | DN41 8DR DN41 8DX |
| Leggott Way | DN41 8BB |
| Manor Court | DN41 8TQ |
| Mayfields Court | DN41 8FL |
| Mount Farm Mews | DN41 8DJ |
| Netherlands Way | DN41 8DF |
| North Moss Lane | DN41 8DD |
| North Moss Lane Industrial Estate | DN41 8DW |
| Osborne Road | DN41 8DG |
| Pinfold Lane | DN41 8AB |
| Poachers Rise | DN41 8AE |
| Redwood Park Estate | DN41 8TH |
| Riby Road | DN41 8BT DN41 8BU |
| Saxonfields Drive | DN41 8FN |
| Scandinavian Way | DN41 8DT DN41 8DU |
| South Marsh Road | DN41 8AN DN41 8BY DN41 8BZ DN41 8BE DN41 8DB |
| Stallingborough Road | DN41 8JD |
| Station Road | DN41 8AF DN41 8AH DN41 8AJ DN41 8AL DN41 8AP DN41 8AR DN41 8AW DN41 8AX DN41 8AY DN41 8AQ |
| The Close | DN41 8AU |
| The Limes | DN41 8AG |
| The Woodlands | DN41 8BH |
| Trondheim Way | DN41 8FD |
| Walkers Orchard | DN41 8GA |
| Woodapple Court | DN41 8TA |
| DN41 8BL DN41 8DP |
Transport near Immingham
- FAQ
- Price Paid By Year
- Property Type Price
Frequently asked questions about Immingham
What is the average price for a property for sale in Immingham?
The average price for a property for sale in Immingham is £228,567. This amount is 48% higher than the average price in Grimsby. There are 952 property listings for sale in Immingham.
What streets have the most expensive properties for sale in Immingham?
The streets with the most expensive properties for sale in Immingham are Healing Road at an average of £363,333, Stallingborough Road at an average of £300,000 and Holly Close at an average of £277,071.
What streets have the most affordable properties for sale in Immingham?
The streets with the most affordable properties for sale in Immingham are Leggott Way at an average of £102,642, Ayscough Avenue at an average of £167,000 and Pinfold Lane at an average of £170,000.
Which train stations are available in or near Immingham?
Some of the train stations available in or near Immingham are Stallingborough, Healing and Great Coates.
Property Price Paid in Immingham by Year
The average sold property price by year was:
| Year | Average Sold Price | Price Change |
Sold Properties
|
|---|---|---|---|
| 2025 | £225,437 | 13% |
16 Properties |
| 2024 | £195,910 | -58% |
28 Properties |
| 2023 | £310,033 | 30% |
15 Properties |
| 2022 | £216,861 | 18% |
22 Properties |
| 2021 | £176,860 | -14% |
51 Properties |
| 2020 | £201,136 | 15% |
18 Properties |
| 2019 | £170,663 | -7% |
15 Properties |
| 2018 | £181,897 | 4% |
20 Properties |
| 2017 | £175,184 | 9% |
33 Properties |
| 2016 | £159,992 | 14% |
28 Properties |
| 2015 | £138,157 | -16% |
14 Properties |
| 2014 | £159,915 | 14% |
26 Properties |
| 2013 | £137,936 | -15% |
19 Properties |
| 2012 | £158,902 | 2% |
17 Properties |
| 2011 | £156,208 | -2% |
34 Properties |
| 2010 | £160,112 | 7% |
33 Properties |
| 2009 | £148,747 | 5% |
29 Properties |
| 2008 | £141,771 | -9% |
9 Properties |
| 2007 | £154,353 | 17% |
18 Properties |
| 2006 | £128,720 | 9% |
22 Properties |
| 2005 | £116,997 | -17% |
21 Properties |
| 2004 | £136,653 | 27% |
13 Properties |
| 2003 | £99,355 | 5% |
26 Properties |
| 2002 | £94,817 | 25% |
34 Properties |
| 2001 | £70,670 | 10% |
34 Properties |
| 2000 | £63,565 | 5% |
19 Properties |
| 1999 | £60,614 | -17% |
17 Properties |
| 1998 | £70,743 | 14% |
23 Properties |
| 1997 | £60,840 | 12% |
27 Properties |
| 1996 | £53,766 | -6% |
25 Properties |
| 1995 | £57,254 | - |
32 Properties |
Property Price per Property Type in Immingham
Here you can find historic sold price data in order to help with your property search.
The average Property Paid Price for specific property types in the last three years are:
| Property Type | Average Sold Price | Sold Properties |
|---|---|---|
| Detached House | £266,854.00 | 52 Detached Houses |
| Terraced House | £170,884.00 | 13 Terraced Houses |
| Semi Detached House | £182,500.00 | 11 Semi Detached Houses |
| Flat | £81,700.00 | 5 Flats |

