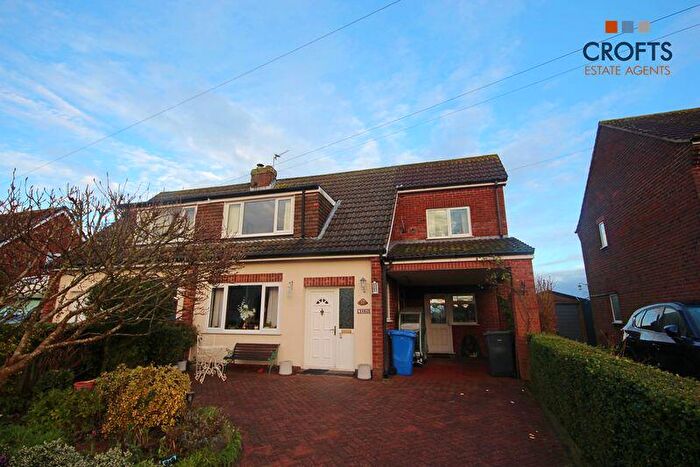
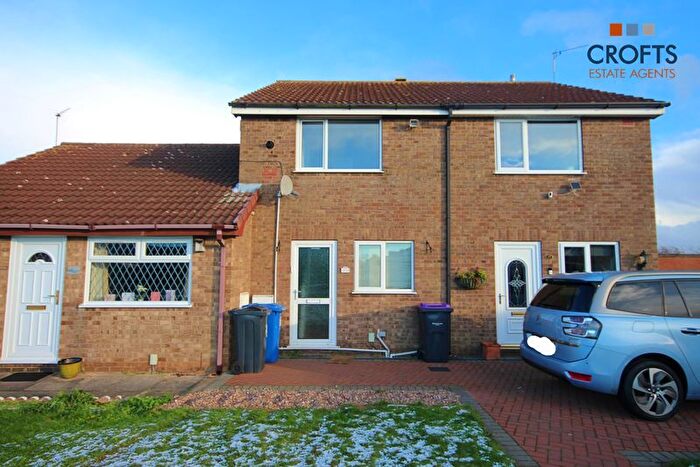
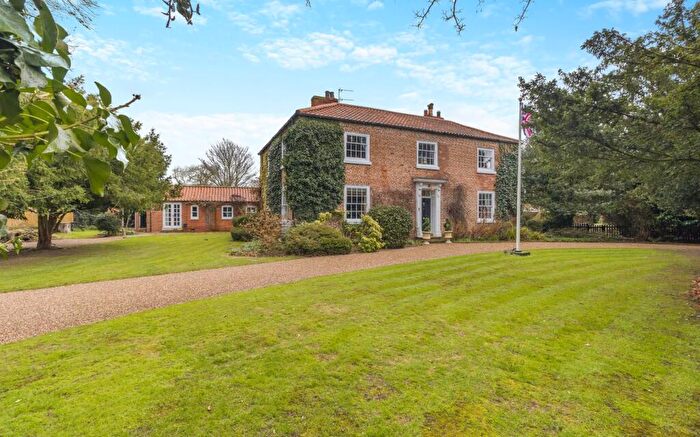
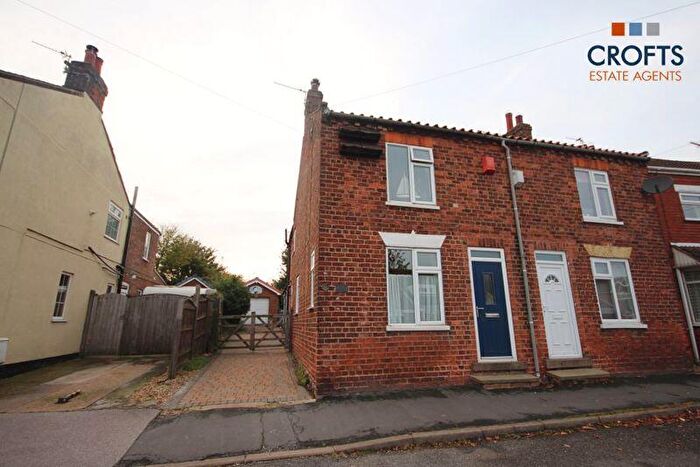
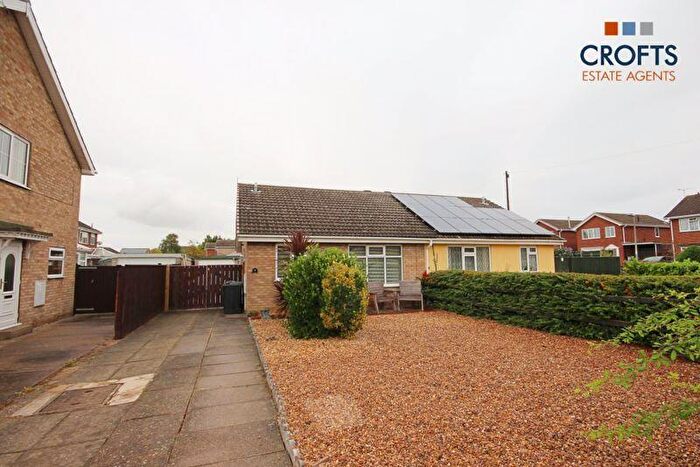
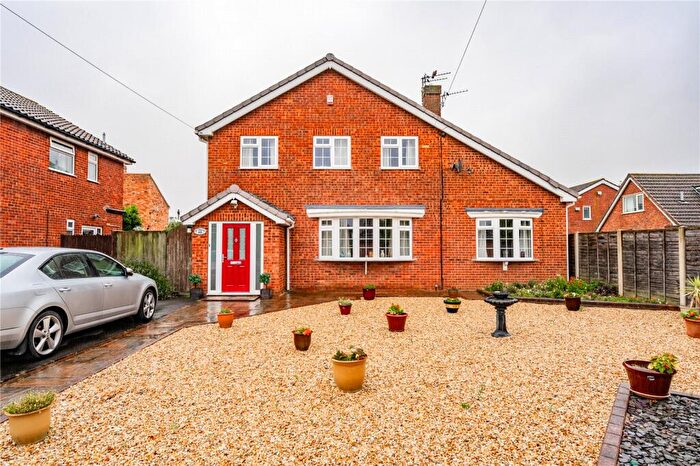
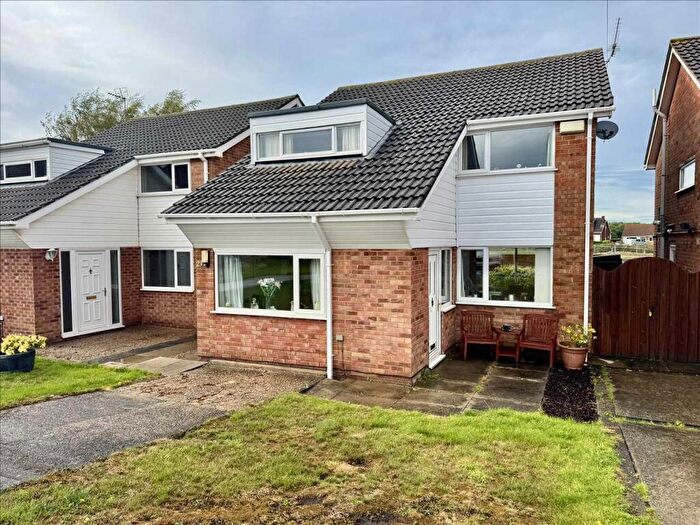
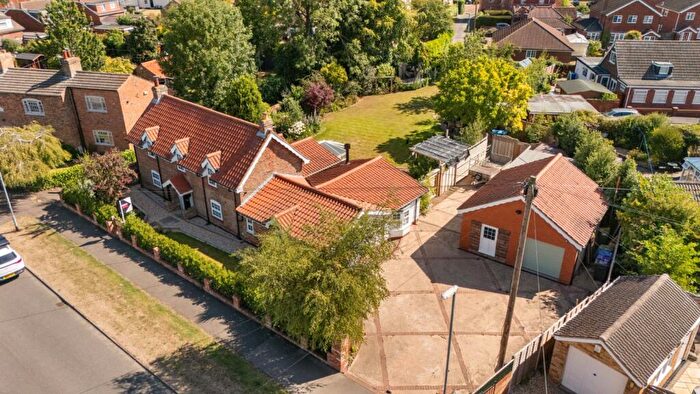
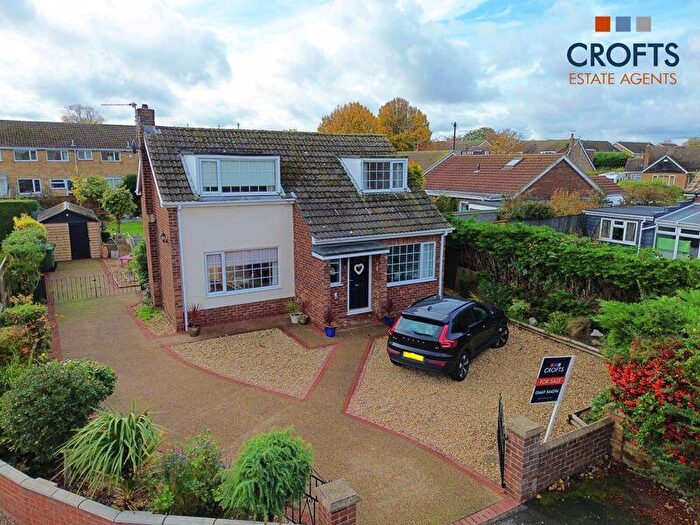
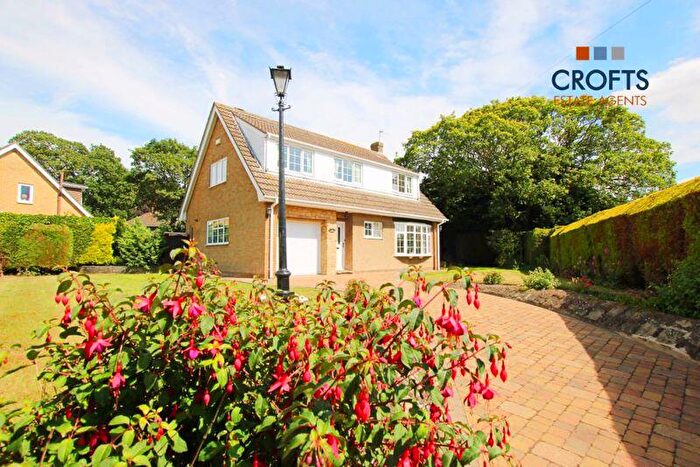
Houses for sale & to rent in Yarborough, Grimsby
House Prices in Yarborough
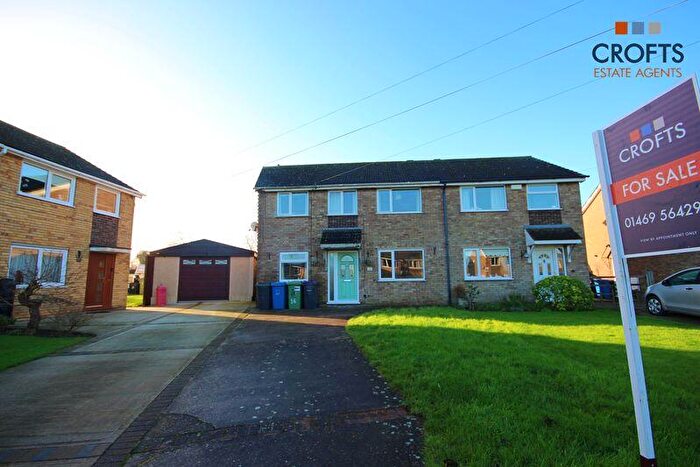
Properties in Yarborough have an average house price of £196,563.00 and had 76 Property Transactions within the last 3 years¹.
Yarborough is an area in Grimsby, Lincolnshire with 894 households², where the most expensive property was sold for £437,000.00.
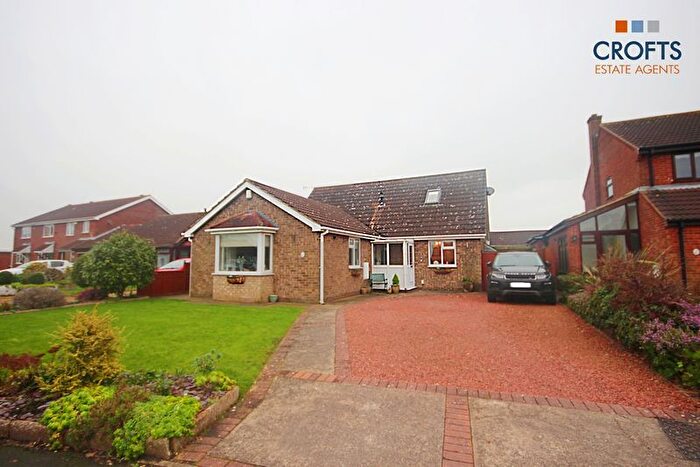
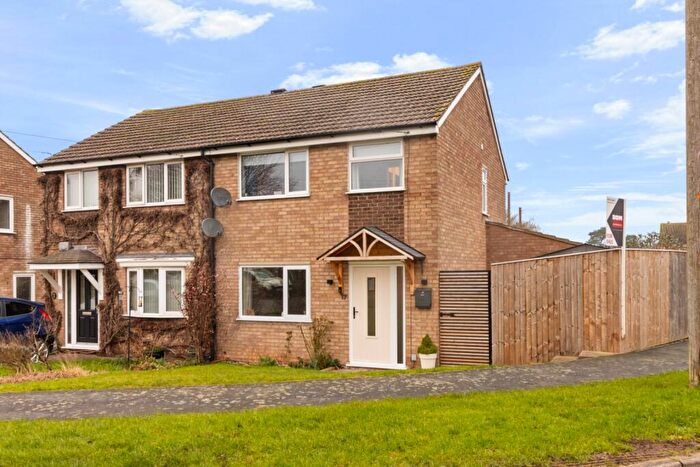
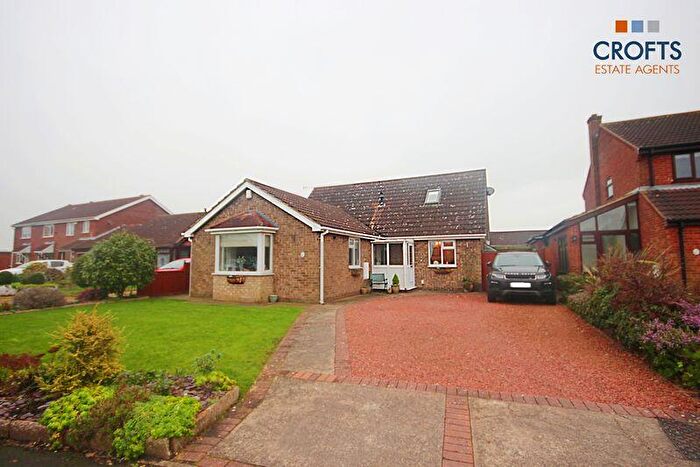
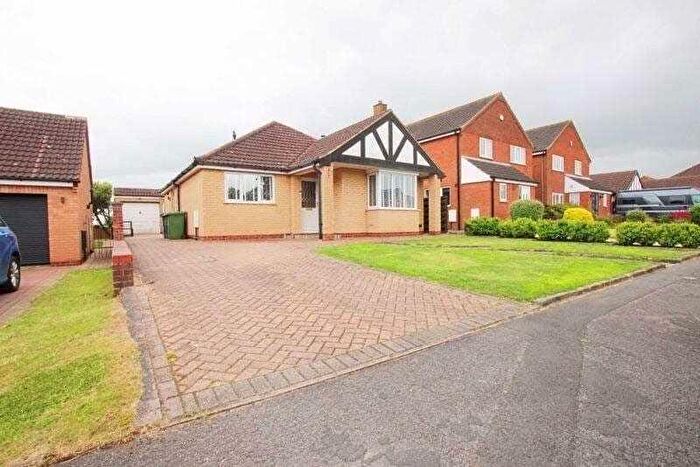
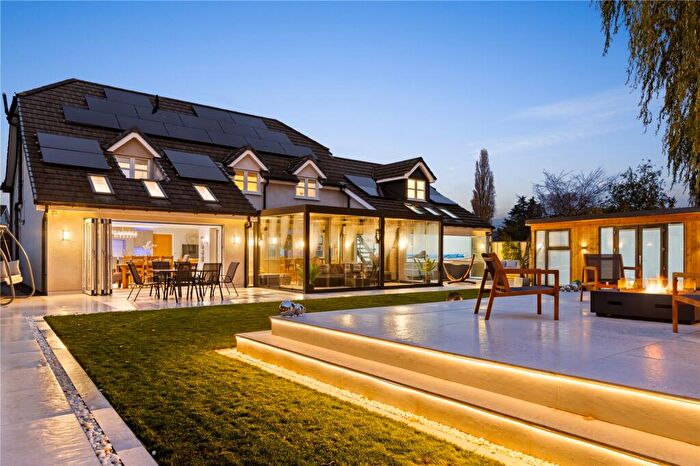
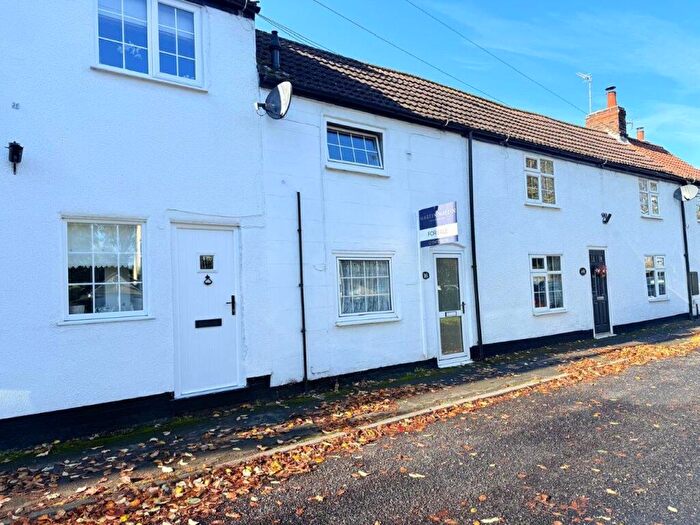
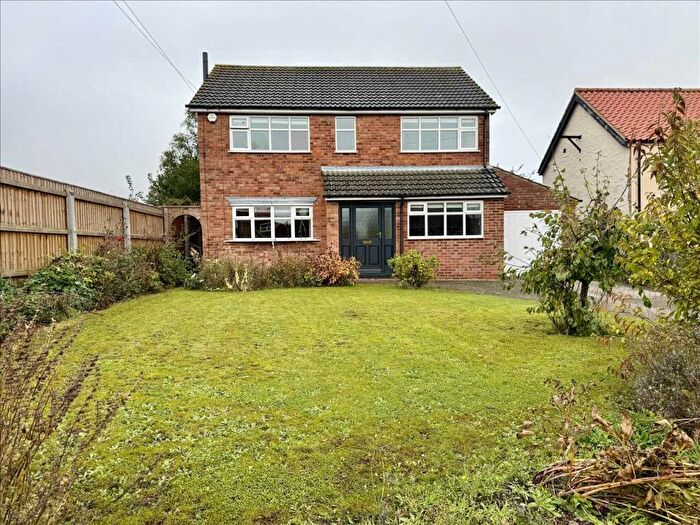
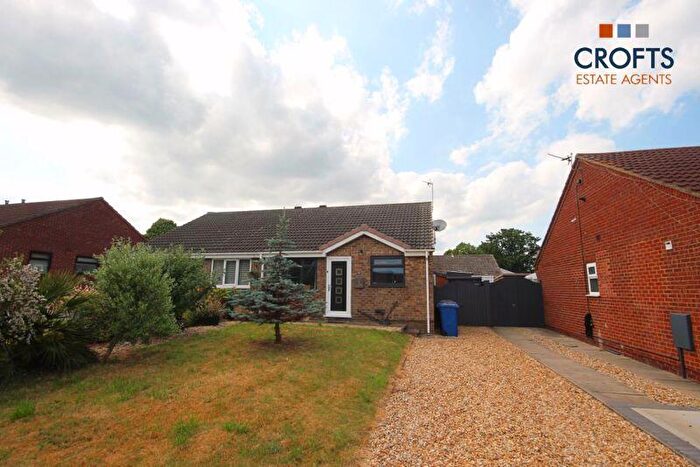
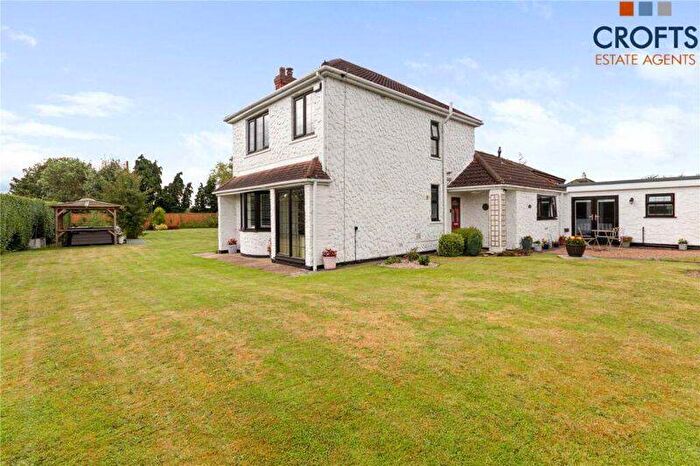
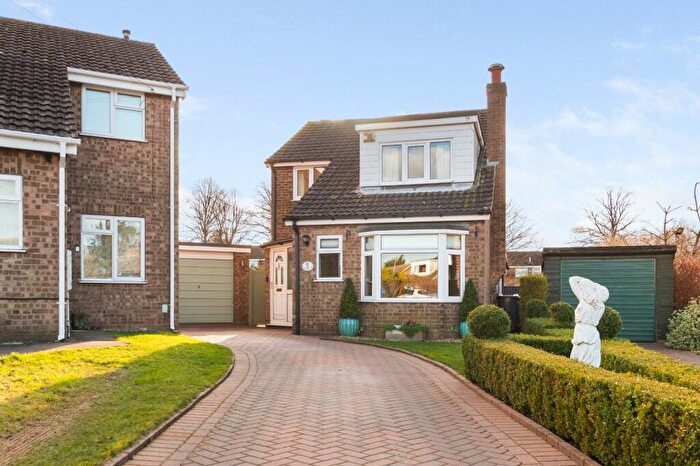
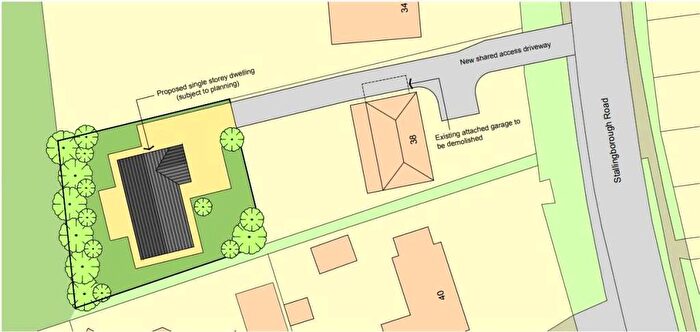
Properties for sale in Yarborough
Roads and Postcodes in Yarborough
Navigate through our locations to find the location of your next house in Yarborough, Grimsby for sale or to rent.
| Streets | Postcodes |
|---|---|
| Aintree Court | DN41 8RA |
| Barton Street | DN41 8EP |
| Beck Close | DN41 8SB |
| Broadway | DN41 8EQ |
| Brocklesby Road | DN41 8HR |
| Caddle Road | DN41 8ET |
| Church Lane | DN41 8ED |
| Churchill Avenue | DN41 8HN |
| Cissplatt Lane | DN41 8HU |
| College Street | DN34 4BX |
| Cotham Gardens | DN41 8RB |
| Cross Roads | DN37 8NH |
| Eastfield Road | DN41 8JE |
| Glenside | DN37 8NW |
| Habrough Road | DN41 8PH |
| Healing Road | DN37 8NQ |
| Karen Avenue | DN41 8EU |
| King Street | DN41 8EE |
| Longmeadow Rise | DN41 8EY |
| Manor Close | DN41 8EG |
| Manor Street | DN41 8EF |
| Maple Avenue | DN41 8EN |
| Maple Close | DN41 8EL |
| Midfield Way | DN41 8SD DN41 8SL |
| Milson Road | DN41 8ES |
| Mulberry Close | DN41 8EX |
| New Cottages | DN37 8NJ |
| Newsum Gardens | DN41 8RD |
| North End | DN41 8HZ |
| Pelham Crescent | DN41 8EW |
| Raithby Avenue | DN41 8SG DN41 8SH |
| Riby Road | DN41 8ER |
| Rowan Close | DN41 8SA |
| Roxton Avenue | DN41 8HY |
| Roxton Lane | DN41 8JB |
| South Street | DN41 8HE |
| Southwell Court | DN41 8SW |
| St Annes Road | DN41 8HJ DN41 8HQ |
| St Bartholomews Close | DN41 8EB |
| Stallingborough Road | DN41 8JA |
| Suddle Way | DN41 8HD |
| The Limes | DN41 8HA |
| Thornton Gardens | DN41 8RE |
| Tomline Close | DN41 8JF |
| Victoria Road | DN41 8EH |
| Ward Court | DN41 8EZ |
| West Lane | DN41 8EJ |
| Westview Close | DN41 8HL |
| Windsor Close | DN41 8JG |
| Wivell Drive | DN41 8HF |
| Woodlands Avenue | DN41 8SE DN41 8SF |
| Yarborough Road | DN41 8HG DN41 8HP DN41 8HT DN41 8HX |
| DN37 8NE DN37 8NG DN37 8NN |
Transport near Yarborough
- FAQ
- Price Paid By Year
- Property Type Price
Frequently asked questions about Yarborough
What is the average price for a property for sale in Yarborough?
The average price for a property for sale in Yarborough is £196,563. This amount is 18% lower than the average price in Grimsby. There are 226 property listings for sale in Yarborough.
What streets have the most expensive properties for sale in Yarborough?
The streets with the most expensive properties for sale in Yarborough are Cotham Gardens at an average of £297,500, Church Lane at an average of £273,666 and Cissplatt Lane at an average of £257,500.
What streets have the most affordable properties for sale in Yarborough?
The streets with the most affordable properties for sale in Yarborough are The Limes at an average of £119,500, Aintree Court at an average of £120,000 and Southwell Court at an average of £121,750.
Which train stations are available in or near Yarborough?
Some of the train stations available in or near Yarborough are Stallingborough, Habrough and Healing.
Property Price Paid in Yarborough by Year
The average sold property price by year was:
| Year | Average Sold Price | Price Change |
Sold Properties
|
|---|---|---|---|
| 2025 | £184,543 | -7% |
23 Properties |
| 2024 | £197,784 | -4% |
26 Properties |
| 2023 | £205,627 | 4% |
27 Properties |
| 2022 | £196,878 | 1% |
33 Properties |
| 2021 | £195,639 | 14% |
49 Properties |
| 2020 | £167,978 | -14% |
26 Properties |
| 2019 | £190,873 | 11% |
36 Properties |
| 2018 | £169,816 | 3% |
36 Properties |
| 2017 | £164,337 | 2% |
35 Properties |
| 2016 | £161,368 | 5% |
43 Properties |
| 2015 | £153,995 | - |
23 Properties |
| 2014 | £153,979 | 10% |
38 Properties |
| 2013 | £139,053 | 2% |
27 Properties |
| 2012 | £136,680 | -11% |
25 Properties |
| 2011 | £151,689 | 18% |
29 Properties |
| 2010 | £124,280 | -35% |
21 Properties |
| 2009 | £167,916 | 16% |
24 Properties |
| 2008 | £141,176 | -19% |
17 Properties |
| 2007 | £168,482 | 21% |
39 Properties |
| 2006 | £133,298 | -11% |
47 Properties |
| 2005 | £147,627 | 11% |
30 Properties |
| 2004 | £131,350 | 24% |
34 Properties |
| 2003 | £100,432 | 32% |
40 Properties |
| 2002 | £68,260 | 11% |
50 Properties |
| 2001 | £60,712 | -9% |
50 Properties |
| 2000 | £66,223 | 22% |
53 Properties |
| 1999 | £51,637 | 4% |
36 Properties |
| 1998 | £49,488 | 4% |
42 Properties |
| 1997 | £47,742 | -10% |
44 Properties |
| 1996 | £52,313 | -6% |
38 Properties |
| 1995 | £55,600 | - |
42 Properties |
Property Price per Property Type in Yarborough
Here you can find historic sold price data in order to help with your property search.
The average Property Paid Price for specific property types in the last three years are:
| Property Type | Average Sold Price | Sold Properties |
|---|---|---|
| Semi Detached House | £181,220.00 | 25 Semi Detached Houses |
| Detached House | £253,737.00 | 29 Detached Houses |
| Terraced House | £138,634.00 | 22 Terraced Houses |

