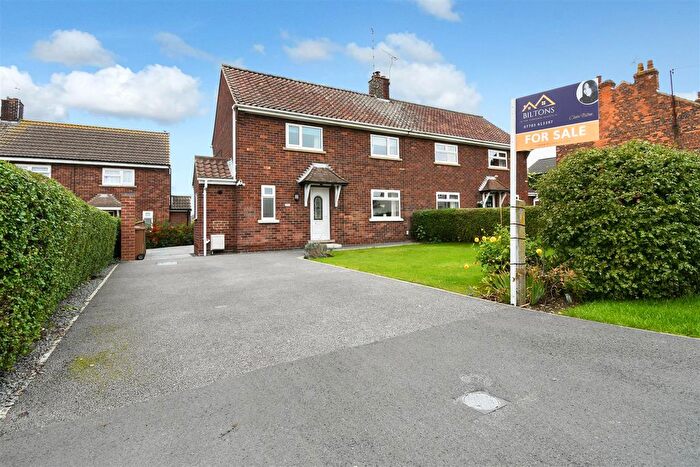
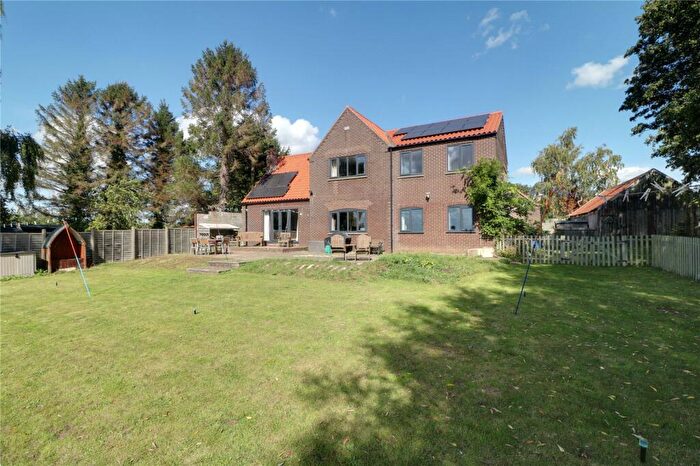
Houses for sale & to rent in Brigg And Wolds, Barnetby
House Prices in Brigg And Wolds
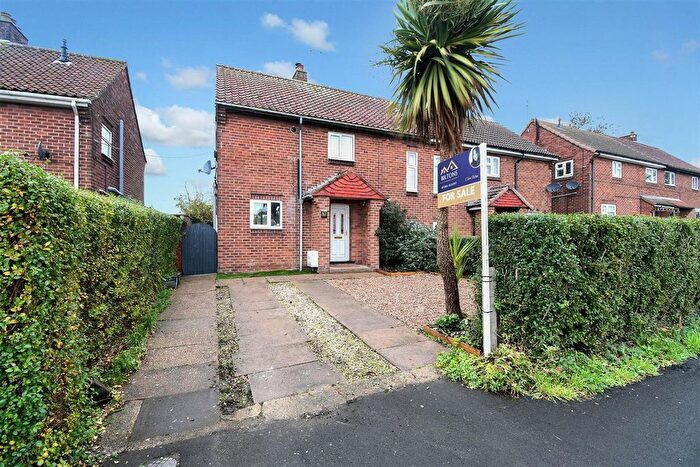
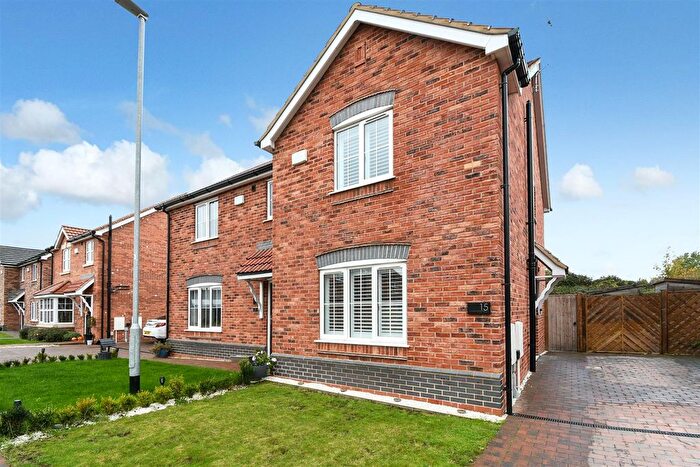
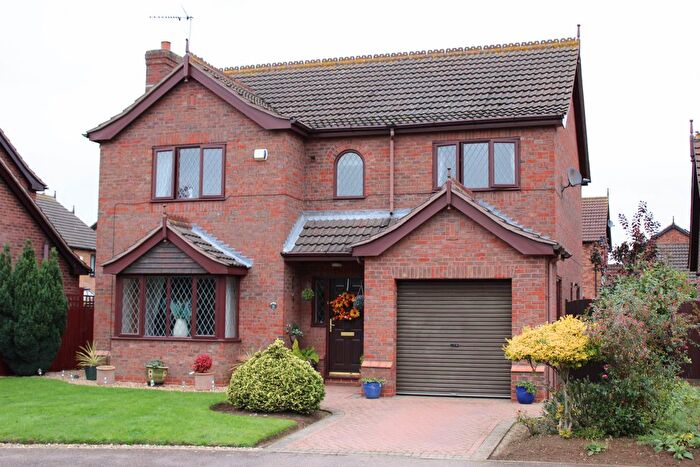
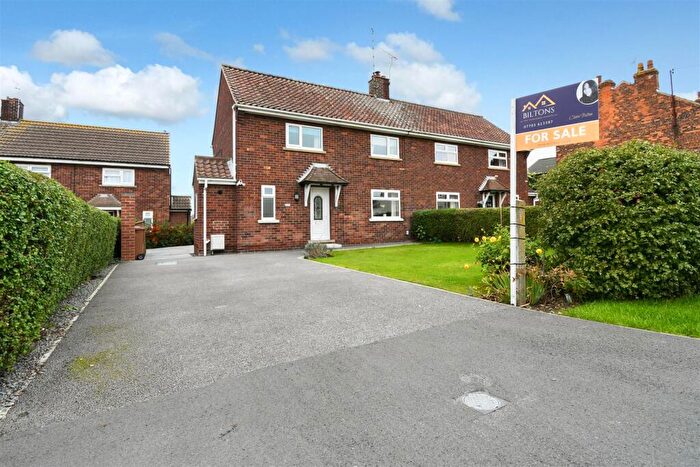
Properties in Brigg And Wolds have an average house price of £194,337.00 and had 102 Property Transactions within the last 3 years¹.
Brigg And Wolds is an area in Barnetby, North Lincolnshire with 832 households², where the most expensive property was sold for £605,000.00.
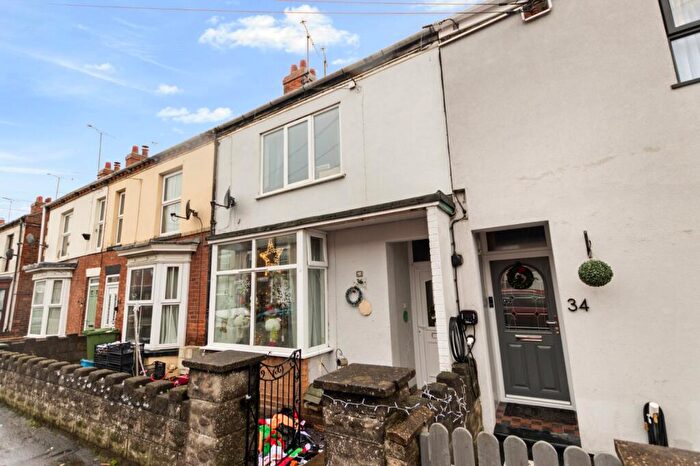
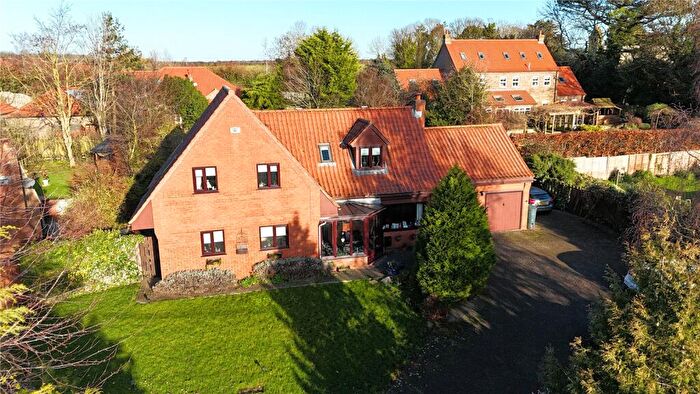
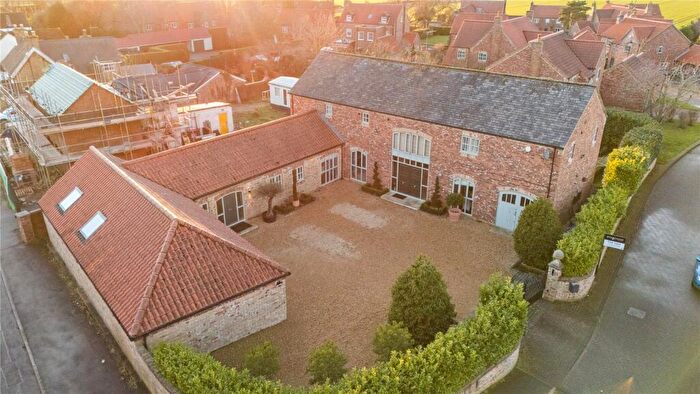
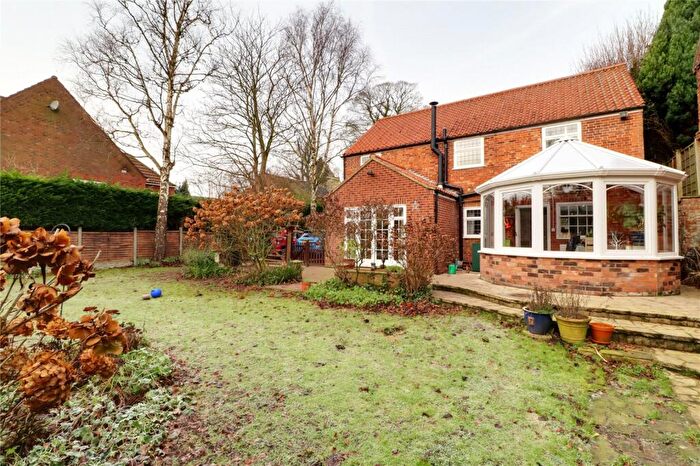
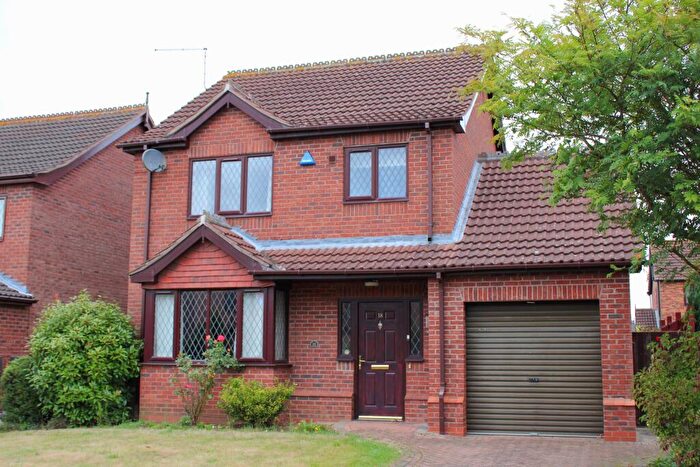
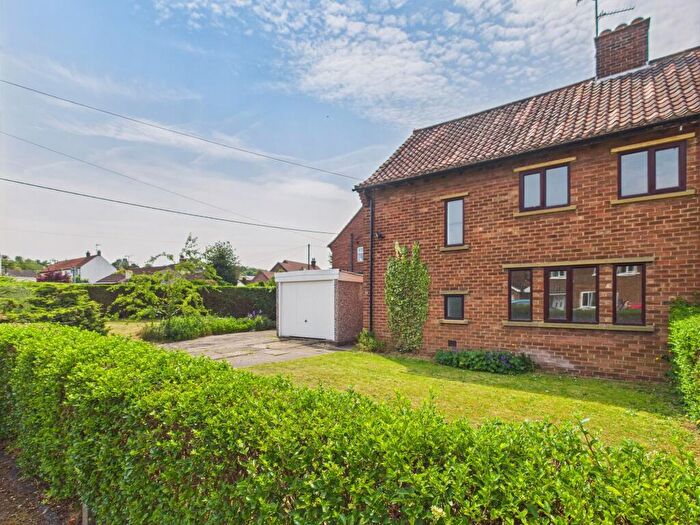
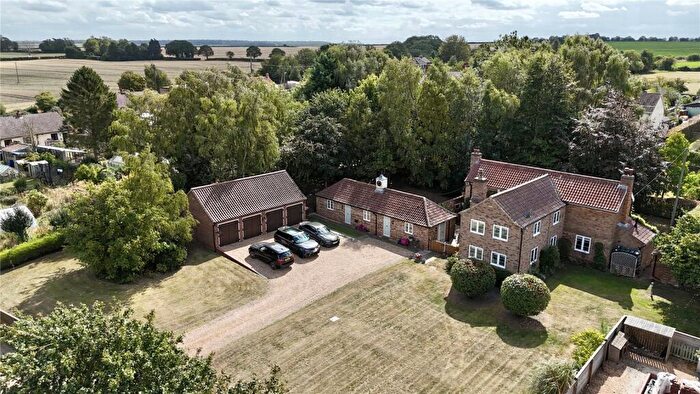
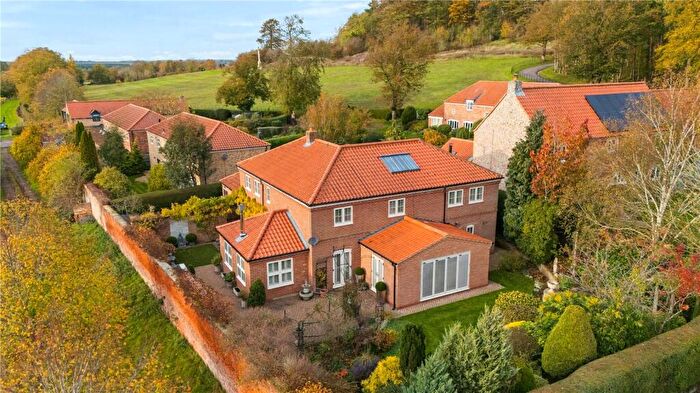
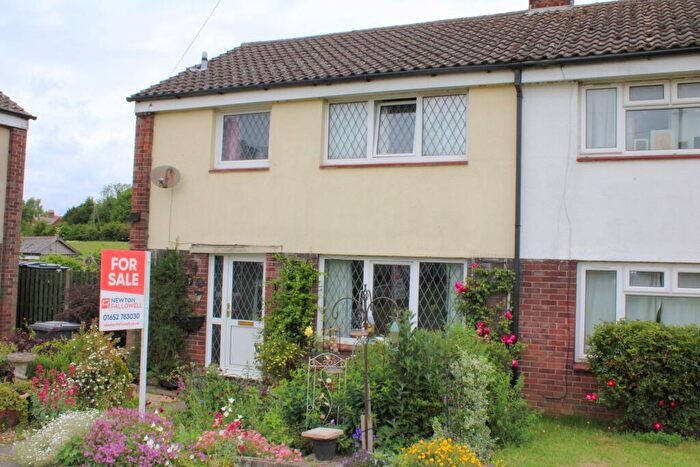
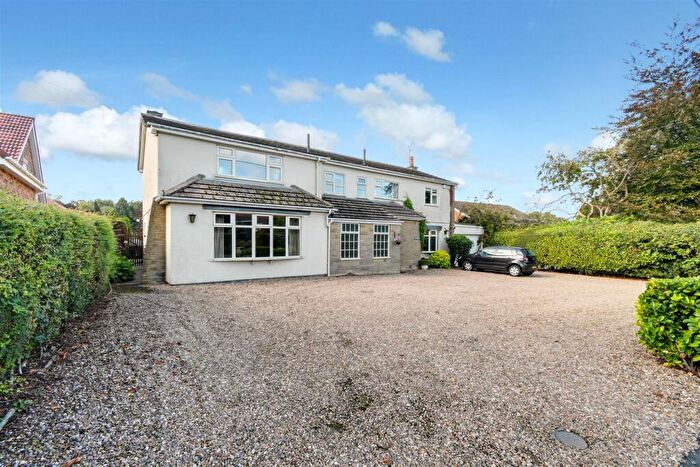
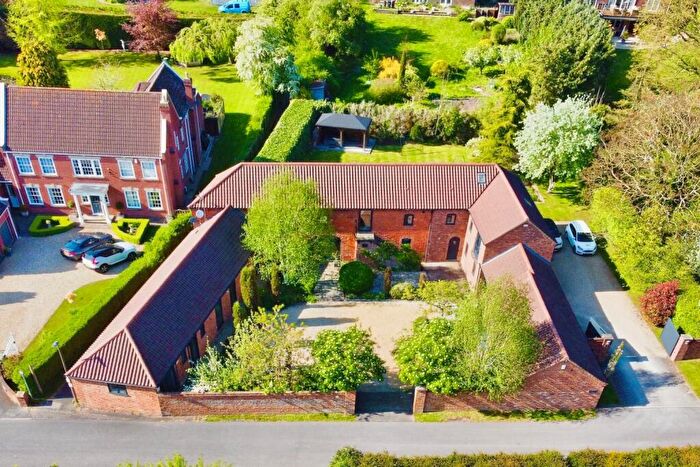
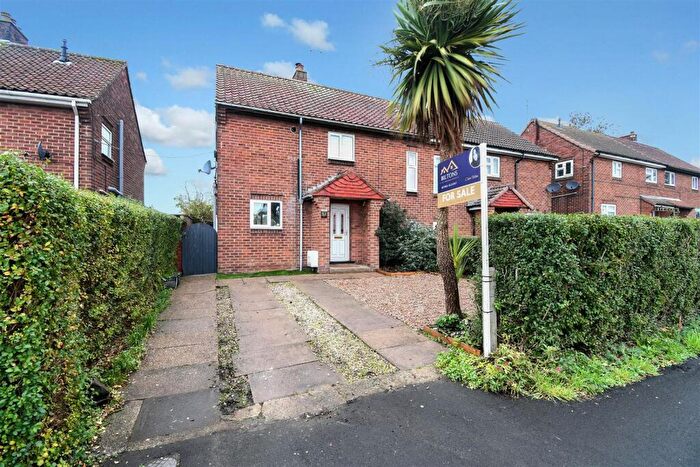
Properties for sale in Brigg And Wolds
Previously listed properties in Brigg And Wolds
Roads and Postcodes in Brigg And Wolds
Navigate through our locations to find the location of your next house in Brigg And Wolds, Barnetby for sale or to rent.
| Streets | Postcodes |
|---|---|
| Bakers Close | DN38 6JS |
| Birch Way | DN38 6FF |
| Braithwaites Close | DN38 6BF |
| Chestnut Grove | DN38 6FD |
| Council Villas | DN38 6DT |
| Cuthbert Avenue | DN38 6JF |
| Ferneries Lane | DN38 6HN |
| Hillside Crescent | DN38 6HQ |
| Kings Road | DN38 6HF DN38 6HG DN38 6HH DN38 6HJ |
| Kirmington Vale | DN38 6AF |
| Marsh Lane | DN38 6JW |
| Melton High Wood | DN38 6AA |
| Middlegate Mews | DN38 6DF |
| Mill Farm Cottages | DN38 6EB |
| New Row | DN38 6DX |
| Oak Grove | DN38 6DB |
| Old Post Office Lane | DN38 6JJ |
| Potts Close | DN38 6JL |
| Queens Road | DN38 6JH |
| Railway Street | DN38 6DH DN38 6DQ DN38 6DJ |
| Silver Street | DN38 6HR DN38 6HS |
| Smithy Lane | DN38 6JG |
| South Street | DN38 6JN |
| St Barnabas Road | DN38 6JB DN38 6JE DN38 6JQ DN38 6JD |
| St Marys Avenue | DN38 6HU |
| Sycamore Close | DN38 6FG |
| The Wold | DN38 6DZ |
| Victoria Road | DN38 6HP DN38 6HT DN38 6HW DN38 6HY DN38 6HZ DN38 6HL |
| Walkers Close | DN38 6JA |
| West Holme | DN38 6DS |
| West Street | DN38 6JP |
| Willow Close | DN38 6DD |
| Windsor Way | DN38 6LG DN38 6LA |
| Woodland View | DN38 6FE |
| DN38 6DL DN38 6DR DN38 6DU DN38 6DW DN38 6DY DN38 6AB DN38 6AE DN38 6DG DN38 6DN DN38 6EA DN38 6EL DN38 6HX DN38 6LB |
Transport near Brigg And Wolds
-
Barnetby Station
-
Brigg Station
-
Ulceby Station
-
Habrough Station
-
Thornton Abbey Station
-
Goxhill Station
-
Barton-On-Humber Station
-
Barrow Haven Station
-
New Holland Station
-
Stallingborough Station
- FAQ
- Price Paid By Year
- Property Type Price
Frequently asked questions about Brigg And Wolds
What is the average price for a property for sale in Brigg And Wolds?
The average price for a property for sale in Brigg And Wolds is £194,337. There are 266 property listings for sale in Brigg And Wolds.
What streets have the most expensive properties for sale in Brigg And Wolds?
The streets with the most expensive properties for sale in Brigg And Wolds are Queens Road at an average of £337,500, Marsh Lane at an average of £313,333 and Chestnut Grove at an average of £297,500.
What streets have the most affordable properties for sale in Brigg And Wolds?
The streets with the most affordable properties for sale in Brigg And Wolds are Silver Street at an average of £114,892, Old Post Office Lane at an average of £137,000 and St Marys Avenue at an average of £138,333.
Which train stations are available in or near Brigg And Wolds?
Some of the train stations available in or near Brigg And Wolds are Barnetby, Brigg and Ulceby.
Property Price Paid in Brigg And Wolds by Year
The average sold property price by year was:
| Year | Average Sold Price | Price Change |
Sold Properties
|
|---|---|---|---|
| 2025 | £204,727 | 7% |
22 Properties |
| 2024 | £191,393 | 3% |
33 Properties |
| 2023 | £185,531 | -5% |
16 Properties |
| 2022 | £194,643 | -5% |
31 Properties |
| 2021 | £205,019 | 12% |
38 Properties |
| 2020 | £181,107 | 12% |
32 Properties |
| 2019 | £158,845 | 2% |
46 Properties |
| 2018 | £155,075 | -3% |
33 Properties |
| 2017 | £159,770 | -1% |
35 Properties |
| 2016 | £160,866 | 1% |
34 Properties |
| 2015 | £159,627 | 15% |
27 Properties |
| 2014 | £136,116 | 12% |
28 Properties |
| 2013 | £119,898 | 5% |
17 Properties |
| 2012 | £113,793 | -16% |
16 Properties |
| 2011 | £131,680 | 4% |
18 Properties |
| 2010 | £126,408 | -14% |
17 Properties |
| 2009 | £143,829 | -15% |
22 Properties |
| 2008 | £166,050 | 7% |
20 Properties |
| 2007 | £153,616 | 18% |
30 Properties |
| 2006 | £126,309 | -3% |
51 Properties |
| 2005 | £130,325 | 3% |
33 Properties |
| 2004 | £126,347 | 15% |
32 Properties |
| 2003 | £106,769 | 28% |
66 Properties |
| 2002 | £76,632 | 23% |
62 Properties |
| 2001 | £58,975 | -2% |
58 Properties |
| 2000 | £60,273 | 9% |
62 Properties |
| 1999 | £54,601 | 3% |
57 Properties |
| 1998 | £52,877 | -4% |
24 Properties |
| 1997 | £54,785 | 29% |
24 Properties |
| 1996 | £38,791 | 6% |
24 Properties |
| 1995 | £36,450 | - |
16 Properties |
Property Price per Property Type in Brigg And Wolds
Here you can find historic sold price data in order to help with your property search.
The average Property Paid Price for specific property types in the last three years are:
| Property Type | Average Sold Price | Sold Properties |
|---|---|---|
| Semi Detached House | £171,738.00 | 44 Semi Detached Houses |
| Detached House | £260,459.00 | 38 Detached Houses |
| Terraced House | £118,425.00 | 20 Terraced Houses |

