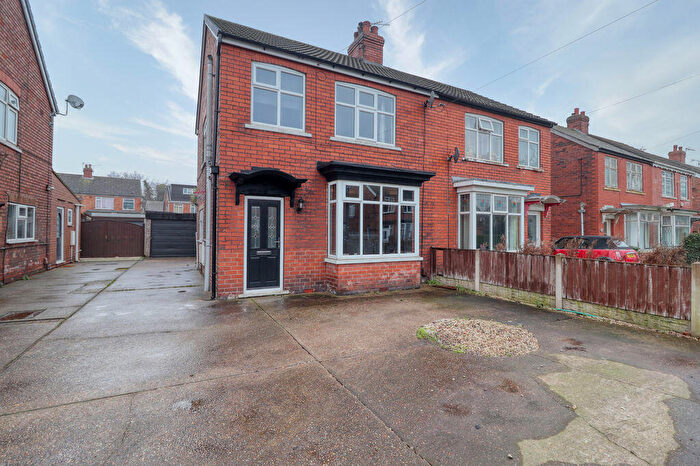
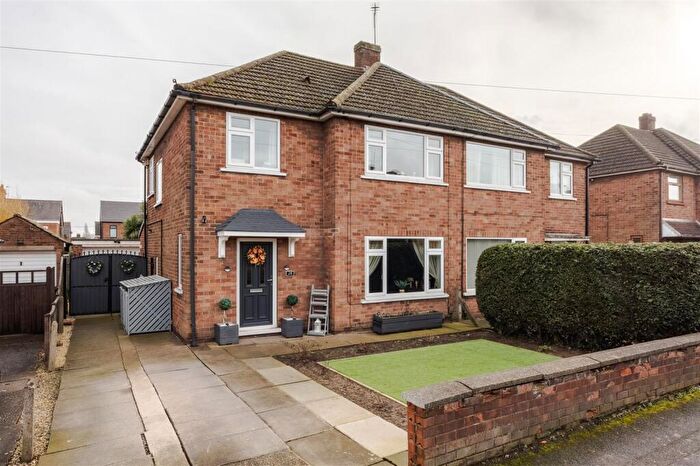
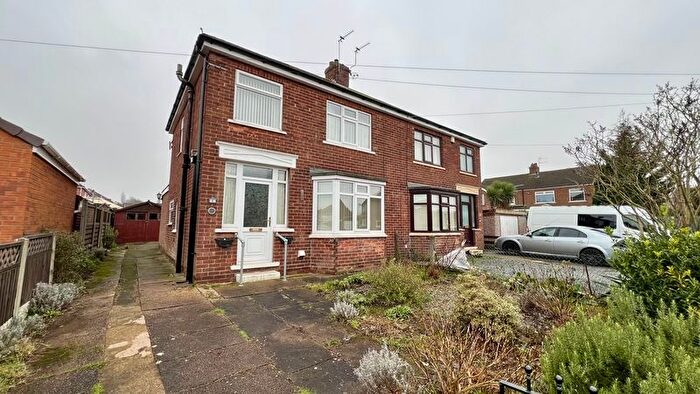
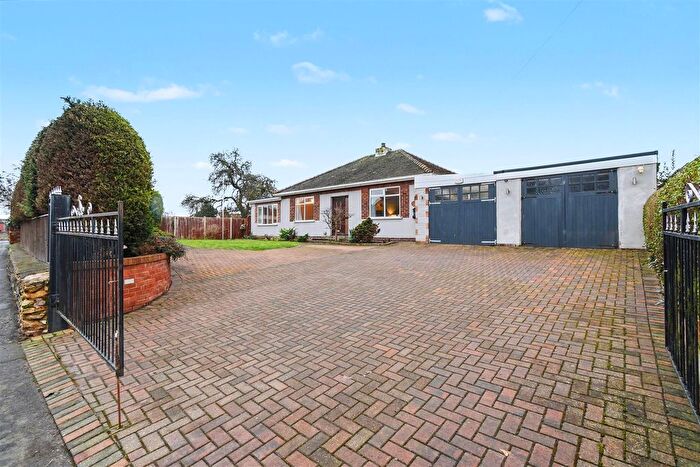
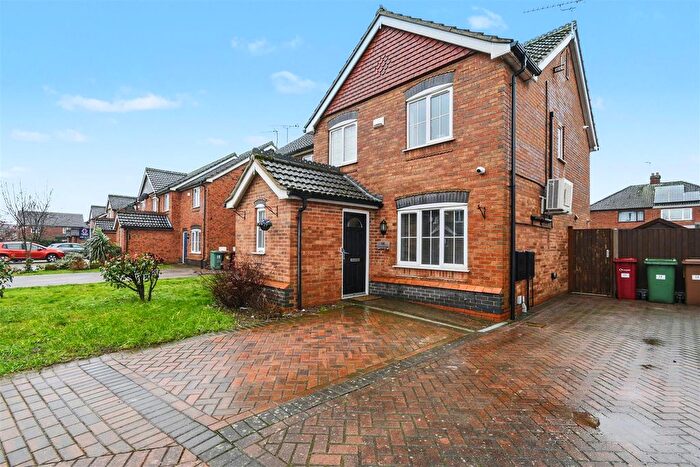
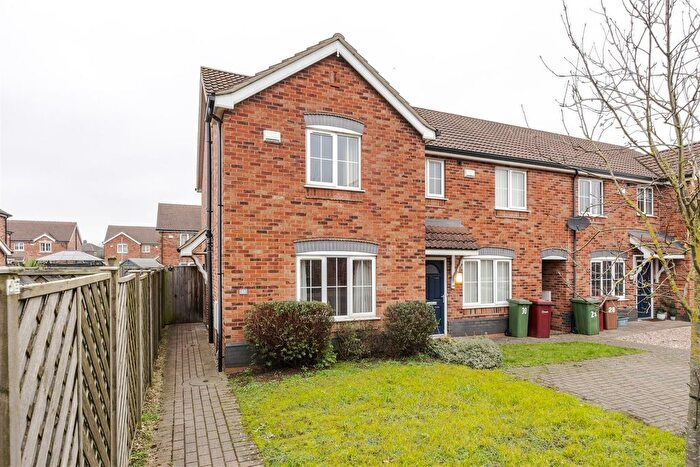
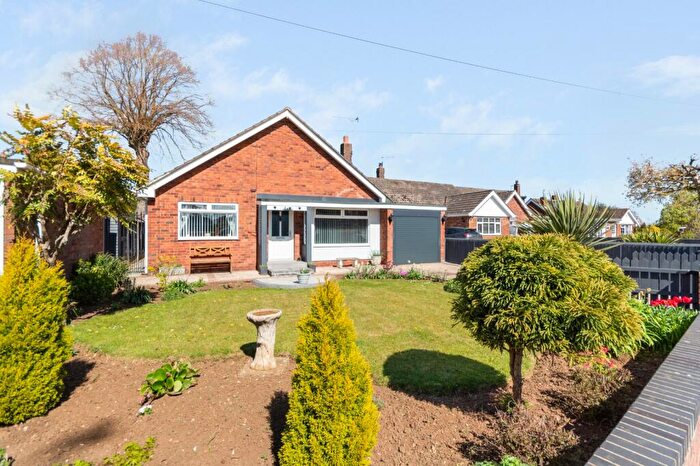
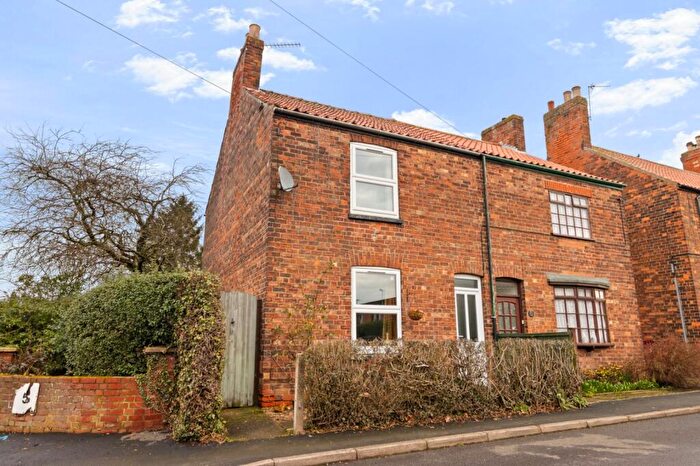
Houses for sale & to rent in North Lincolnshire, England
House Prices in North Lincolnshire
Properties in North Lincolnshire have
an average house price of
£190,211.00
and had 6,579 Property Transactions
within the last 3 years.¹
North Lincolnshire is a location in
England with
70,631 households², where the most expensive property was sold for £1,500,000.00.
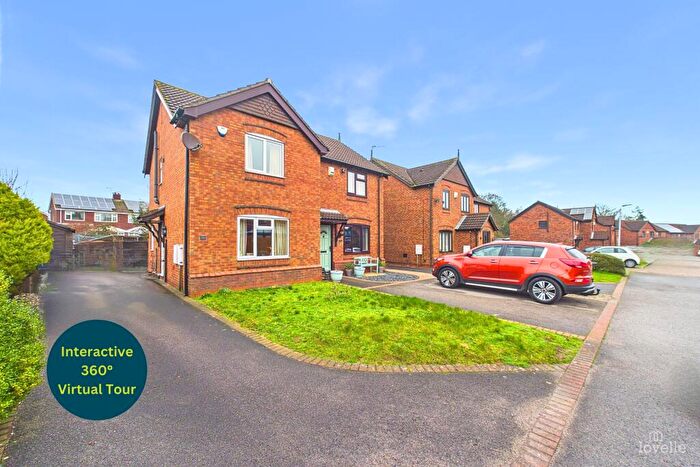
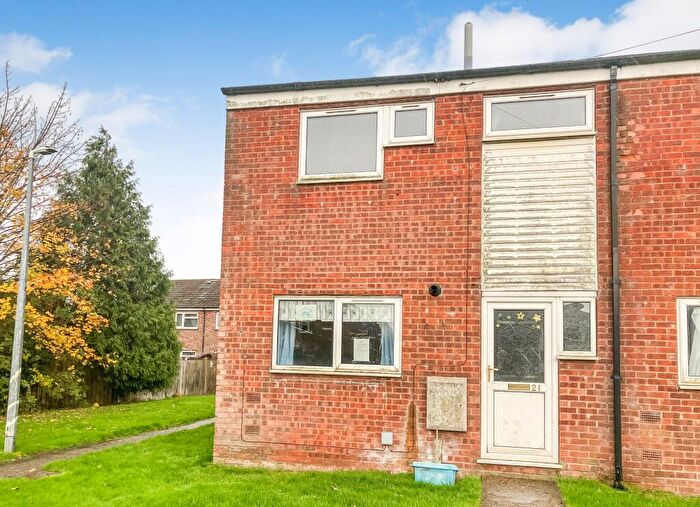
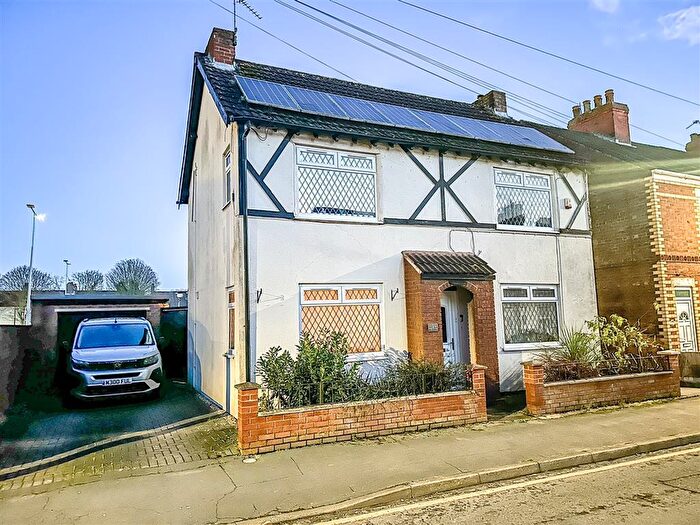
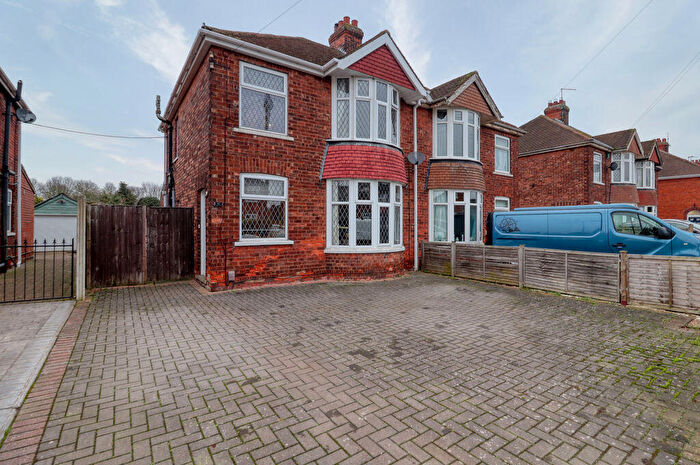
Properties for sale in North Lincolnshire
Towns in North Lincolnshire
Navigate through our locations to find the location of your next house in North Lincolnshire, England for sale or to rent.
Transport in North Lincolnshire
Please see below transportation links in this area:
-
Scunthorpe Station
-
Althorpe Station
-
Brigg Station
-
Kirton Lindsey Station
-
Barnetby Station
-
Crowle Station
-
Barton-On-Humber Station
-
Brough Station
-
Ferriby Station
- FAQ
- Price Paid By Year
- Property Type Price
Frequently asked questions about North Lincolnshire
What is the average price for a property for sale in North Lincolnshire?
The average price for a property for sale in North Lincolnshire is £190,211. This amount is 47% lower than the average price in England. There are more than 10,000 property listings for sale in North Lincolnshire.
What locations have the most expensive properties for sale in North Lincolnshire?
The locations with the most expensive properties for sale in North Lincolnshire are Doncaster at an average of £277,465, Barrow-upon-humber at an average of £230,920 and Gainsborough at an average of £223,610.
What locations have the most affordable properties for sale in North Lincolnshire?
The locations with the most affordable properties for sale in North Lincolnshire are Scunthorpe at an average of £166,057, Immingham at an average of £190,656 and Barton-upon-humber at an average of £195,860.
Which train stations are available in or near North Lincolnshire?
Some of the train stations available in or near North Lincolnshire are Scunthorpe, Althorpe and Brigg.
Property Price Paid in North Lincolnshire by Year
The average sold property price by year was:
| Year | Average Sold Price | Price Change |
Sold Properties
|
|---|---|---|---|
| 2025 | £196,068 | 3% |
2,031 Properties |
| 2024 | £189,491 | 2% |
2,371 Properties |
| 2023 | £185,532 | -4% |
2,177 Properties |
| 2022 | £192,870 | 5% |
2,829 Properties |
| 2021 | £182,795 | 6% |
3,195 Properties |
| 2020 | £171,354 | 7% |
2,359 Properties |
| 2019 | £158,662 | 1% |
2,701 Properties |
| 2018 | £156,613 | 6% |
2,820 Properties |
| 2017 | £147,941 | 3% |
3,027 Properties |
| 2016 | £143,056 | 2% |
2,772 Properties |
| 2015 | £140,665 | 5% |
2,649 Properties |
| 2014 | £133,907 | 2% |
2,454 Properties |
| 2013 | £130,705 | 2% |
2,012 Properties |
| 2012 | £127,833 | 1% |
1,720 Properties |
| 2011 | £126,030 | -7% |
1,727 Properties |
| 2010 | £134,779 | 3% |
1,675 Properties |
| 2009 | £130,335 | -6% |
1,494 Properties |
| 2008 | £137,765 | 0,2% |
1,863 Properties |
| 2007 | £137,538 | 5% |
3,509 Properties |
| 2006 | £130,874 | 4% |
3,649 Properties |
| 2005 | £125,038 | 8% |
2,764 Properties |
| 2004 | £114,502 | 20% |
3,590 Properties |
| 2003 | £91,361 | 23% |
3,870 Properties |
| 2002 | £70,695 | 12% |
4,396 Properties |
| 2001 | £62,362 | 9% |
3,806 Properties |
| 2000 | £56,555 | 6% |
3,430 Properties |
| 1999 | £53,262 | 5% |
2,999 Properties |
| 1998 | £50,680 | 3% |
2,556 Properties |
| 1997 | £49,208 | 4% |
2,686 Properties |
| 1996 | £47,236 | 2% |
2,213 Properties |
| 1995 | £46,279 | - |
2,031 Properties |
Property Price per Property Type in North Lincolnshire
Here you can find historic sold price data in order to help with your property search.
The average Property Paid Price for specific property types in the last three years are:
| Property Type | Average Sold Price | Sold Properties |
|---|---|---|
| Semi Detached House | £153,027.00 | 2,815 Semi Detached Houses |
| Terraced House | £117,411.00 | 1,190 Terraced Houses |
| Detached House | £276,555.00 | 2,415 Detached Houses |
| Flat | £81,949.00 | 159 Flats |

