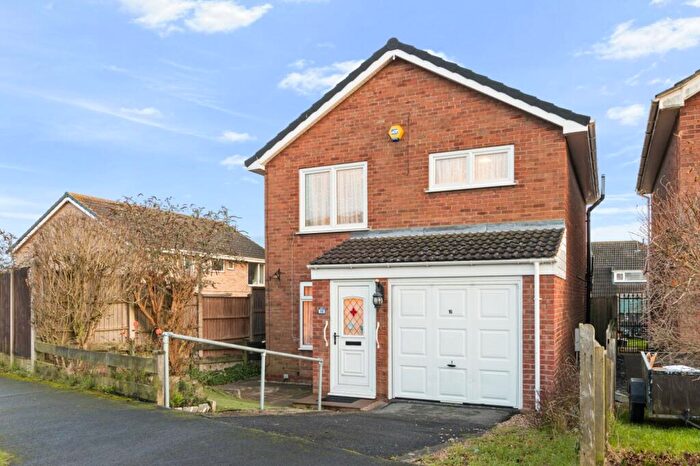
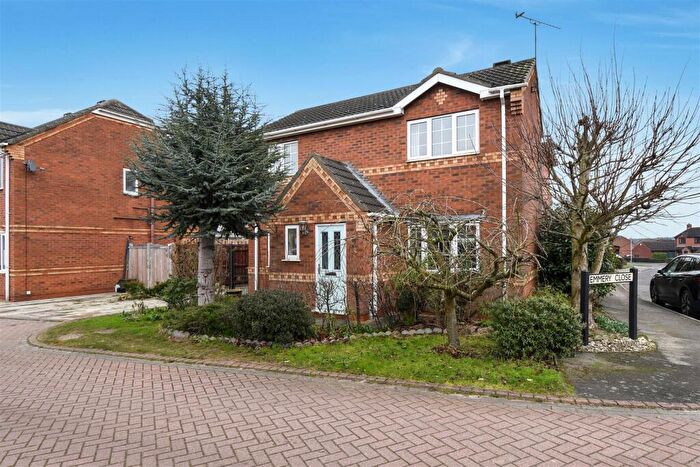
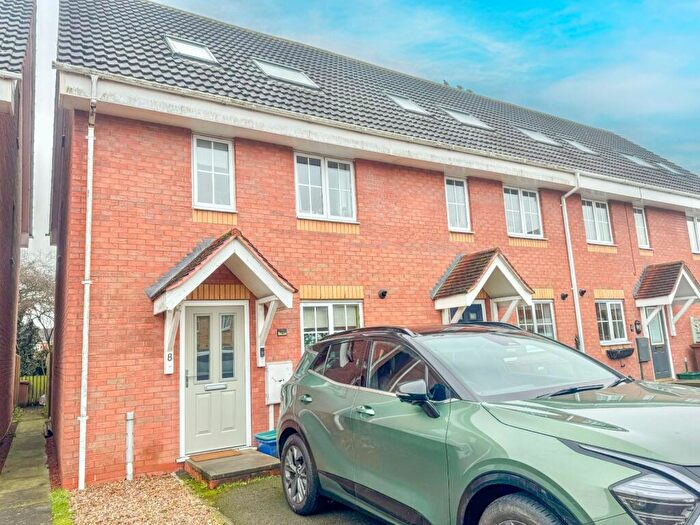
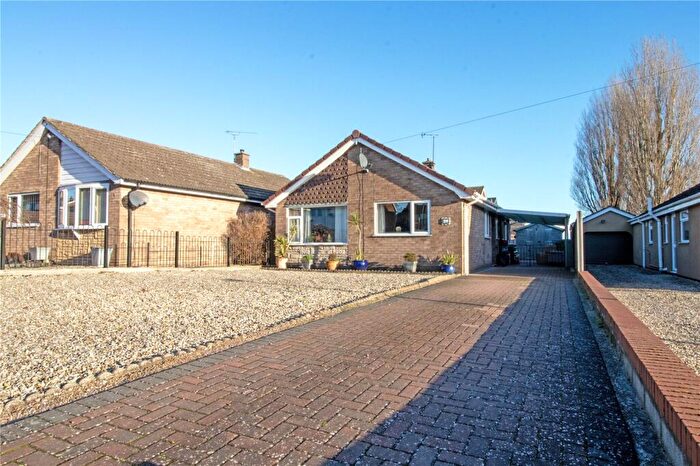
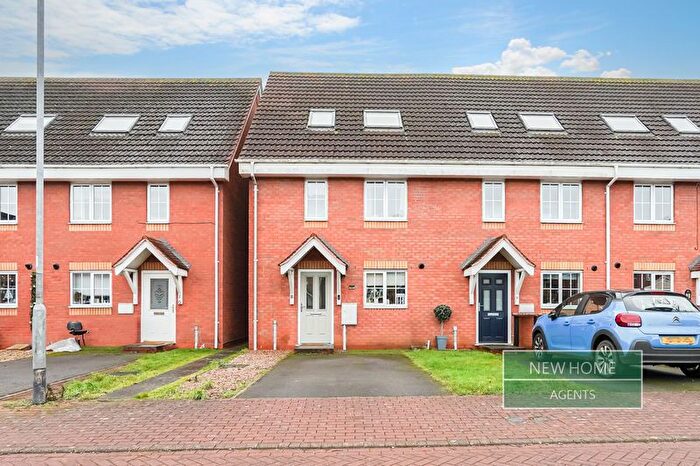
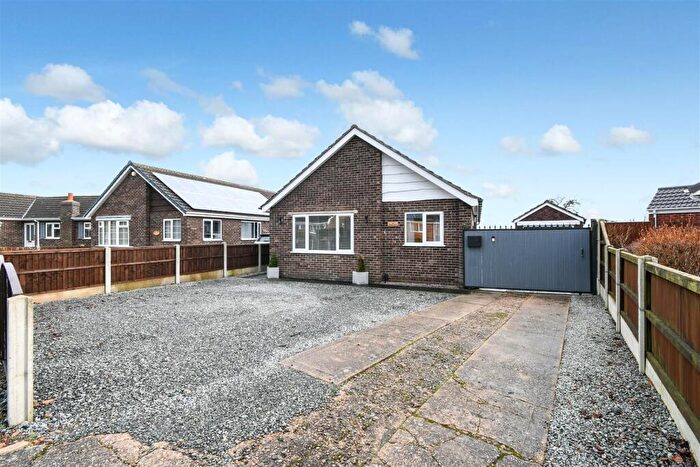
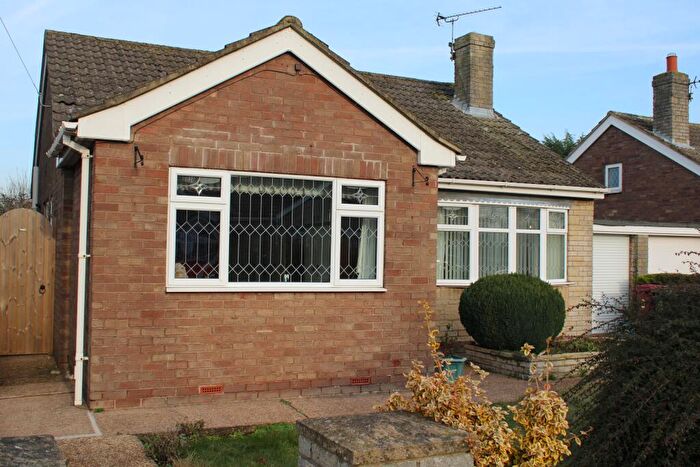
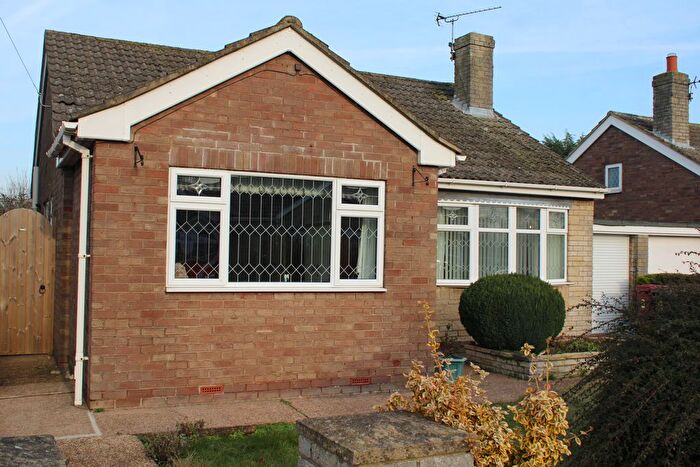
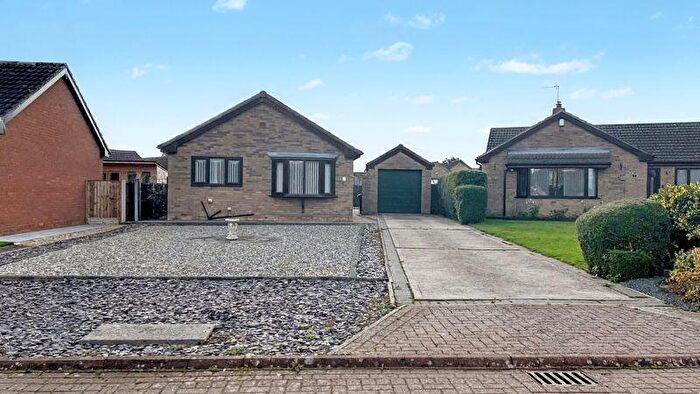
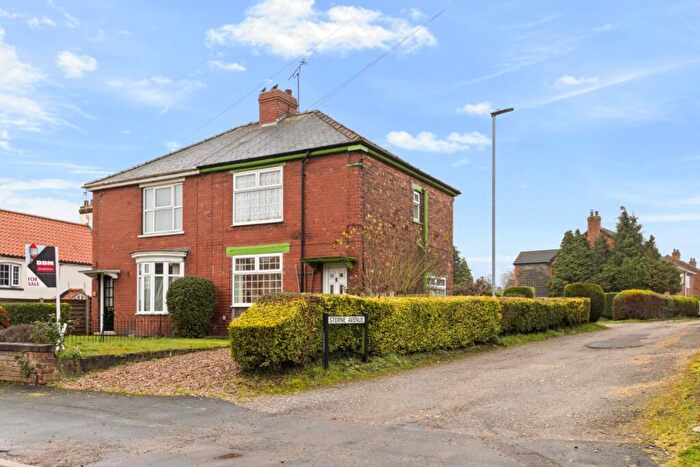
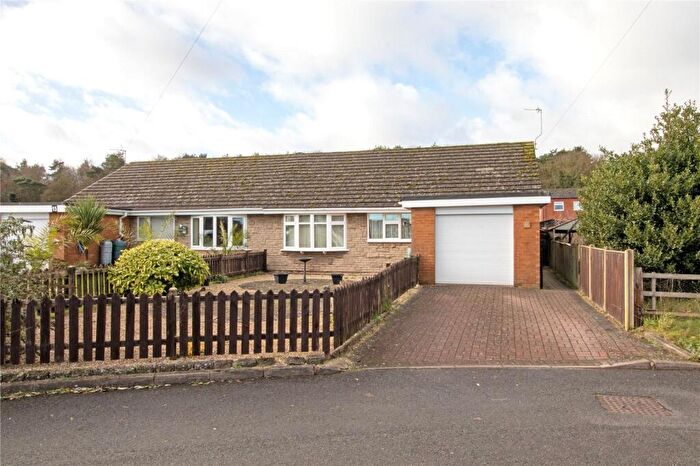
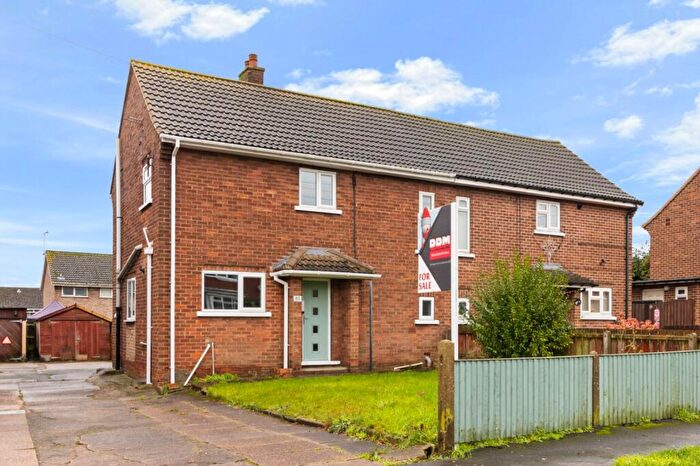
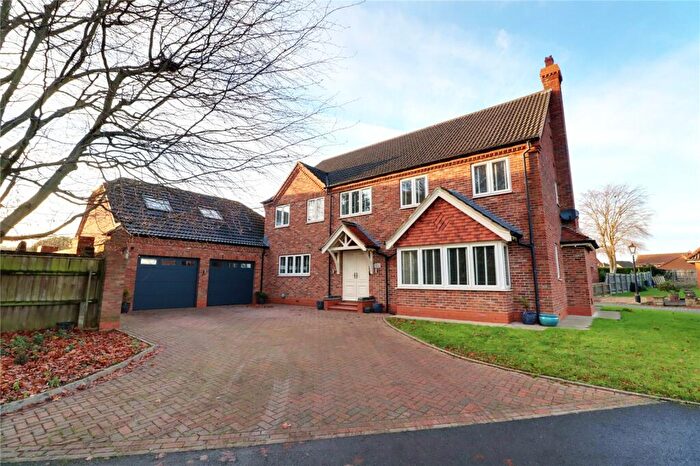
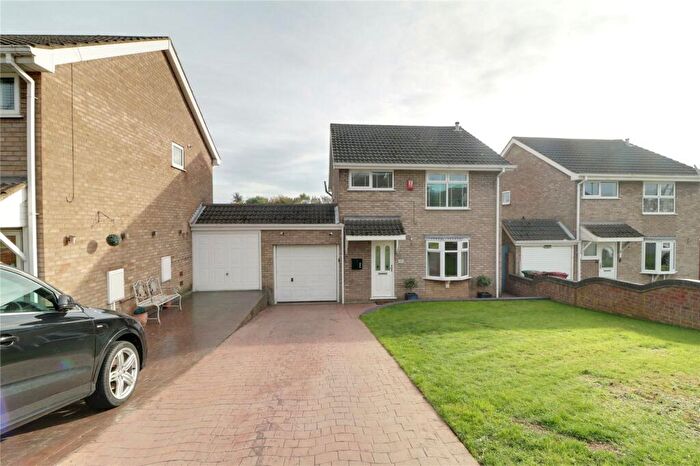
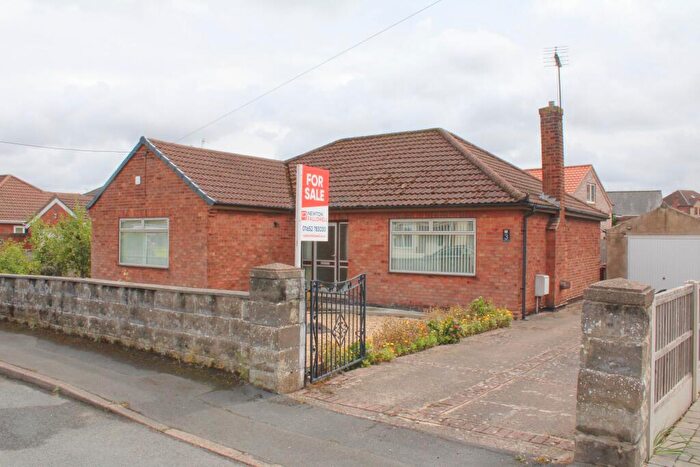
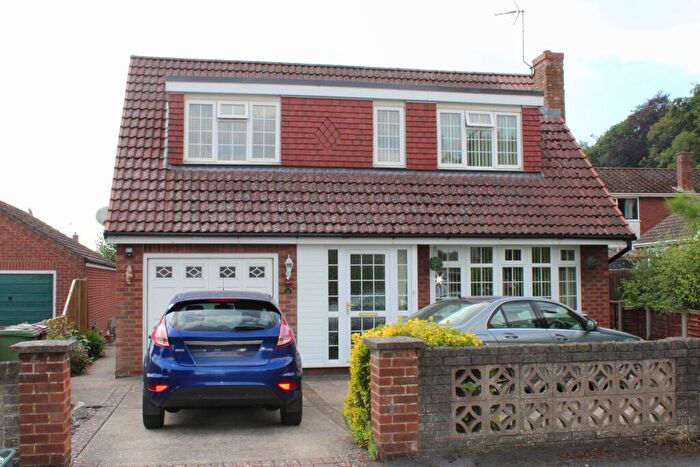
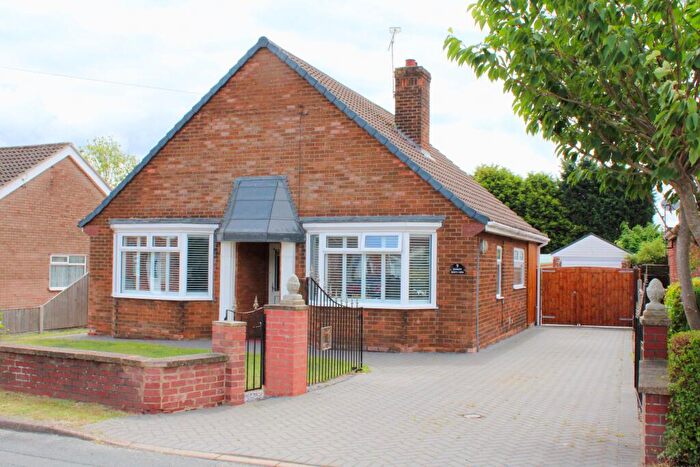
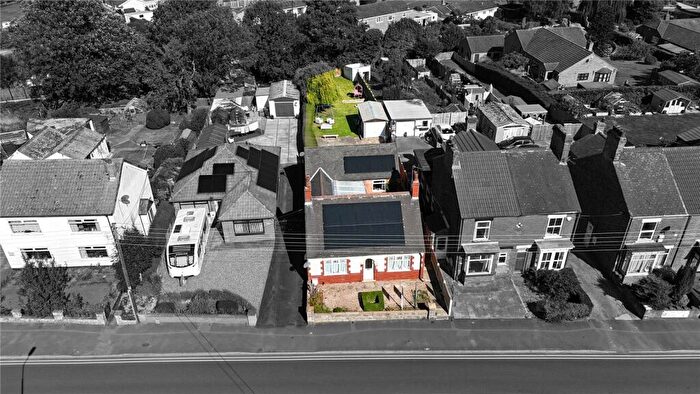
Houses for sale & to rent in Broughton And Appleby, Brigg
House Prices in Broughton And Appleby
Properties in Broughton And Appleby have an average house price of £188,572.00 and had 339 Property Transactions within the last 3 years¹.
Broughton And Appleby is an area in Brigg, North Lincolnshire with 2,404 households², where the most expensive property was sold for £925,000.00.
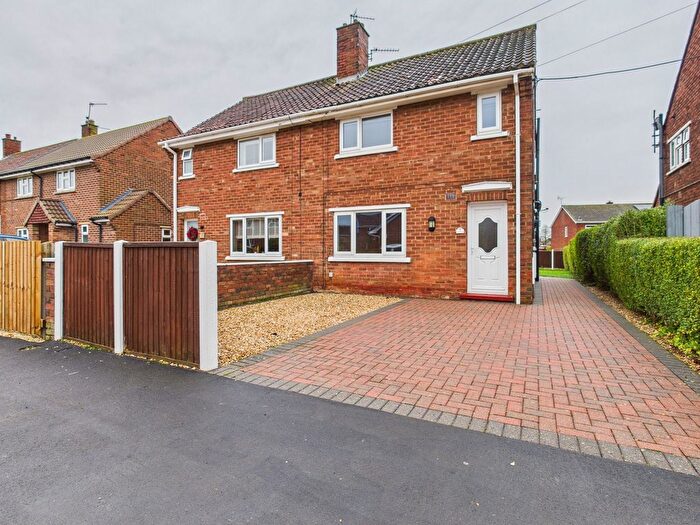
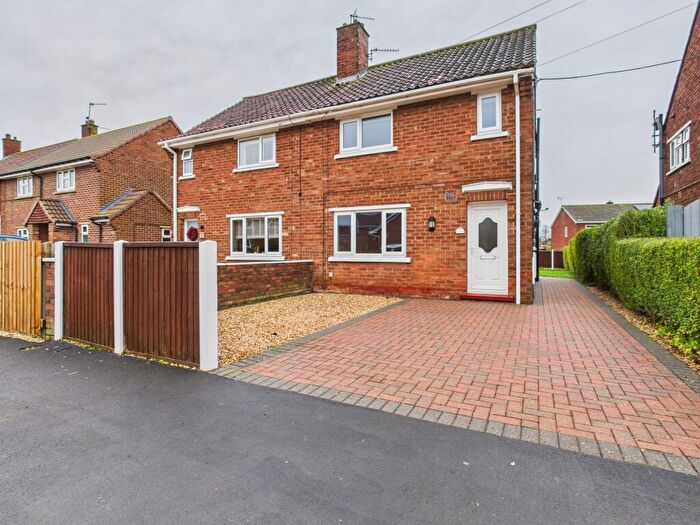
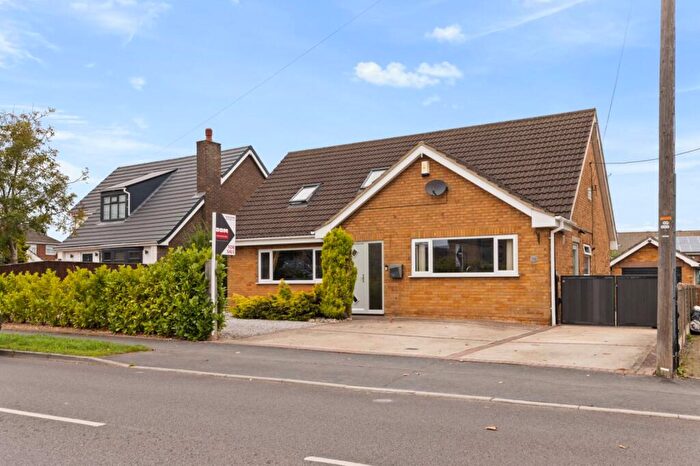
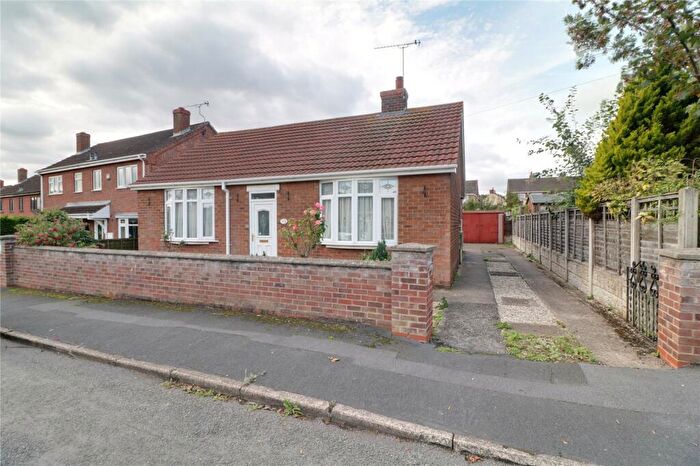
Properties for sale in Broughton And Appleby
Roads and Postcodes in Broughton And Appleby
Navigate through our locations to find the location of your next house in Broughton And Appleby, Brigg for sale or to rent.
| Streets | Postcodes |
|---|---|
| Airedale Close | DN20 0EP |
| Anchors Way | DN20 9RG |
| Appleby Gardens | DN20 0BA |
| Appleby Lane | DN20 0AR DN20 0AS DN20 0AT DN20 0AW DN20 0AY DN20 0BG DN20 0BE |
| Avenue Nozay | DN20 0TR |
| Badger Way | DN20 0TW |
| Barrowby Close | DN20 0DL |
| Bassett Close | DN20 0EN |
| Beagle Close | DN20 0SD |
| Beck Lane | DN20 0HR |
| Beech Close | DN20 0UA |
| Beechwood Crescent | DN20 0SB |
| Brickhill Cottages | DN20 0BY |
| Bridge Road | DN20 0BN |
| Brigg Road | DN20 0BP DN20 0BS DN20 0BT DN20 0JG DN20 0JN DN20 0JW DN20 0BU |
| Brooklands Avenue | DN20 0DP DN20 0DR DN20 0DS DN20 0DY DN20 0ED DN20 0DT |
| Broughton Cross Roads | DN20 9LY DN20 9LZ |
| Broughton Vale | DN20 0AG |
| Bruce Close | DN20 0SA |
| Burnside | DN20 0HT |
| Catherine Grove | DN20 0DF |
| Chambers Court | DN20 0DN |
| Chancel Walk | DN20 0JD |
| Chapel Lane | DN20 0HP |
| Chapel Road | DN20 0HW |
| Chapter Walk | DN20 0JJ |
| Chestnut Grove | DN20 0HX |
| Church Lane | DN20 0AD |
| Cloister Walk | DN20 0JL |
| College Lawns | DN20 0GE |
| Common Road | DN20 0DH |
| Coronation Gardens | DN20 0AE |
| Craig Close | DN20 0SE |
| Dalmatian Way | DN20 0ET |
| Dane Close | DN20 0HU |
| Dixon Avenue | DN20 0LD |
| Eastwood Drive | DN20 0HJ |
| Emmery Close | DN20 0SN |
| Ermine Grove | DN20 0LQ |
| Ermine Street | DN20 0AH DN20 0AJ DN20 0AL DN20 0AQ DN20 0DQ |
| Estate Avenue | DN20 0JY DN20 0JZ |
| Fairfield Close | DN20 0TT |
| Fairview | DN20 0HB |
| George Street | DN20 0LA DN20 0LB DN20 0LE |
| Green Lane | DN20 0BX DN20 0DE |
| Greenhill | DN20 0AN |
| Greyfriars Road | DN20 0JH DN20 0JQ |
| Harrys Dream | DN20 0DW |
| Heron Holt | DN20 0SL |
| High Street | DN20 0HY DN20 0HZ DN20 0JA DN20 0JP DN20 0JR DN20 0JS DN20 0JU DN20 0JX |
| Hillside Road | DN20 0HH DN20 0HQ |
| Hunts Close | DN20 0SF |
| Kingfisher Close | DN20 9FN |
| Labrador Drive | DN20 0ER |
| Lilywood Road | DN20 0LF DN20 0LJ |
| Lych Gate | DN20 0DJ |
| Mallard Way | DN20 9FP |
| Mill Close | DN20 9LL |
| Mill Lane | DN20 0JB DN20 0JE |
| Millers Quay | DN20 9RE |
| Millers Way | DN20 0UE |
| Milson Close | DN20 0EA |
| Old Mill Lane | DN20 0JF |
| Old School Gardens | DN20 0GD |
| Pine Tree Close | DN20 0EU |
| Poplar Drive | DN20 0AP |
| Raven Close | DN20 0TX |
| Riverside | DN20 9RB |
| Rue De Nozay | DN20 0TZ |
| Sand Lane | DN20 0DU DN20 0DX |
| Scawby Road | DN20 0AA DN20 0AB DN20 0AF DN20 9JN DN20 9JH |
| School Houses | DN20 0HA |
| South View | DN20 0EE DN20 0EF DN20 0EG DN20 0EJ DN20 0EY DN20 0EH DN20 0EZ |
| Southfield Road | DN20 0DZ |
| St Bernards Close | DN20 0HS |
| Staniwells Drive | DN20 0BD |
| Sterne Avenue | DN20 0JT |
| Swift Drive | DN20 9FL |
| Sycamore Close | DN20 0UB |
| Teal Close | DN20 9SY |
| The Blackthorns | DN20 0BB |
| The Briars | DN20 0ES |
| The Dell | DN20 0WA |
| The Moorings | DN20 9RD |
| The Narrow Boats | DN20 9RF |
| Town Hill | DN20 0HD DN20 0HL DN20 0HN |
| Town Hill Drive | DN20 0HE DN20 0HF DN20 0HG |
| Trinity Court | DN20 0SJ |
| Waters Edge | DN20 9LJ |
| Wells Court | DN20 0LH |
| Wesley Way | DN20 0NZ |
| Westminster Road | DN20 0AZ |
| Westwood | DN20 0AU |
| Windsor Way | DN20 0EL DN20 0EW |
| Woodland Drive | DN20 0AX DN20 0EQ |
| Wressle Road | DN20 0DB DN20 0DD DN20 0DA |
| Wyatt Avenue | DN20 0LG |
| Yarborough Crescent | DN20 0EB |
| DN20 0BZ DN20 9LF DN20 9LG DN20 0BJ DN20 0BQ DN20 0BW |
Transport near Broughton And Appleby
-
Brigg Station
-
Scunthorpe Station
-
Barnetby Station
-
Kirton Lindsey Station
-
Althorpe Station
-
Barton-On-Humber Station
- FAQ
- Price Paid By Year
- Property Type Price
Frequently asked questions about Broughton And Appleby
What is the average price for a property for sale in Broughton And Appleby?
The average price for a property for sale in Broughton And Appleby is £188,572. This amount is 15% lower than the average price in Brigg. There are 788 property listings for sale in Broughton And Appleby.
What streets have the most expensive properties for sale in Broughton And Appleby?
The streets with the most expensive properties for sale in Broughton And Appleby are Broughton Cross Roads at an average of £925,000, Beck Lane at an average of £390,000 and Chancel Walk at an average of £350,000.
What streets have the most affordable properties for sale in Broughton And Appleby?
The streets with the most affordable properties for sale in Broughton And Appleby are Dixon Avenue at an average of £103,000, Trinity Court at an average of £109,000 and Waters Edge at an average of £116,444.
Which train stations are available in or near Broughton And Appleby?
Some of the train stations available in or near Broughton And Appleby are Brigg, Scunthorpe and Barnetby.
Property Price Paid in Broughton And Appleby by Year
The average sold property price by year was:
| Year | Average Sold Price | Price Change |
Sold Properties
|
|---|---|---|---|
| 2025 | £188,641 | -4% |
62 Properties |
| 2024 | £195,959 | 3% |
77 Properties |
| 2023 | £189,144 | 3% |
85 Properties |
| 2022 | £183,168 | -6% |
115 Properties |
| 2021 | £194,846 | 14% |
104 Properties |
| 2020 | £167,835 | 8% |
80 Properties |
| 2019 | £153,723 | -4% |
108 Properties |
| 2018 | £160,030 | 3% |
107 Properties |
| 2017 | £154,849 | 11% |
108 Properties |
| 2016 | £137,078 | -9% |
109 Properties |
| 2015 | £148,856 | 15% |
86 Properties |
| 2014 | £127,234 | 1% |
85 Properties |
| 2013 | £126,575 | -3% |
77 Properties |
| 2012 | £130,396 | 10% |
64 Properties |
| 2011 | £117,122 | -7% |
62 Properties |
| 2010 | £125,000 | 2% |
62 Properties |
| 2009 | £122,705 | -19% |
46 Properties |
| 2008 | £146,544 | 8% |
60 Properties |
| 2007 | £134,367 | - |
112 Properties |
| 2006 | £134,425 | 2% |
137 Properties |
| 2005 | £132,082 | 9% |
127 Properties |
| 2004 | £120,579 | 21% |
175 Properties |
| 2003 | £95,050 | 22% |
137 Properties |
| 2002 | £74,031 | 24% |
134 Properties |
| 2001 | £55,946 | -1% |
153 Properties |
| 2000 | £56,490 | 8% |
149 Properties |
| 1999 | £52,112 | 5% |
138 Properties |
| 1998 | £49,353 | -4% |
127 Properties |
| 1997 | £51,544 | 9% |
157 Properties |
| 1996 | £47,003 | -5% |
128 Properties |
| 1995 | £49,438 | - |
114 Properties |
Property Price per Property Type in Broughton And Appleby
Here you can find historic sold price data in order to help with your property search.
The average Property Paid Price for specific property types in the last three years are:
| Property Type | Average Sold Price | Sold Properties |
|---|---|---|
| Semi Detached House | £154,860.00 | 176 Semi Detached Houses |
| Detached House | £252,056.00 | 123 Detached Houses |
| Terraced House | £141,697.00 | 40 Terraced Houses |

