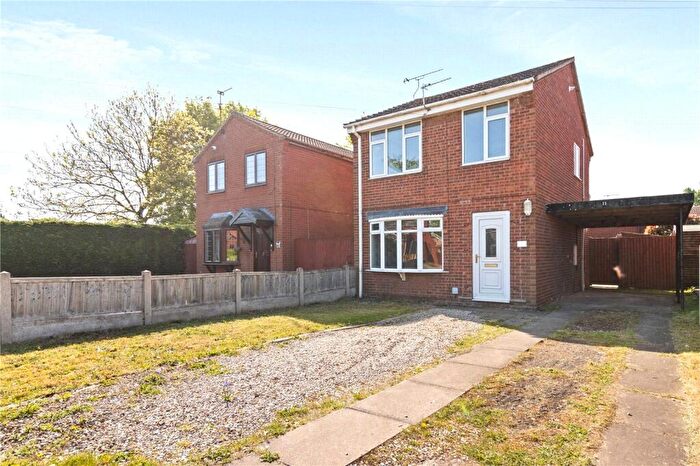
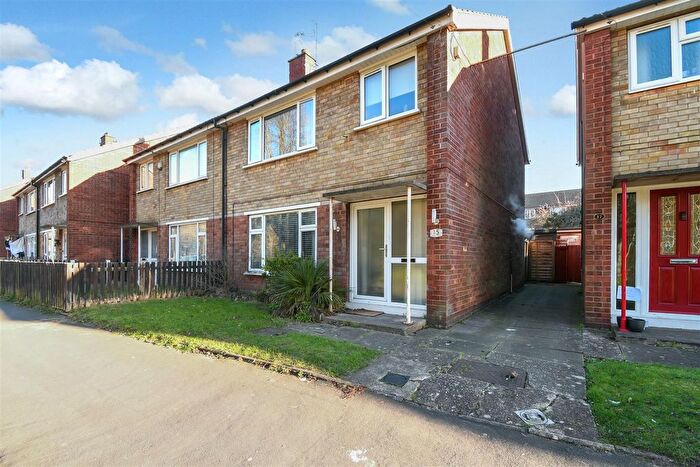
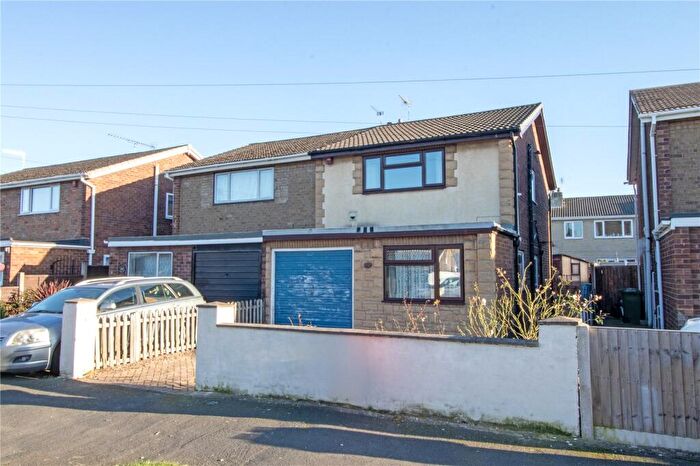
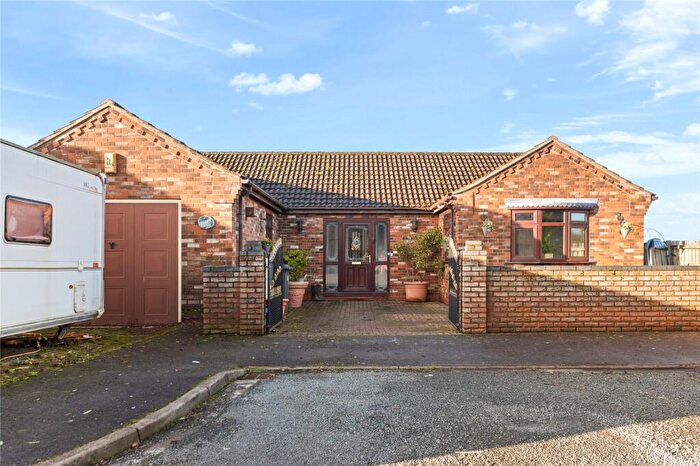
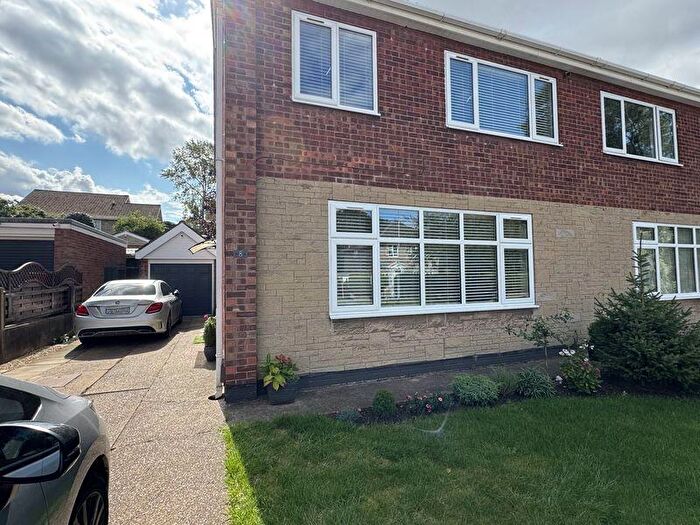
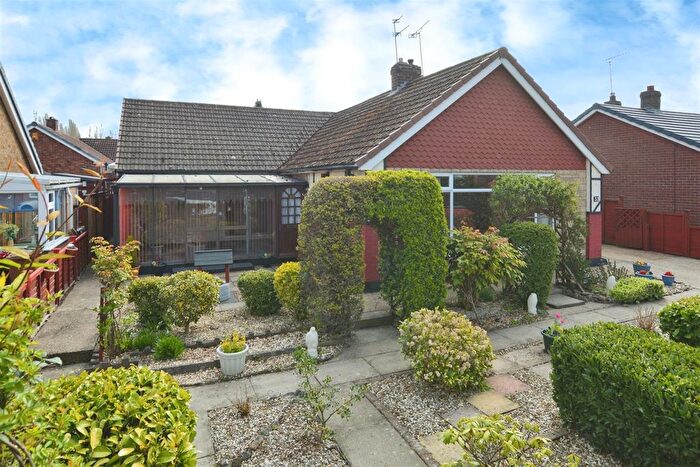
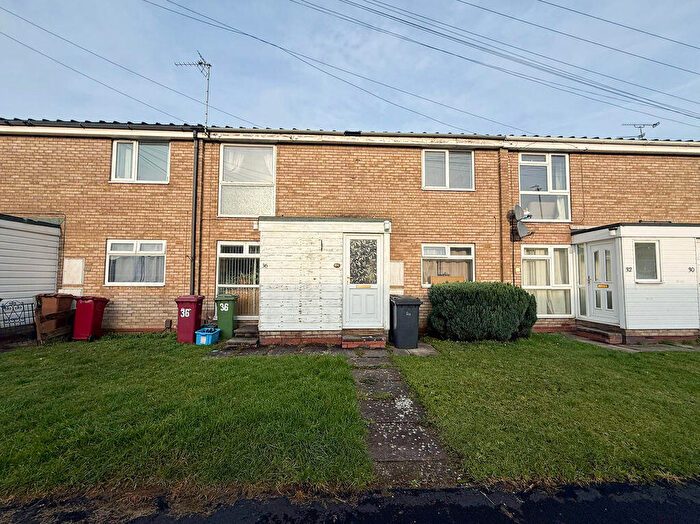
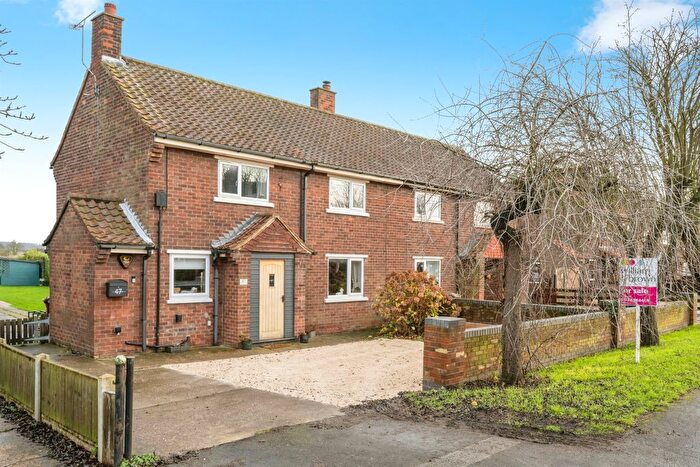
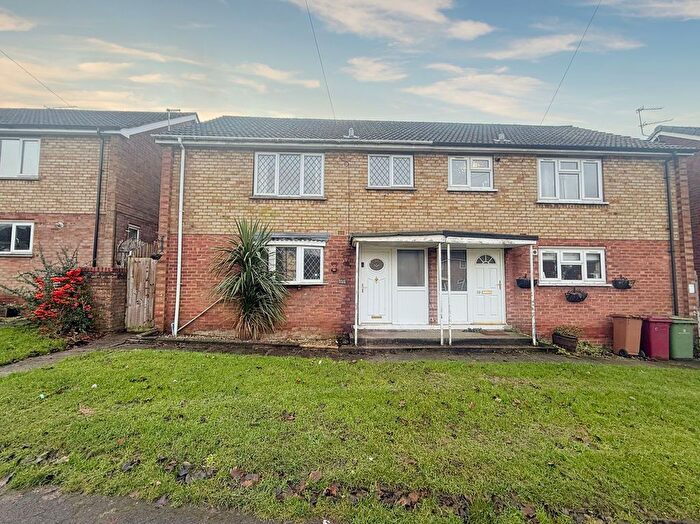
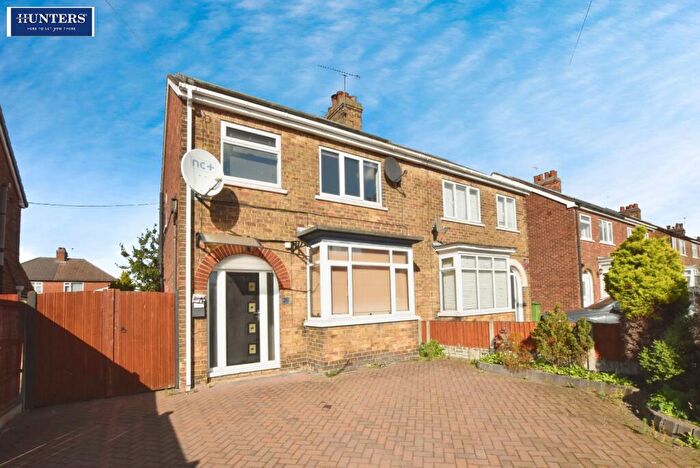
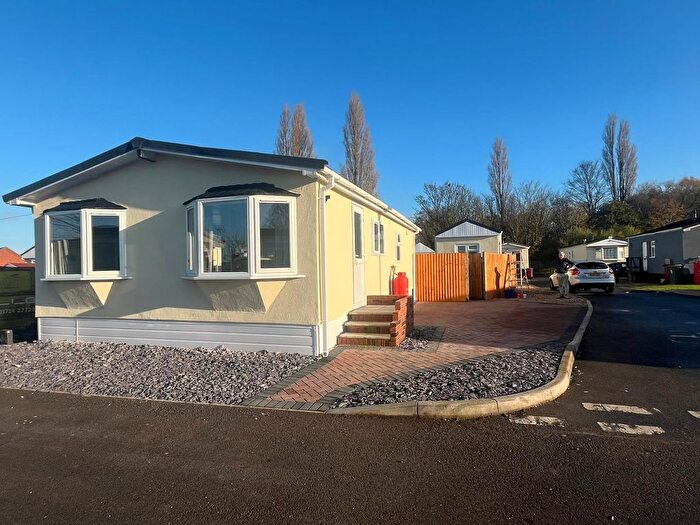
Houses for sale & to rent in Burringham And Gunness, Scunthorpe
House Prices in Burringham And Gunness
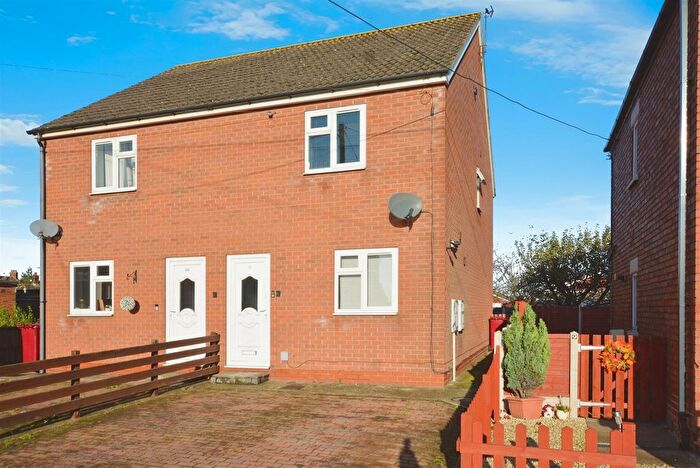
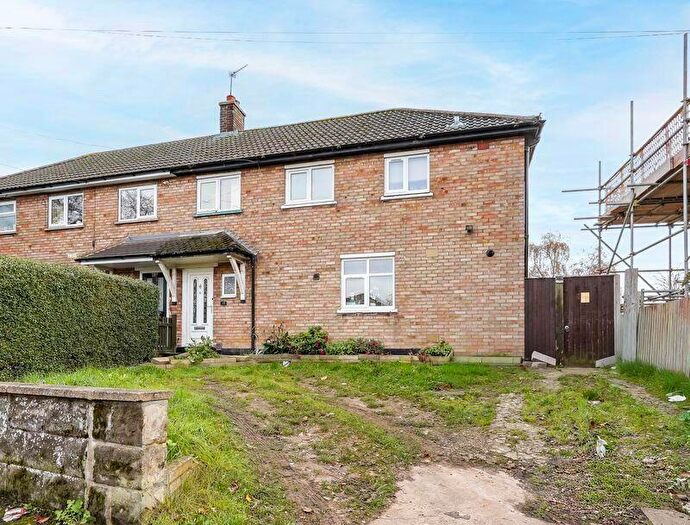
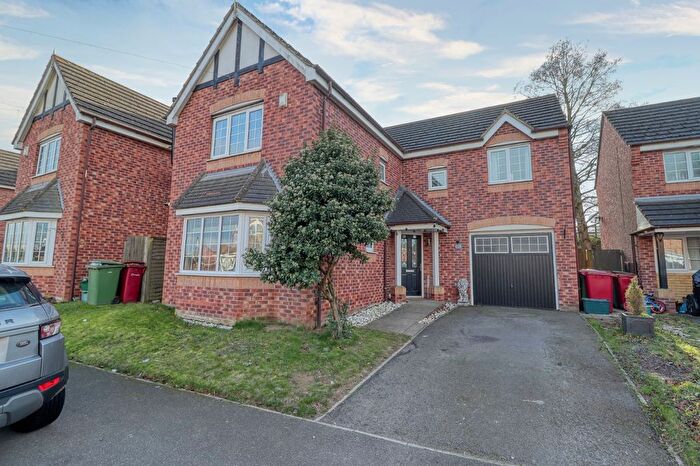
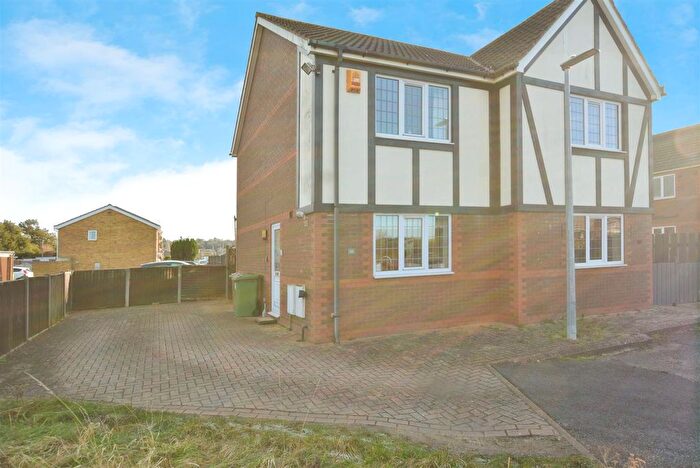
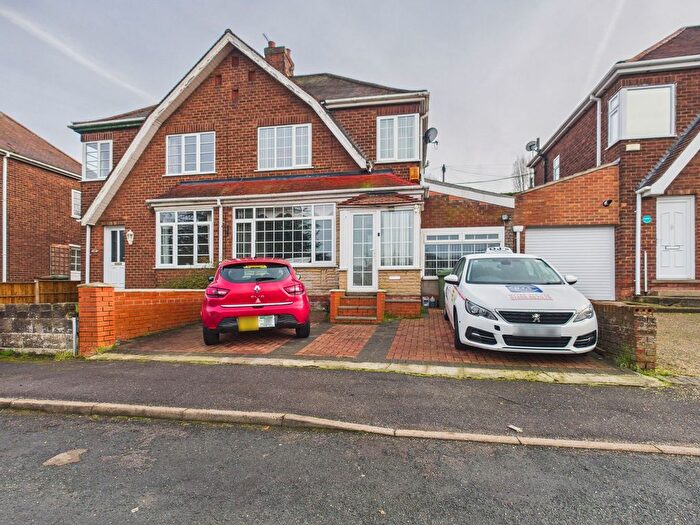
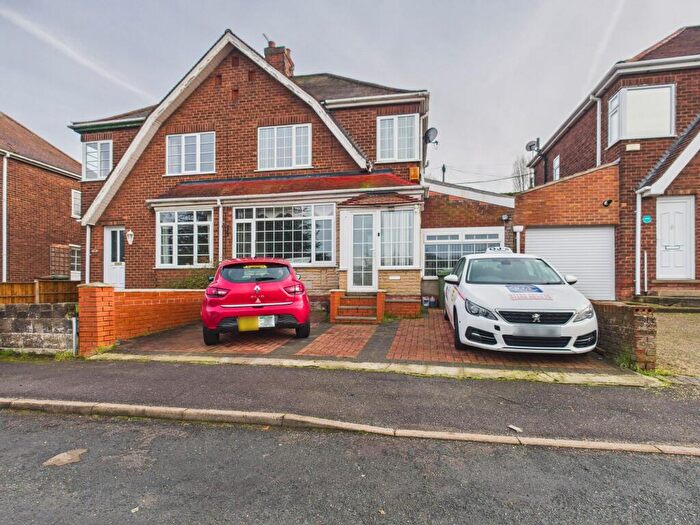
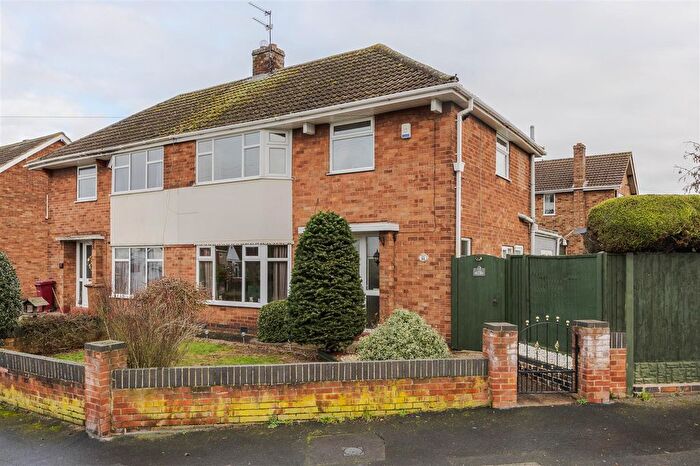
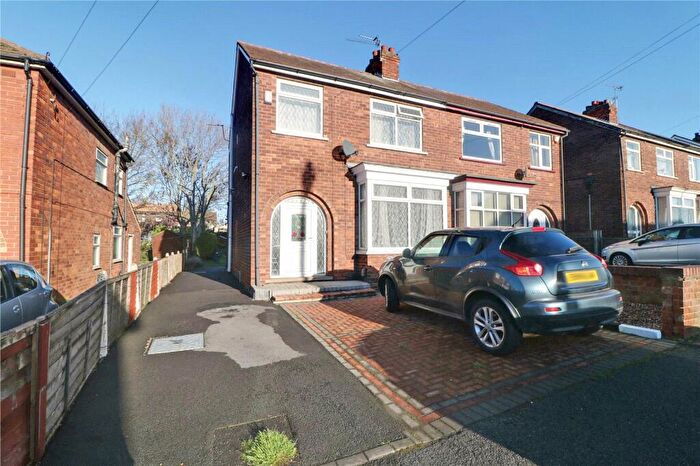
Properties in Burringham And Gunness have an average house price of £148,011.00 and had 179 Property Transactions within the last 3 years¹.
Burringham And Gunness is an area in Scunthorpe, North Lincolnshire with 1,841 households², where the most expensive property was sold for £695,000.00.
Properties for sale in Burringham And Gunness
Roads and Postcodes in Burringham And Gunness
Navigate through our locations to find the location of your next house in Burringham And Gunness, Scunthorpe for sale or to rent.
| Streets | Postcodes |
|---|---|
| Alfreton Court | DN15 7UY |
| Ashbourne Court | DN15 7EX |
| Ashfield Park | DN17 2AL |
| Bakewell Court | DN15 7UA |
| Baslow Road | DN15 7UU |
| Beech Avenue | DN15 8TL |
| Belper Court | DN15 7UR |
| Bolsover Road | DN15 7UZ |
| Brumby Common Lane | DN17 1US |
| Burringham Road | DN17 2AA DN17 3LT DN17 2AB |
| Buxton Court | DN15 7UF |
| Campbells Farm Avenue | DN15 8SS |
| Carr Dyke Road | DN17 3AA DN17 3AB |
| Castleton Road | DN15 7UX |
| Chesterfield Road | DN15 7UP |
| Claire's Walk | DN17 1SW |
| Deacon Drive | DN15 7EY |
| Derby Road | DN15 7UN |
| Doncaster Road | DN15 8TF DN15 8TG DN15 8TD DN15 8TE |
| Dronfield Court | DN15 7EU |
| Eastwood Court | DN15 7UT |
| Edgemere | DN15 7ES DN15 7ET |
| Farm Close | DN15 8SR |
| Fifth Avenue | DN17 1TA |
| Fillingham Crescent | DN15 8BL |
| First Avenue | DN17 1SX DN17 2AS |
| Fourth Avenue | DN17 1TB |
| Gallagher Retail Park | DN15 8GR |
| Glanford Way | DN15 8XL |
| Glovers Avenue | DN17 3NL |
| Grassmoor Court | DN15 7UW |
| Hadleigh Green | DN17 3NJ |
| Hathersage Court | DN15 7UQ |
| Heanor Court | DN15 7UE |
| High Street | DN17 3LY DN17 3NA DN17 3NE DN17 3NQ |
| Hilton Avenue | DN15 8BB DN15 8BD DN15 8BE DN15 8BG |
| Ilkeston Court | DN15 7UB |
| Kelsey Avenue | DN15 8BW |
| Kensington Road | DN15 8BQ |
| Kerries Walk | DN17 1SQ |
| Laburnum Avenue | DN15 8TN |
| Lagoon Road | DN17 1SY |
| Main Avenue | DN17 2AN DN17 2AW |
| Mansfield Road | DN15 7UG |
| Masons Close | DN15 8WA |
| Matlock Court | DN15 7UL |
| Neap House Road | DN15 8TS DN15 8TT DN15 8TU DN15 8TY |
| New Road | DN17 2AR |
| North Grange Cottages | DN17 2AD |
| North Lincolnshire Shopping Park | DN15 8JH |
| Old Village Street | DN15 8TJ DN15 8TP DN15 8TW |
| Orchard Close | DN17 3UT |
| Park Grove | DN17 2FB |
| Pasture Avenue | DN17 3NF |
| Paul's Walk | DN17 1WF |
| Ripley Court | DN15 7UJ |
| Sarah's Walk | DN17 1RA |
| Scotter Road | DN17 1SU |
| Second Avenue | DN17 1TE |
| Sixth Avenue | DN17 1SZ |
| South View Avenue | DN17 3NG |
| St Johns Close | DN17 3LP |
| Station Road | DN15 8SU DN15 8TH DN15 8TQ DN17 3LU DN15 8SX DN15 8TR |
| Stone Lane | DN17 3NB |
| Tansley Court | DN15 7UD |
| The Meadows | DN17 3LW |
| Third Avenue | DN17 1TD |
| Tideswell Court | DN15 7UH |
| Trent View | DN17 3LZ |
| Trentside Trailer Park | DN17 3LX |
| Wares Way | DN15 8DU |
| Warping Way | DN15 8BJ |
| Westburn Way | DN15 8FB |
| Westfield Road | DN17 2AP |
| Wharfdale Close | DN15 8SW |
| Woodside Drive | DN17 2EA |
| Yarborough Court | DN15 7US |
| DN17 3ND DN17 3NH DN15 8SY DN15 8UA |
Transport near Burringham And Gunness
- FAQ
- Price Paid By Year
- Property Type Price
Frequently asked questions about Burringham And Gunness
What is the average price for a property for sale in Burringham And Gunness?
The average price for a property for sale in Burringham And Gunness is £148,011. This amount is 11% lower than the average price in Scunthorpe. There are 1,531 property listings for sale in Burringham And Gunness.
What streets have the most expensive properties for sale in Burringham And Gunness?
The streets with the most expensive properties for sale in Burringham And Gunness are Burringham Road at an average of £330,000, Neap House Road at an average of £201,400 and High Street at an average of £199,681.
What streets have the most affordable properties for sale in Burringham And Gunness?
The streets with the most affordable properties for sale in Burringham And Gunness are Trent View at an average of £83,500, Kensington Road at an average of £94,700 and Edgemere at an average of £95,375.
Which train stations are available in or near Burringham And Gunness?
Some of the train stations available in or near Burringham And Gunness are Althorpe, Scunthorpe and Crowle.
Property Price Paid in Burringham And Gunness by Year
The average sold property price by year was:
| Year | Average Sold Price | Price Change |
Sold Properties
|
|---|---|---|---|
| 2025 | £139,700 | -1% |
25 Properties |
| 2024 | £141,261 | -4% |
40 Properties |
| 2023 | £147,512 | -5% |
40 Properties |
| 2022 | £154,738 | 3% |
74 Properties |
| 2021 | £150,010 | 21% |
52 Properties |
| 2020 | £118,873 | 8% |
39 Properties |
| 2019 | £109,844 | -22% |
54 Properties |
| 2018 | £133,644 | 13% |
82 Properties |
| 2017 | £116,704 | 15% |
84 Properties |
| 2016 | £99,237 | -6% |
36 Properties |
| 2015 | £105,576 | 13% |
52 Properties |
| 2014 | £91,852 | -7% |
45 Properties |
| 2013 | £97,937 | -4% |
25 Properties |
| 2012 | £102,207 | 9% |
32 Properties |
| 2011 | £93,451 | -25% |
29 Properties |
| 2010 | £116,511 | 5% |
21 Properties |
| 2009 | £111,126 | -2% |
21 Properties |
| 2008 | £113,660 | 6% |
37 Properties |
| 2007 | £107,232 | 10% |
69 Properties |
| 2006 | £96,790 | 4% |
74 Properties |
| 2005 | £93,284 | 7% |
42 Properties |
| 2004 | £87,219 | 25% |
84 Properties |
| 2003 | £65,292 | 27% |
101 Properties |
| 2002 | £47,355 | 10% |
100 Properties |
| 2001 | £42,738 | -1% |
84 Properties |
| 2000 | £43,303 | -2% |
84 Properties |
| 1999 | £44,220 | 7% |
75 Properties |
| 1998 | £41,063 | 12% |
63 Properties |
| 1997 | £36,062 | -15% |
76 Properties |
| 1996 | £41,400 | 10% |
54 Properties |
| 1995 | £37,311 | - |
43 Properties |
Property Price per Property Type in Burringham And Gunness
Here you can find historic sold price data in order to help with your property search.
The average Property Paid Price for specific property types in the last three years are:
| Property Type | Average Sold Price | Sold Properties |
|---|---|---|
| Semi Detached House | £141,164.00 | 80 Semi Detached Houses |
| Detached House | £228,035.00 | 41 Detached Houses |
| Terraced House | £107,925.00 | 49 Terraced Houses |
| Flat | £62,574.00 | 9 Flats |

