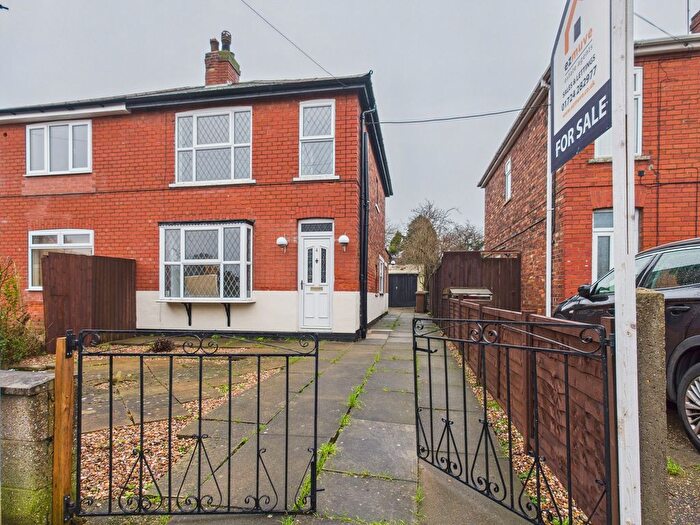
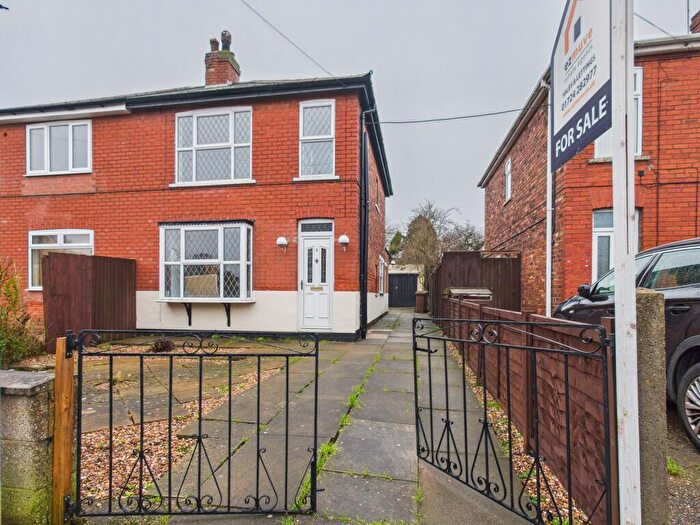
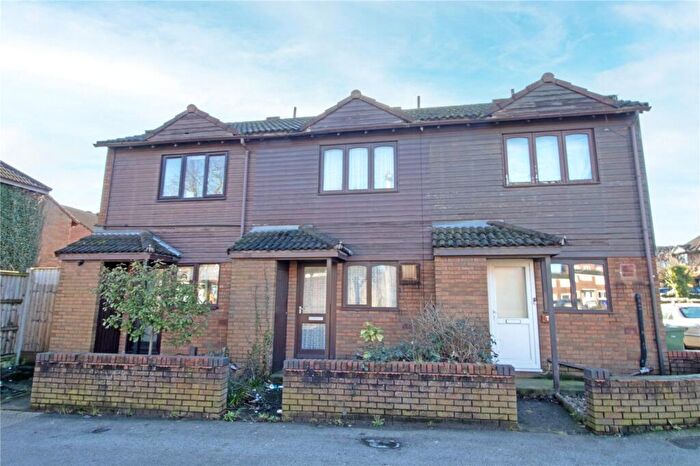
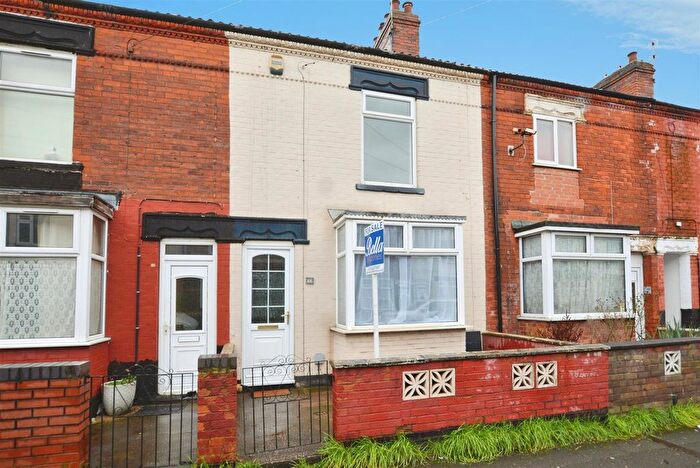
Houses for sale & to rent in Frodingham, Scunthorpe
House Prices in Frodingham
Properties in Frodingham have an average house price of £121,405.00 and had 267 Property Transactions within the last 3 years¹.
Frodingham is an area in Scunthorpe, North Lincolnshire with 3,451 households², where the most expensive property was sold for £315,000.00.
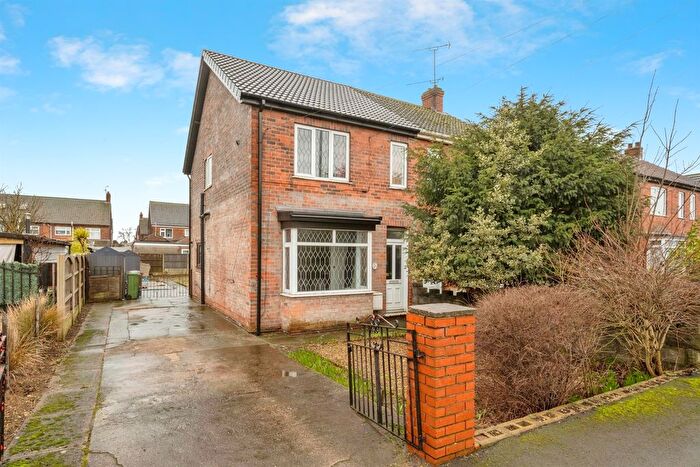
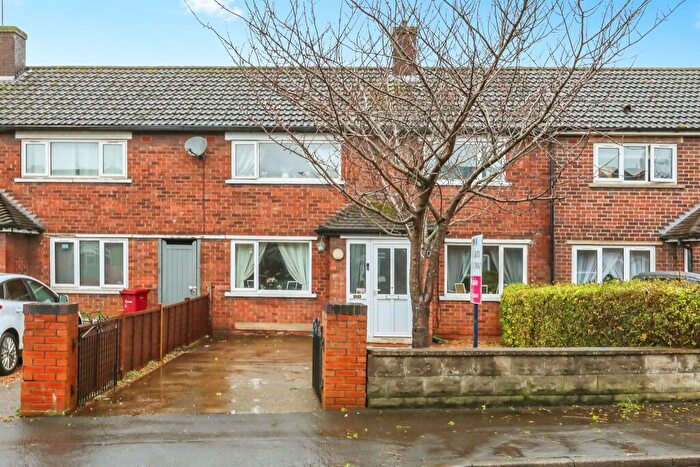
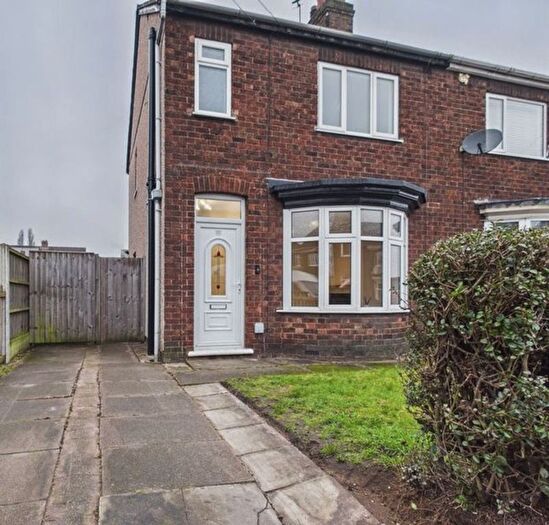
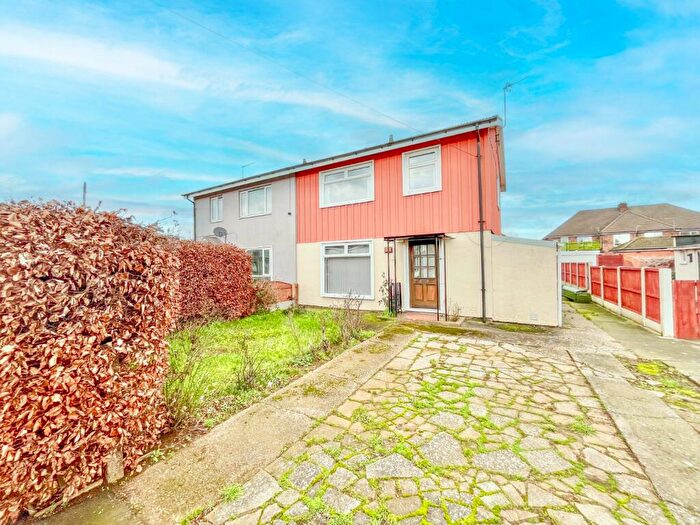
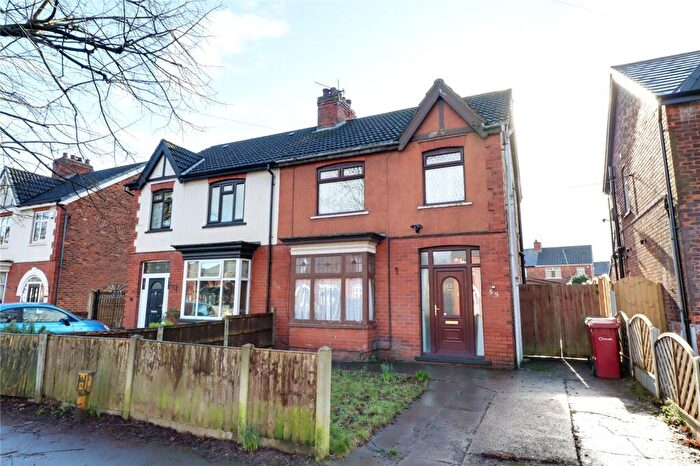
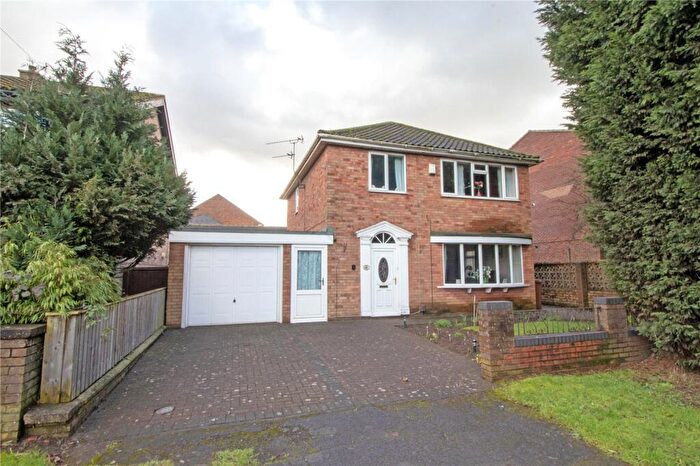
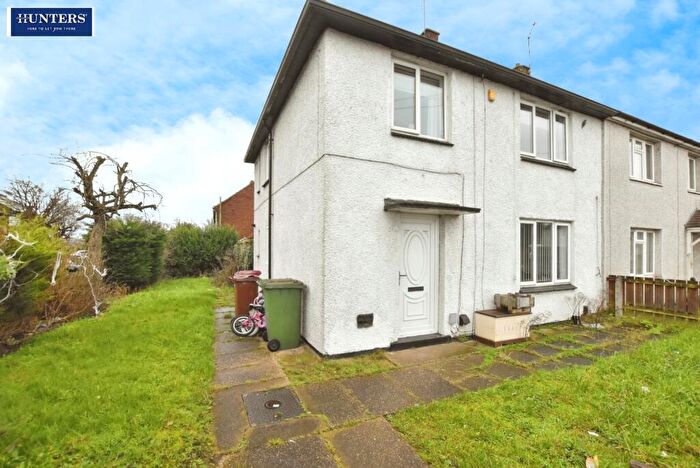
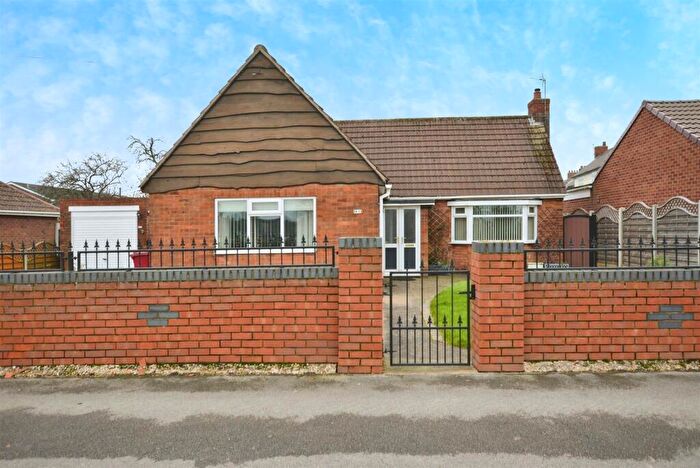
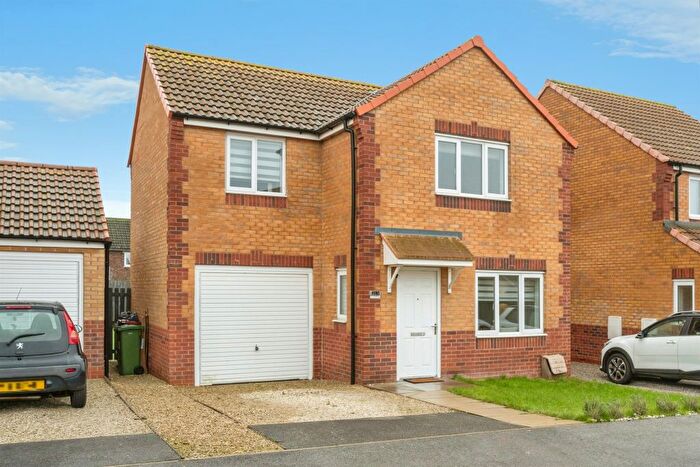
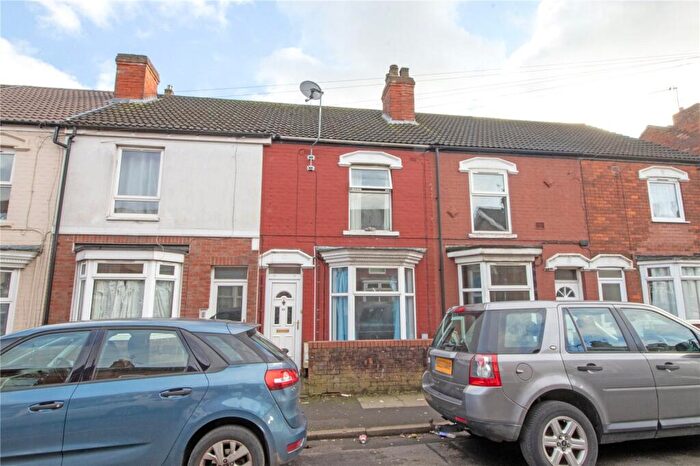
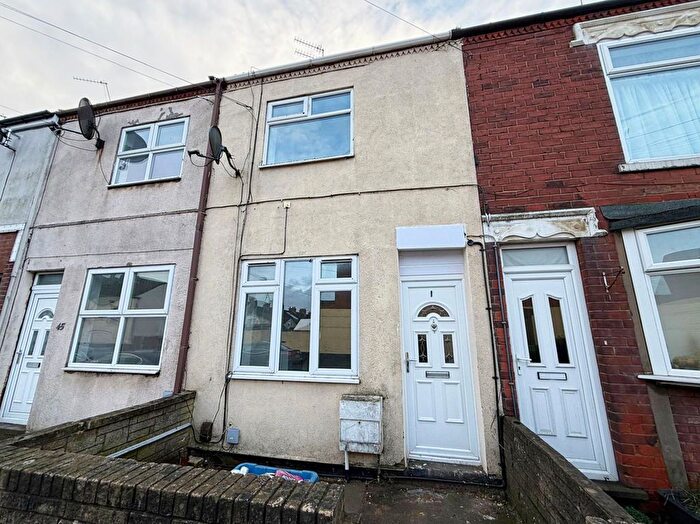
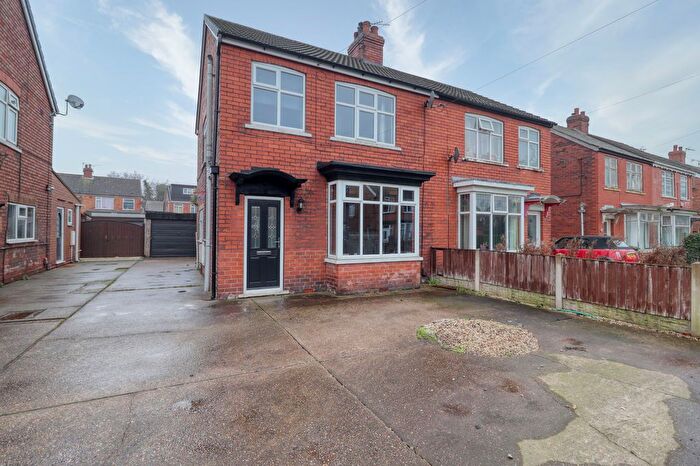
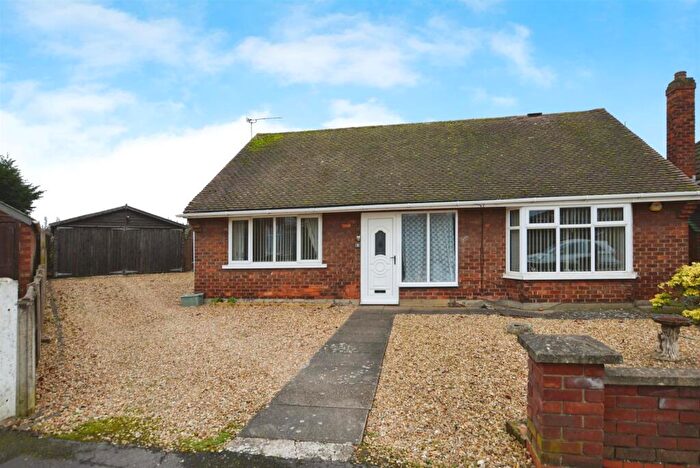
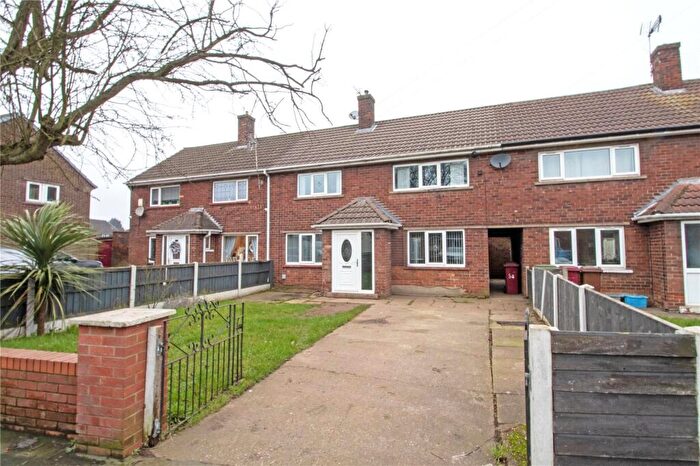
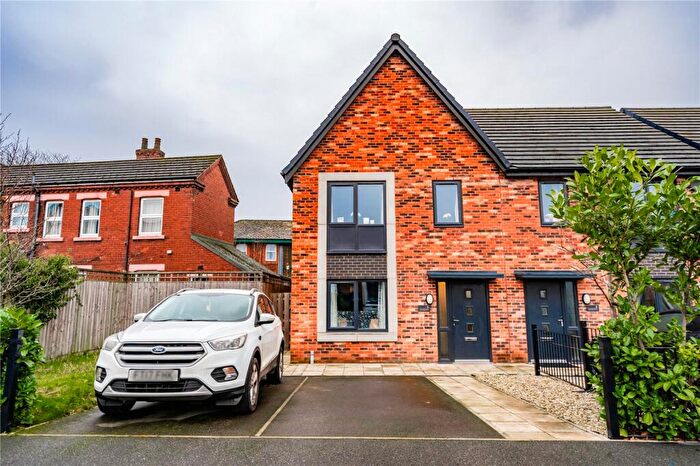
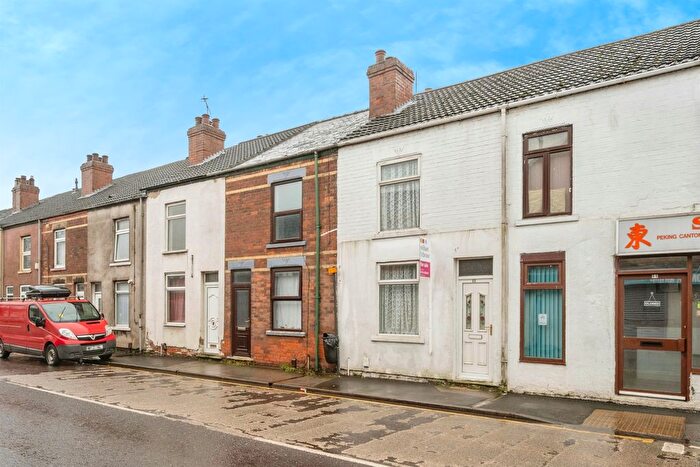
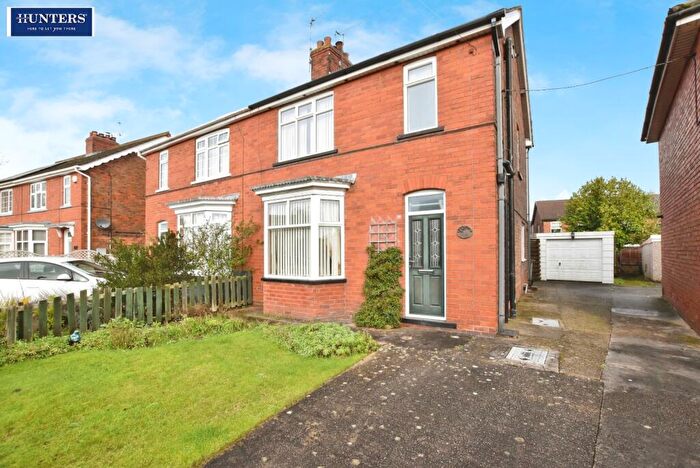
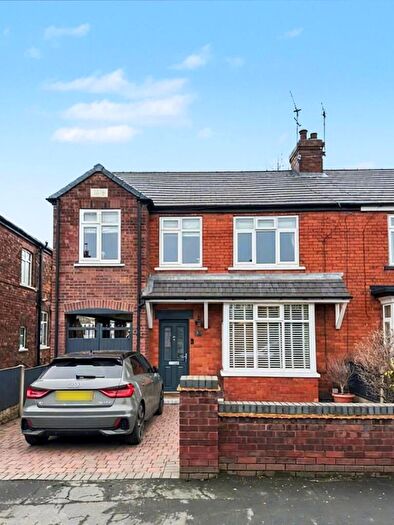
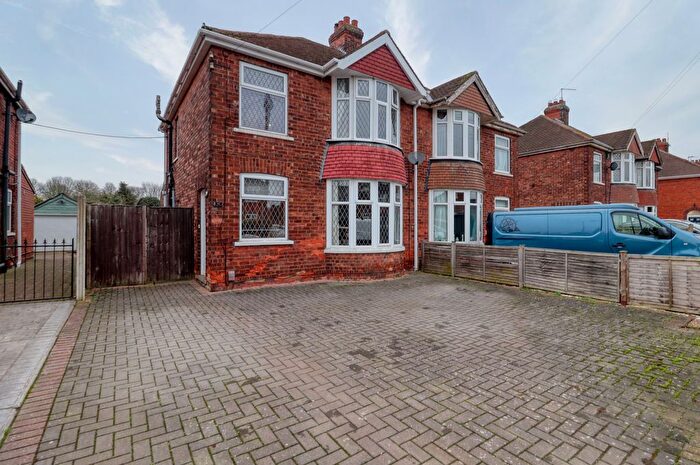
Properties for sale in Frodingham
Roads and Postcodes in Frodingham
Navigate through our locations to find the location of your next house in Frodingham, Scunthorpe for sale or to rent.
| Streets | Postcodes |
|---|---|
| Abercorn Street | DN16 1LD |
| Albion Park | DN16 1DJ |
| Amos Crescent | DN16 1RA |
| Anderson Road | DN16 1PU |
| Arkwright Way | DN16 1AL |
| Ashby Road | DN16 1NR |
| Avon Road | DN16 1EP |
| Banbury Road | DN16 1UL |
| Beauchamp Street | DN16 1EG |
| Beauchamp Walk | DN16 1HD |
| Bedford Park | DN16 1UN |
| Bennett Road | DN16 1PJ |
| Brigg Road | DN16 1AX DN16 3RL DN16 1AP DN16 1AR DN16 1AW DN16 1BB DN16 1XA DN16 1XJ |
| Burghley Road | DN16 1JD |
| Bushfield Road | DN16 1NA DN16 1NB DN16 1ND |
| Cemetery Road | DN16 1DY DN16 1EA DN16 1EB DN16 1NT DN16 1NU |
| Cliff Street | DN16 1TW |
| Colin Road | DN16 1TT |
| Corby Road | DN16 1TZ |
| Cottage Beck Road | DN16 1DX DN16 1LA DN16 1LE DN16 1LG DN16 1LQ DN16 1TR DN16 1UA DN16 1UB DN16 1UE DN16 1TS DN16 1TY DN16 1UD |
| Cromwell Avenue | DN16 1EF |
| Cuxwold Road | DN16 1HR |
| Dawes Lane | DN16 1DN DN16 1XH |
| Dudley Road | DN16 1BA |
| Dunlop Way | DN16 3RN |
| Earl Street | DN16 1EE |
| Earls Walk | DN16 1HB |
| East Common Lane | DN16 1HJ DN16 1HL DN16 1NY DN16 1PA DN16 1QF DN16 1QG DN16 1QH DN16 1QQ DN16 1AZ DN16 1DA DN16 1DD DN16 1DE |
| Eastgate Park | DN16 1AE |
| Exton Court | DN16 1AG |
| Fairmont Crescent | DN16 1EJ DN16 1EL |
| Fardell Road | DN16 1QT DN16 1QZ |
| Fowler Road | DN16 1PH |
| Furnace Square | DN16 1BL |
| Gladstone Drive | DN16 1ET |
| Grange Lane North | DN16 1RG DN16 1BN DN16 1BT DN16 1BZ DN16 1DP DN16 1RQ |
| Haig Avenue | DN16 1DZ |
| Hallgarth Avenue | DN16 1UG |
| Hampton Road | DN16 1QJ |
| Healey Road | DN16 1HS DN16 1HT DN16 1HW DN16 1HY DN16 1HU |
| Holgate Road | DN16 1JA DN16 1JB |
| Horners Row | DN16 1UP |
| Ivanhoe Road | DN16 1JJ |
| Jellicoe Court | DN16 1HA |
| Karen Court | DN16 1BF |
| Kendale Road | DN16 1DT |
| Kenilworth Road | DN16 1EX DN16 1EY |
| Kettering Road | DN16 1UW |
| King Edward Street | DN16 1LH DN16 1LZ |
| Leamington Close | DN16 1JR |
| Leamington Court | DN16 1JP |
| Lilac Avenue | DN16 1JG DN16 1JL DN16 1JN DN16 1JQ |
| Lindsey Street | DN16 1TD |
| Lydbrook Road | DN16 1LP DN16 1LX DN16 1LY |
| Lygon Street | DN16 1EQ |
| Maple Tree Close East | DN16 1LS |
| Maple Tree Close West | DN16 1LU |
| Maple Tree Way | DN16 1LN DN16 1LR DN16 1LT |
| Marlborough Drive | DN16 1PB |
| Marmion Road | DN16 1PQ |
| Menasha Way | DN16 3RT |
| Mere Crescent | DN16 1QU |
| Midland Road | DN16 1DQ |
| Mill Croft | DN16 1QL |
| Montrose Street | DN16 1LF |
| Neath Road | DN16 1LW |
| Neville Road | DN16 1TN DN16 1TU |
| Northampton Road | DN16 1UJ |
| Nostell Road | DN16 1DL |
| Percy Street | DN16 1UQ |
| Pinchbeck Avenue | DN16 1TH |
| Plum Tree Way | DN16 1LJ DN16 1LL |
| Pryme Road | DN16 1HZ |
| Queen Street | DN16 1TG |
| Queens View Crescent | DN16 1QN |
| Queensway | DN16 2HZ DN16 2JA DN16 2JG DN16 2JQ DN16 1BH DN16 2BU DN16 2BX DN16 2BY DN16 2HY |
| Queensway Court Business Park | DN16 1AD |
| Radcliffe Court | DN16 1JW |
| Redbourn Close | DN16 1NF |
| Redbourn Way | DN16 1NE DN16 1NG DN16 1NQ |
| Redbourne Street | DN16 1TF |
| Rowland Road | DN16 1SP DN16 1SR DN16 1ST DN16 1SX DN16 1TA DN16 1TE DN16 1TJ DN16 1TQ DN16 1SU DN16 1TL |
| Rowmills Road | DN16 1HP |
| Rutland Road | DN16 1HX |
| Sanderson Close | DN16 1NH |
| Sandhouse Crescent | DN16 1JE DN16 1JF |
| Santon Business Park | DN16 1XP |
| Shirley Crescent | DN16 1NX |
| St Botolphs Road | DN16 1PS DN16 1PT |
| St Chads Road | DN16 1RF |
| St Hughs Crescent | DN16 1PY |
| St Lawrence Place | DN16 1RD |
| St Lawrences Road | DN16 1RB DN16 1RE |
| St Michaels Crescent | DN16 1QA |
| Stratford Drive | DN16 1ER |
| Talbot Walk | DN16 1HE |
| Tetley Road | DN16 1PN |
| The Close | DN16 1DU |
| The Crofts | DN16 1SY |
| Trent Street | DN16 1UF |
| Trinity Park | DN16 1BG |
| Warley Avenue | DN16 1QE |
| Warley Drive | DN16 1QB |
| Warley Road | DN16 1PL DN16 1PR DN16 1PW DN16 1PX DN16 1PZ DN16 1QD DN16 1QX DN16 1QY DN16 1PP |
| Warwick Road | DN16 1ES DN16 1EU DN16 1EW DN16 1EZ DN16 1HH |
| William Street | DN16 1SZ |
| Winn Street | DN16 1TB |
| Woodhouse Road | DN16 1BD |
| Woodstock Road | DN16 1JH |
| Wortley Street | DN16 1LB |
| DN15 0DQ DN16 1ED |
Transport near Frodingham
-
Scunthorpe Station
-
Althorpe Station
-
Brigg Station
-
Kirton Lindsey Station
-
Crowle Station
-
Barnetby Station
- FAQ
- Price Paid By Year
- Property Type Price
Frequently asked questions about Frodingham
What is the average price for a property for sale in Frodingham?
The average price for a property for sale in Frodingham is £121,405. This amount is 27% lower than the average price in Scunthorpe. There are 2,897 property listings for sale in Frodingham.
What streets have the most expensive properties for sale in Frodingham?
The streets with the most expensive properties for sale in Frodingham are Ashby Road at an average of £212,350, Marlborough Drive at an average of £185,000 and Marmion Road at an average of £180,666.
What streets have the most affordable properties for sale in Frodingham?
The streets with the most affordable properties for sale in Frodingham are Queen Street at an average of £61,500, Redbourne Street at an average of £67,924 and Beauchamp Street at an average of £69,950.
Which train stations are available in or near Frodingham?
Some of the train stations available in or near Frodingham are Scunthorpe, Althorpe and Brigg.
Property Price Paid in Frodingham by Year
The average sold property price by year was:
| Year | Average Sold Price | Price Change |
Sold Properties
|
|---|---|---|---|
| 2025 | £122,678 | 1% |
95 Properties |
| 2024 | £121,386 | 1% |
86 Properties |
| 2023 | £120,017 | -11% |
86 Properties |
| 2022 | £132,952 | 18% |
111 Properties |
| 2021 | £109,158 | 12% |
101 Properties |
| 2020 | £95,651 | 0,2% |
85 Properties |
| 2019 | £95,484 | -1% |
83 Properties |
| 2018 | £96,312 | -4% |
93 Properties |
| 2017 | £100,455 | 16% |
99 Properties |
| 2016 | £84,573 | 3% |
96 Properties |
| 2015 | £82,188 | 14% |
73 Properties |
| 2014 | £70,819 | -13% |
63 Properties |
| 2013 | £80,028 | -1% |
63 Properties |
| 2012 | £80,461 | 6% |
48 Properties |
| 2011 | £75,697 | -14% |
47 Properties |
| 2010 | £86,300 | -1% |
43 Properties |
| 2009 | £86,935 | -7% |
54 Properties |
| 2008 | £93,249 | 3% |
65 Properties |
| 2007 | £90,457 | 3% |
128 Properties |
| 2006 | £87,876 | 10% |
112 Properties |
| 2005 | £79,404 | 11% |
100 Properties |
| 2004 | £70,941 | 24% |
149 Properties |
| 2003 | £54,257 | 24% |
179 Properties |
| 2002 | £41,252 | 9% |
187 Properties |
| 2001 | £37,505 | 6% |
133 Properties |
| 2000 | £35,331 | 3% |
128 Properties |
| 1999 | £34,137 | -0,4% |
106 Properties |
| 1998 | £34,287 | 4% |
78 Properties |
| 1997 | £32,951 | 5% |
88 Properties |
| 1996 | £31,255 | -7% |
94 Properties |
| 1995 | £33,414 | - |
78 Properties |
Property Price per Property Type in Frodingham
Here you can find historic sold price data in order to help with your property search.
The average Property Paid Price for specific property types in the last three years are:
| Property Type | Average Sold Price | Sold Properties |
|---|---|---|
| Flat | £54,000.00 | 2 Flats |
| Semi Detached House | £126,735.00 | 183 Semi Detached Houses |
| Detached House | £172,441.00 | 17 Detached Houses |
| Terraced House | £95,123.00 | 65 Terraced Houses |

