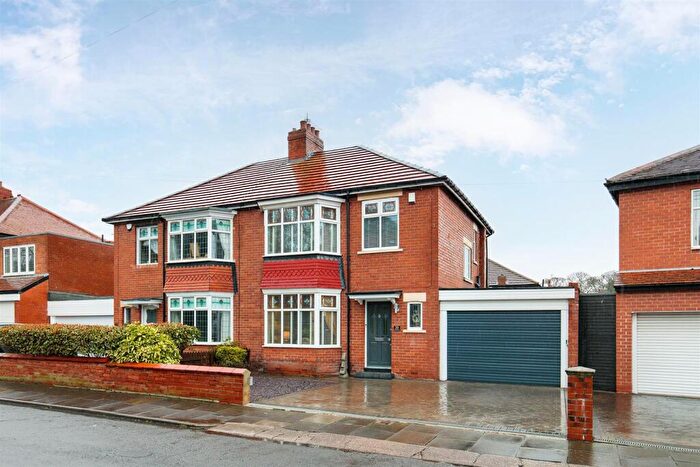
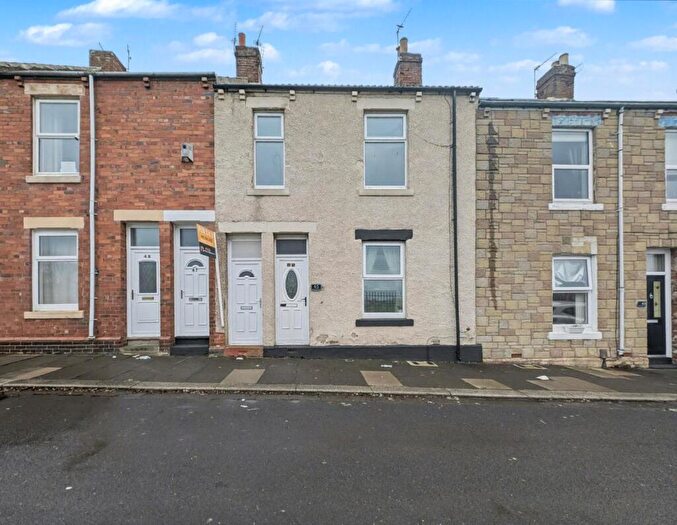
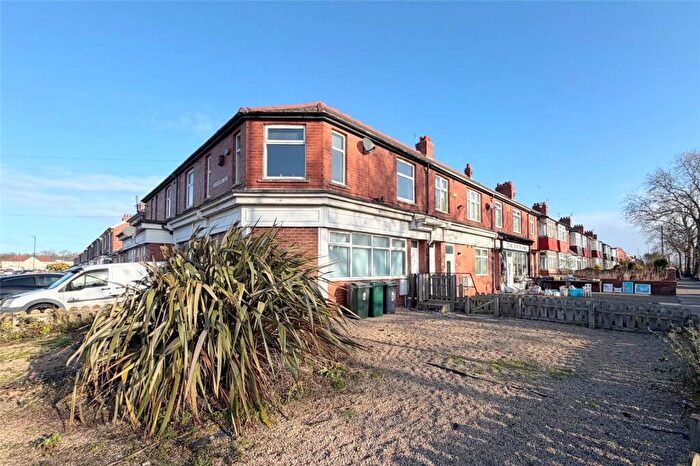
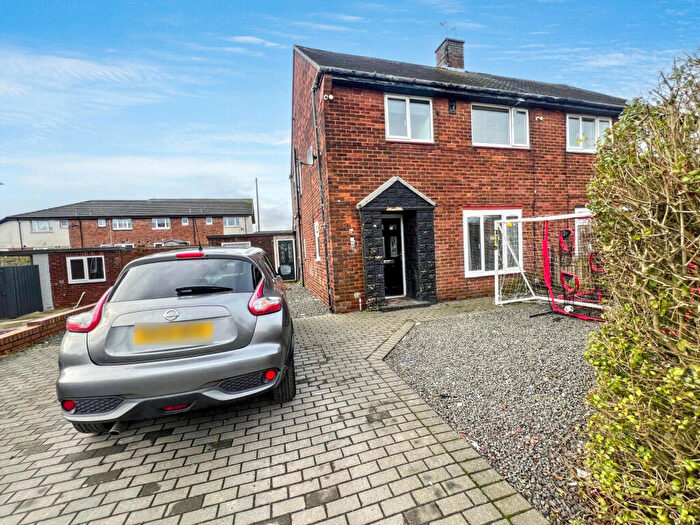
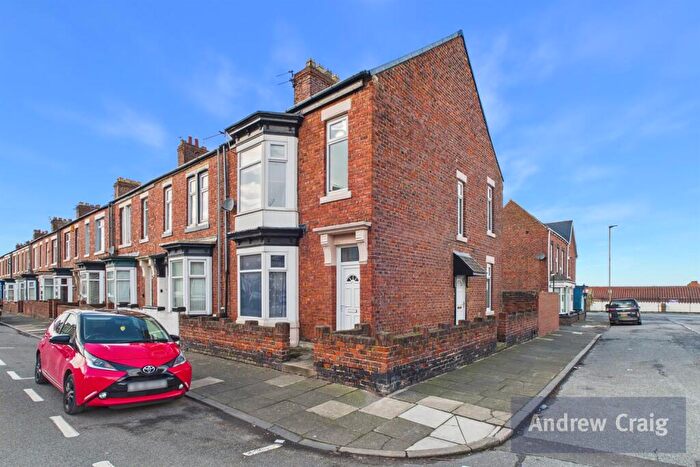
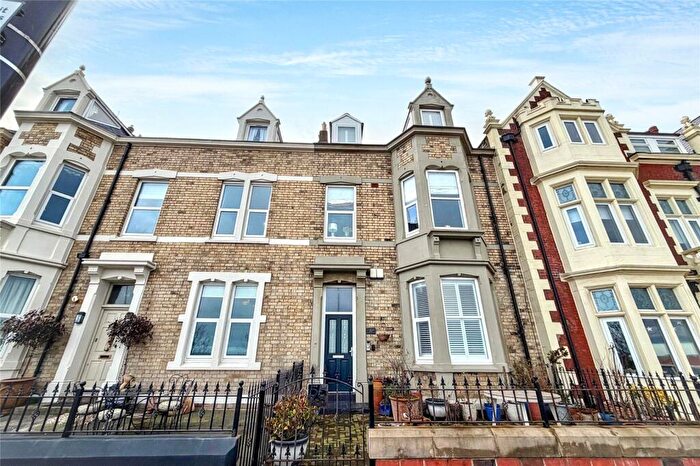
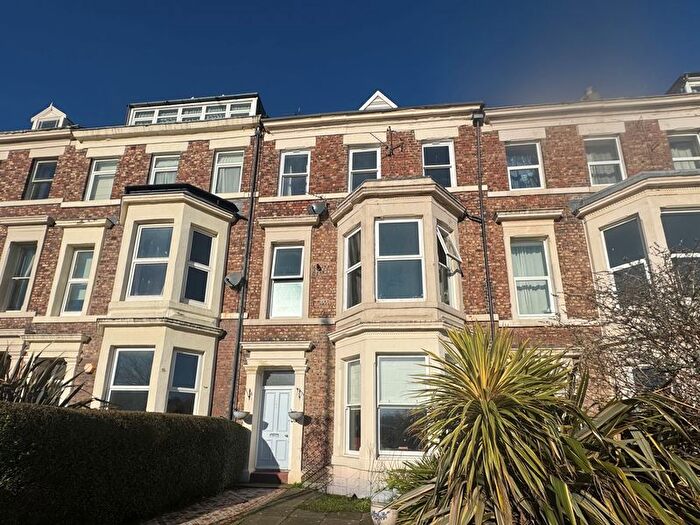
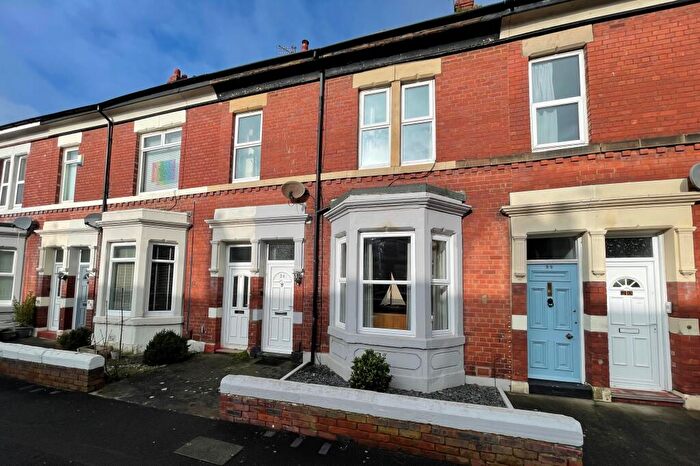
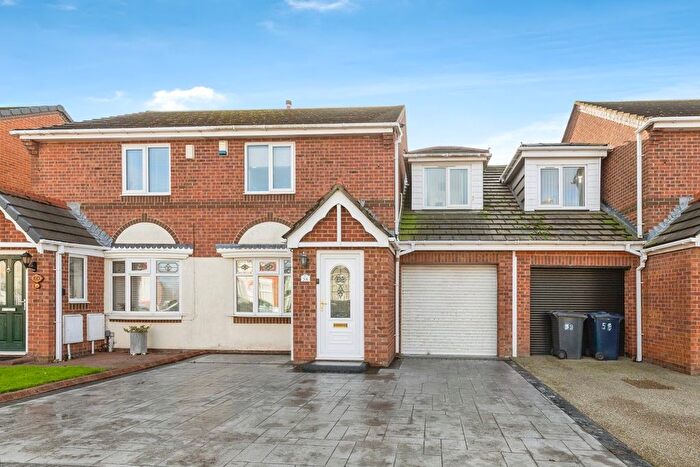
Houses for sale & to rent in North Shields, North Tyneside
House Prices in North Shields
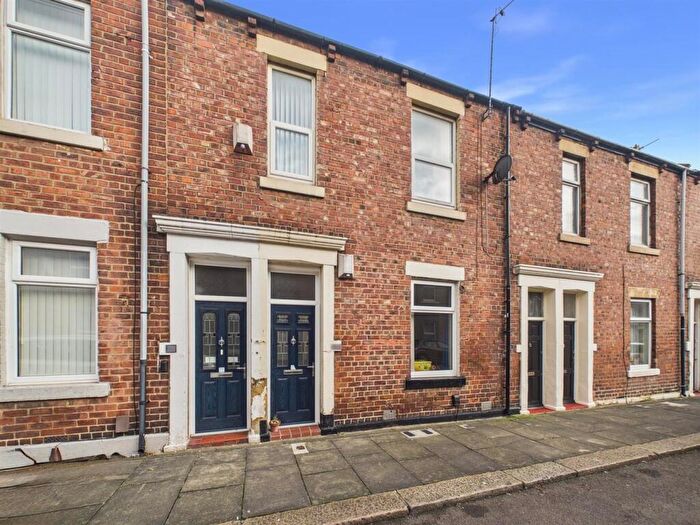
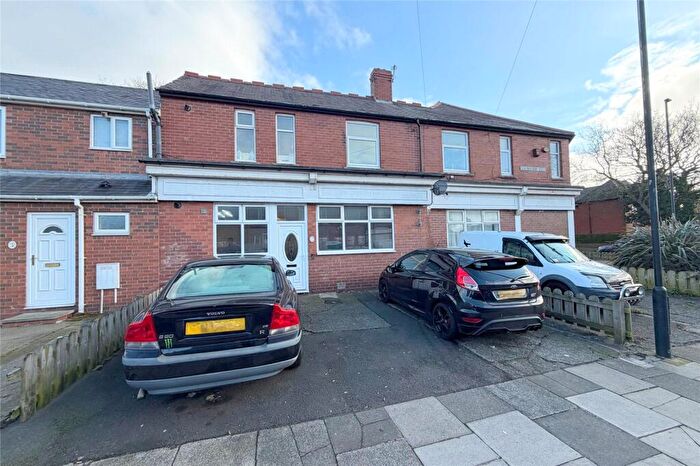
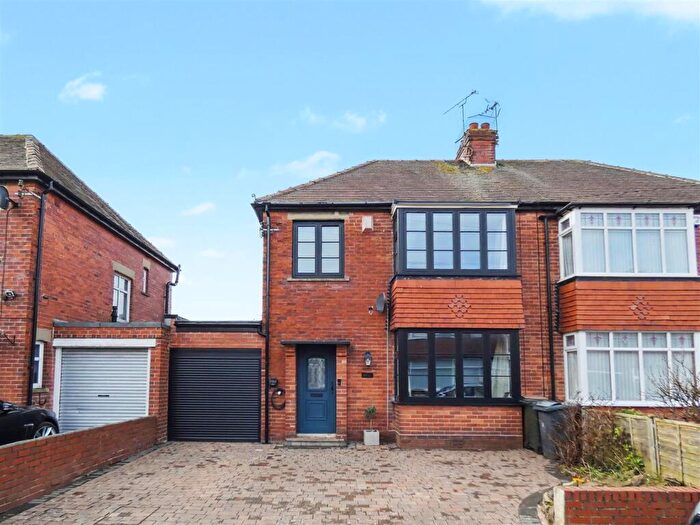
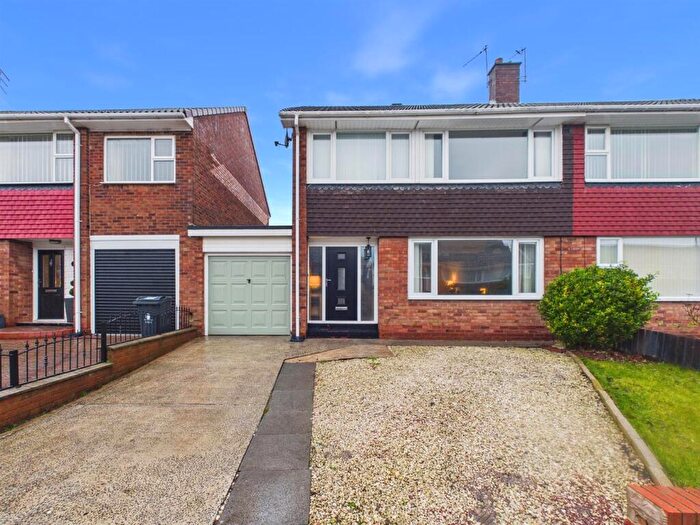
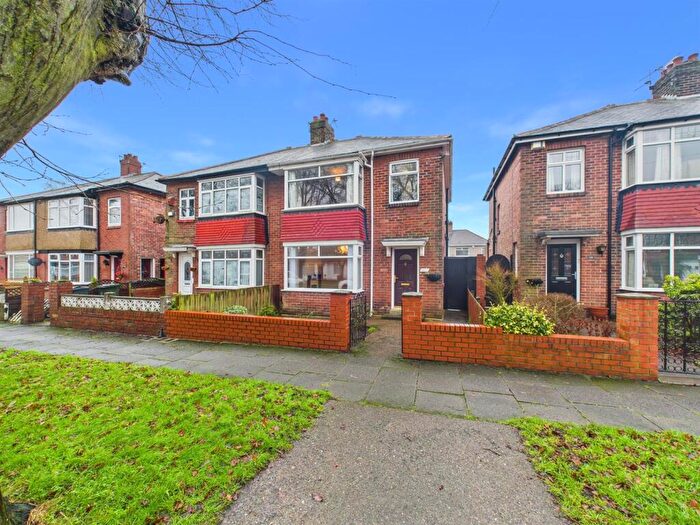
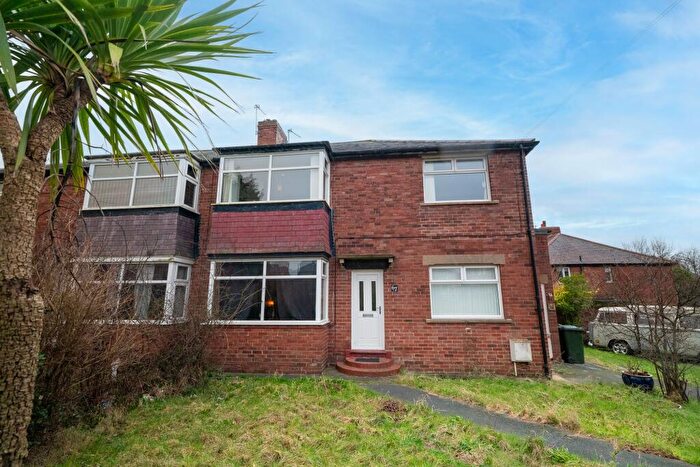
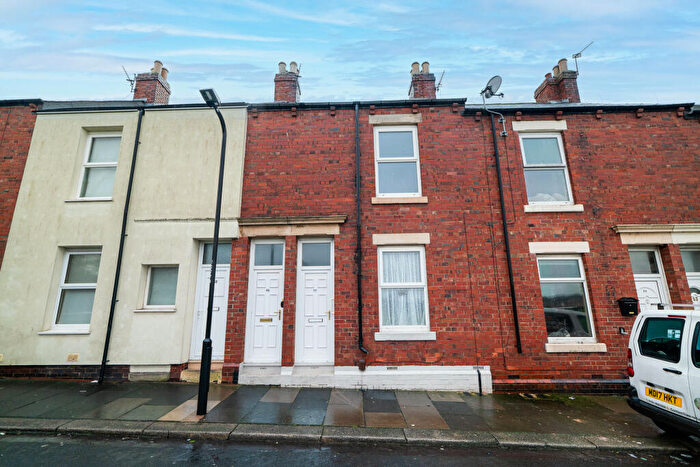
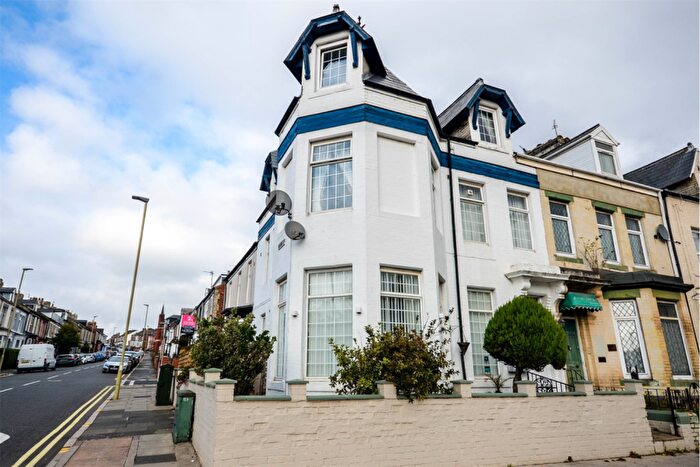
Properties in North Shields have an average house price of £234,802.00 and had 2,498 Property Transactions within the last 3 years.¹
North Shields is an area in North Tyneside with 27,486 households², where the most expensive property was sold for £1,550,000.00.
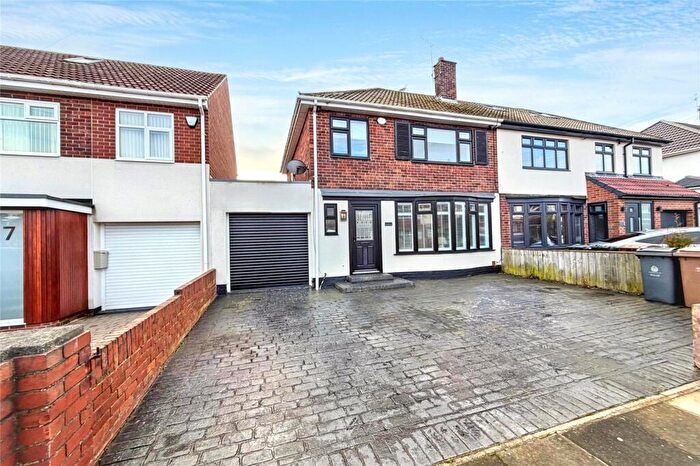
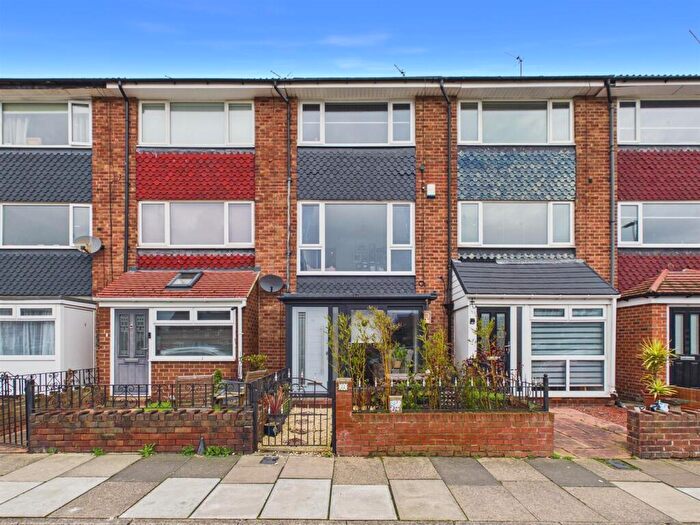
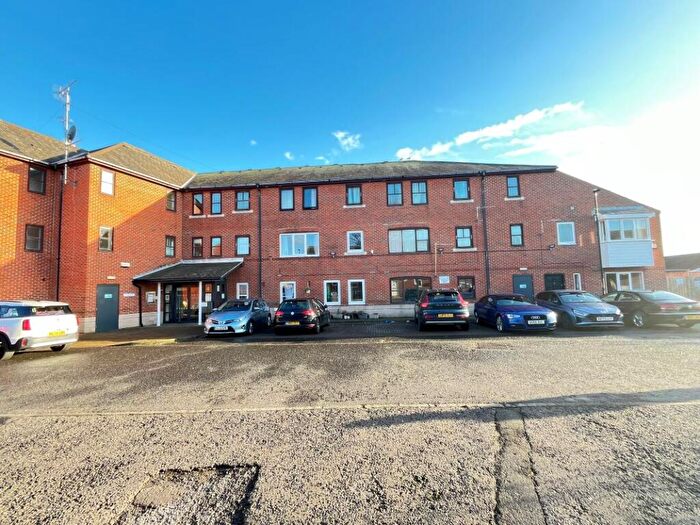
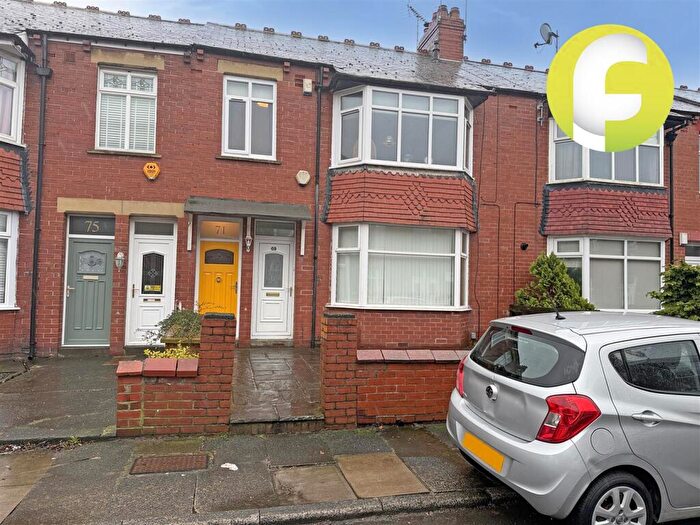
Properties for sale in North Shields
Neighbourhoods in North Shields
Navigate through our locations to find the location of your next house in North Shields, North Tyneside for sale or to rent.
Transport in North Shields
Please see below transportation links in this area:
-
Heworth Station
-
Manors Station
-
Newcastle Station
-
Cramlington Station
-
Sunderland Station
-
Dunston Station
-
MetroCentre Station
- FAQ
- Price Paid By Year
- Property Type Price
Frequently asked questions about North Shields
What is the average price for a property for sale in North Shields?
The average price for a property for sale in North Shields is £234,802. This amount is 5% higher than the average price in North Tyneside. There are 8,005 property listings for sale in North Shields.
What locations have the most expensive properties for sale in North Shields?
The locations with the most expensive properties for sale in North Shields are Tynemouth at an average of £323,741, Cullercoats at an average of £307,874 and Preston at an average of £235,691.
What locations have the most affordable properties for sale in North Shields?
The locations with the most affordable properties for sale in North Shields are Chirton at an average of £128,050, Riverside at an average of £162,051 and Collingwood at an average of £201,526.
Which train stations are available in or near North Shields?
Some of the train stations available in or near North Shields are Heworth, Manors and Newcastle.
Property Price Paid in North Shields by Year
The average sold property price by year was:
| Year | Average Sold Price | Price Change |
Sold Properties
|
|---|---|---|---|
| 2025 | £243,028 | 4% |
675 Properties |
| 2024 | £233,052 | 1% |
949 Properties |
| 2023 | £230,349 | 7% |
874 Properties |
| 2022 | £214,012 | 4% |
962 Properties |
| 2021 | £205,136 | 4% |
1,192 Properties |
| 2020 | £197,523 | 5% |
836 Properties |
| 2019 | £187,685 | 0,4% |
999 Properties |
| 2018 | £186,985 | 5% |
1,054 Properties |
| 2017 | £176,918 | 1% |
1,049 Properties |
| 2016 | £174,381 | 6% |
1,046 Properties |
| 2015 | £164,733 | 2% |
1,027 Properties |
| 2014 | £161,545 | 1% |
1,056 Properties |
| 2013 | £159,235 | 2% |
822 Properties |
| 2012 | £155,471 | 1% |
779 Properties |
| 2011 | £154,121 | -7% |
758 Properties |
| 2010 | £165,262 | 7% |
701 Properties |
| 2009 | £153,398 | 6% |
578 Properties |
| 2008 | £143,554 | -1% |
809 Properties |
| 2007 | £145,245 | -1% |
1,594 Properties |
| 2006 | £146,487 | 11% |
1,433 Properties |
| 2005 | £130,979 | - |
1,226 Properties |
| 2004 | £131,026 | 20% |
1,572 Properties |
| 2003 | £104,907 | 21% |
1,631 Properties |
| 2002 | £83,218 | 23% |
1,557 Properties |
| 2001 | £64,293 | 7% |
1,516 Properties |
| 2000 | £59,728 | -2% |
1,628 Properties |
| 1999 | £61,114 | 0,3% |
1,402 Properties |
| 1998 | £60,928 | 4% |
1,271 Properties |
| 1997 | £58,464 | 11% |
1,302 Properties |
| 1996 | £51,803 | 7% |
1,169 Properties |
| 1995 | £48,121 | - |
978 Properties |
Property Price per Property Type in North Shields
Here you can find historic sold price data in order to help with your property search.
The average Property Paid Price for specific property types in the last three years are:
| Property Type | Average Sold Price | Sold Properties |
|---|---|---|
| Semi Detached House | £267,598.00 | 669 Semi Detached Houses |
| Terraced House | £256,762.00 | 859 Terraced Houses |
| Detached House | £415,724.00 | 171 Detached Houses |
| Flat | £145,013.00 | 799 Flats |

