
Houses for sale in North Tyneside, England
House Prices in North Tyneside
Properties in North Tyneside have
an average house price of
£225k
and had 9,904 Property Transactions
within the last 3 years.¹
North Tyneside is a location in
England with
96,345 households², where the most expensive property was sold for £1.75M.
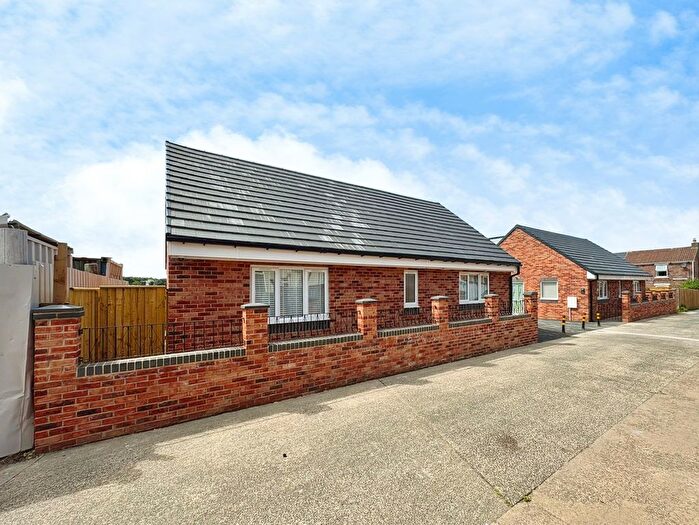
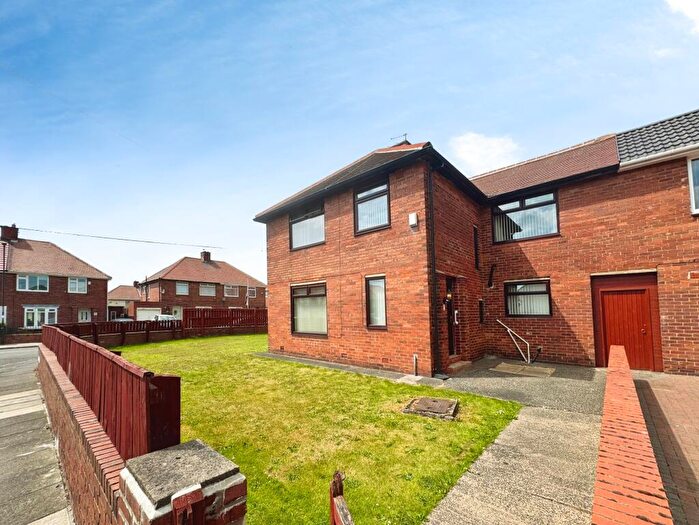
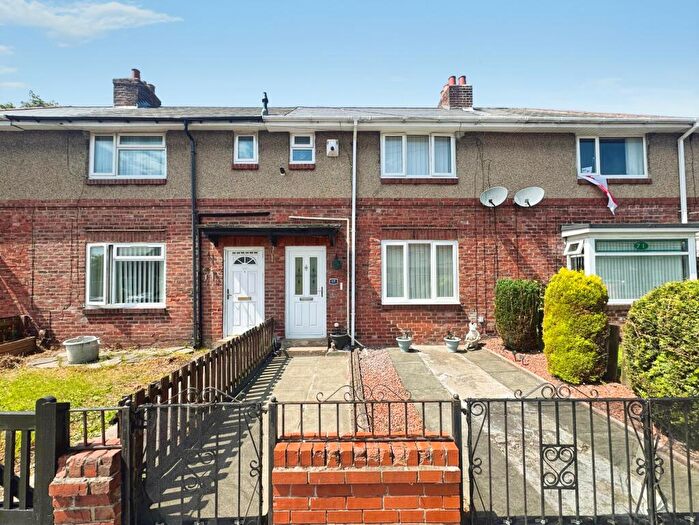
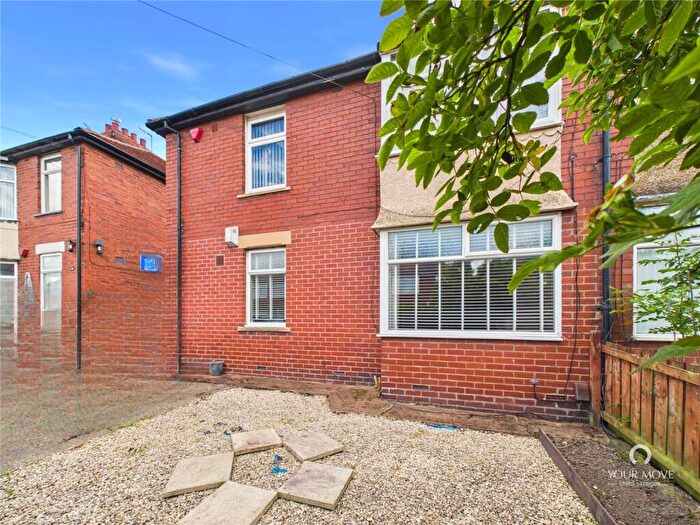
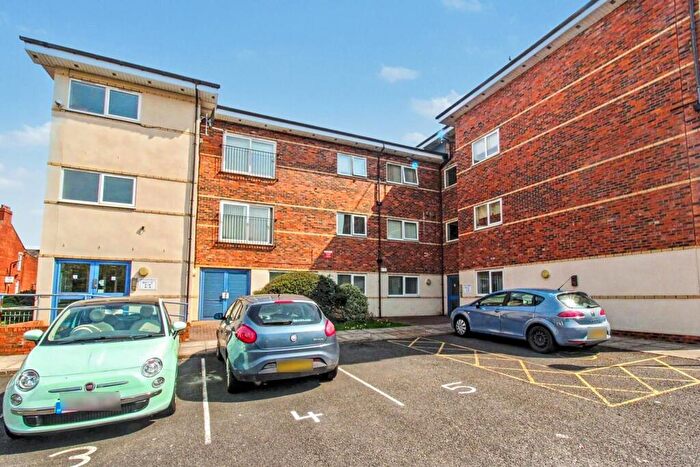
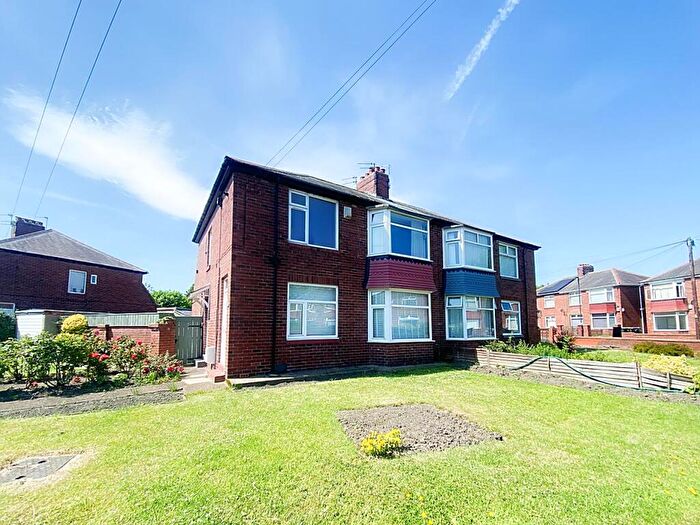
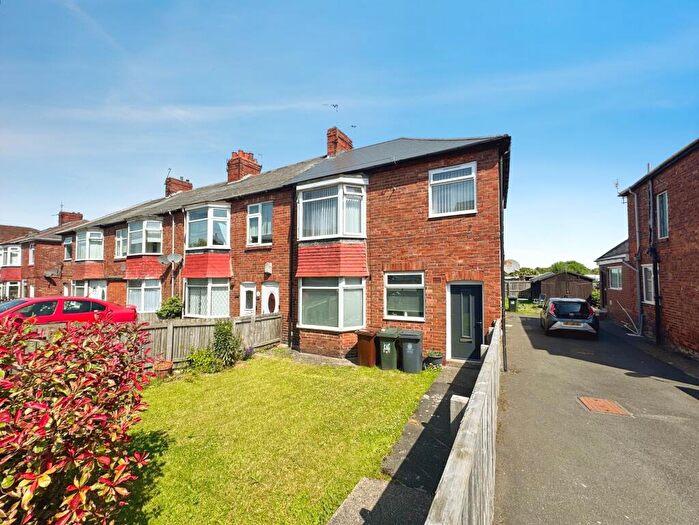
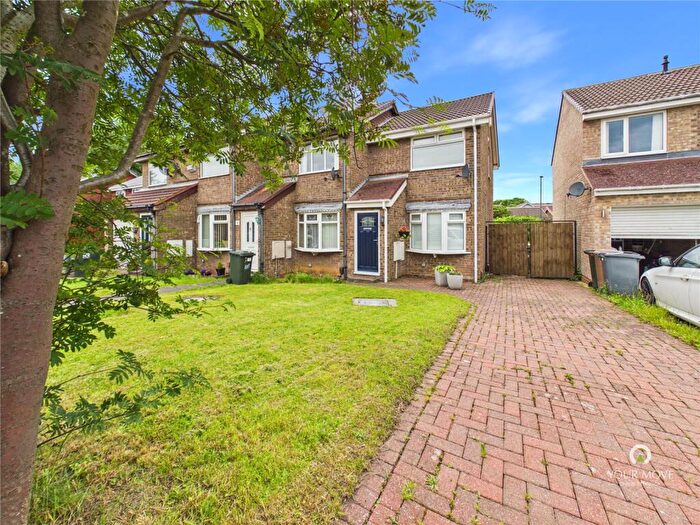
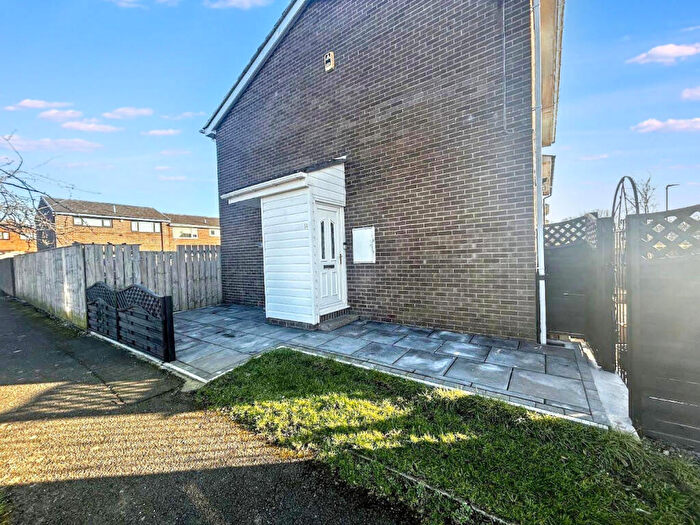
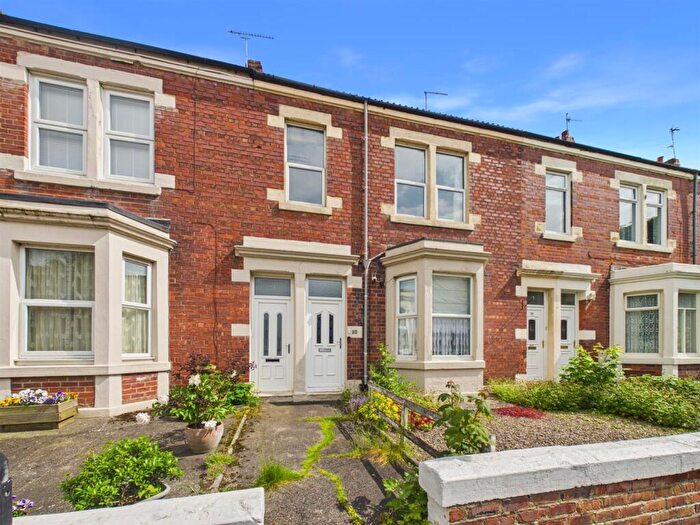
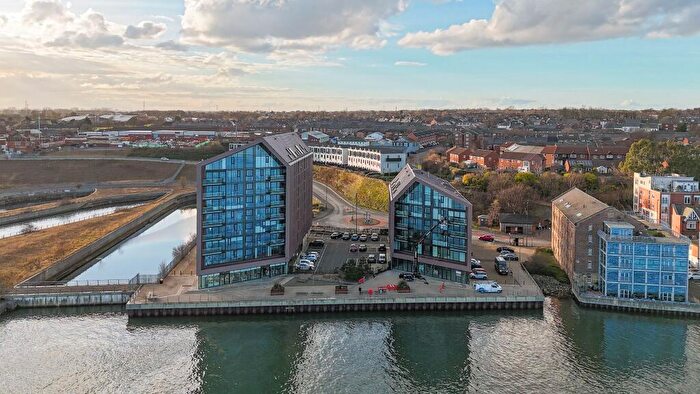
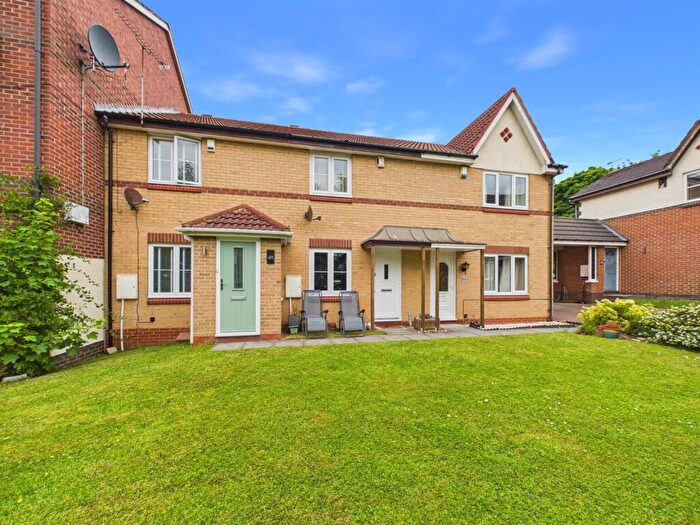
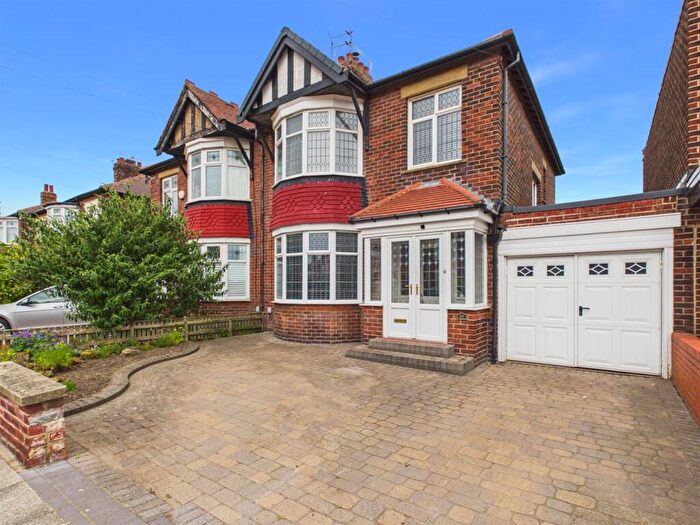
Properties for sale in North Tyneside
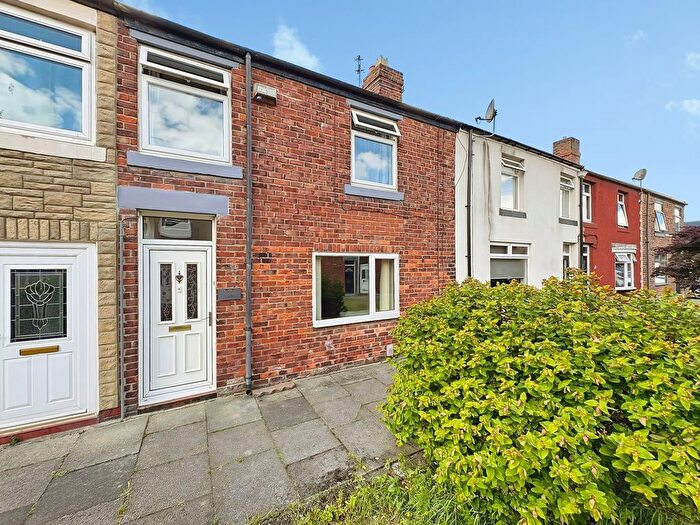


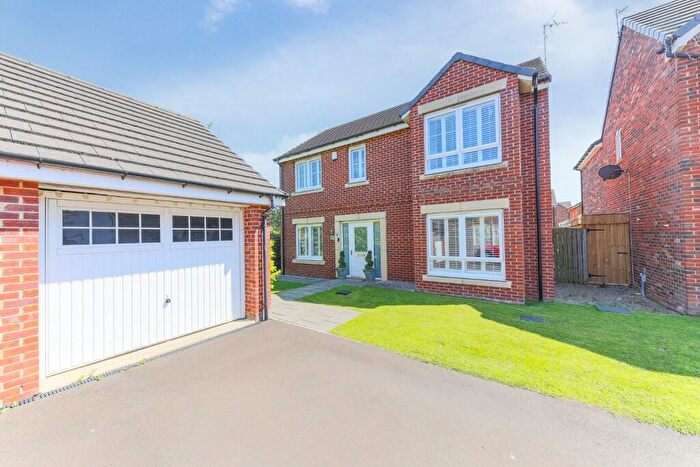
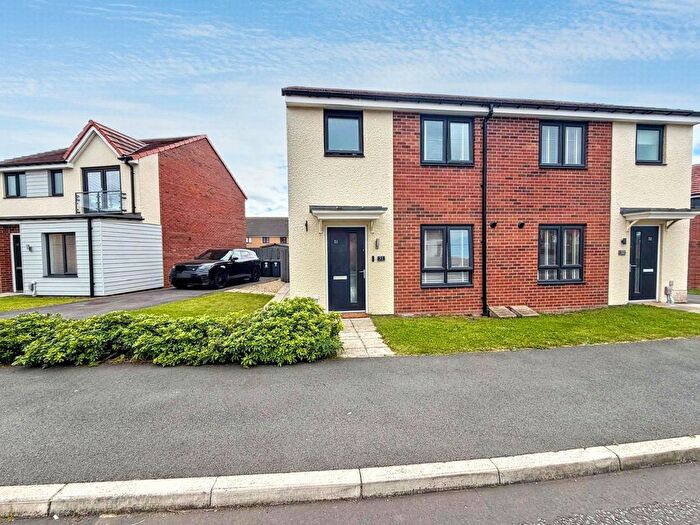
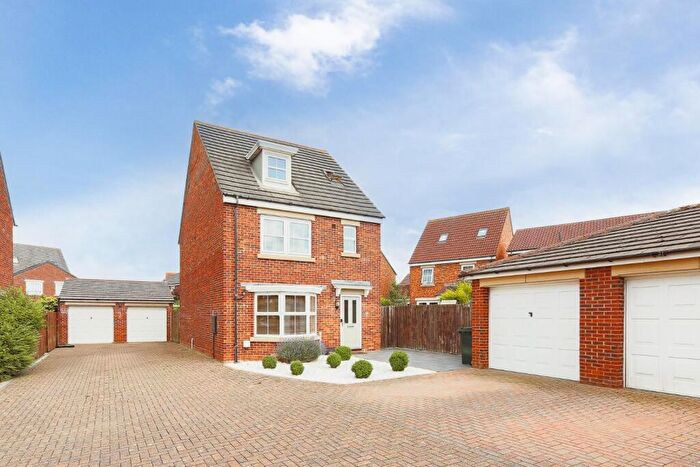
![]()
If you are looking to sell your house, let it out, or receive a property valuation, an expert can help you.
Click the button below to get started.


Towns in North Tyneside
Navigate through our locations to find the location of your next house in North Tyneside, England for sale or to rent.
Property price trends in North Tyneside
According to the latest Land Registry data, the average home in North Tyneside sold for £211,741 in 2026. That figure comes from a substantial record of 117,540 sales logged over the past 31 years.
Prices have softened over the last three years. Compared with 2023, when the typical sale came in around £215,985, that's a fall of roughly 2%.
Looking back five years, average prices are up about 7% since 2021, a gain of around £13,939 in cash terms.
Zoom out to the past decade for the fuller picture. Back in 2016, homes here averaged £172,216, so the typical sold price has climbed about 23% since then, roughly 2.1% a year. Stretch the view to fifteen years and that annual pace edges up closer to 2.4%.
Frequently asked questions about North Tyneside
What is the average price for a property for sale in North Tyneside?
The average price for a property for sale in North Tyneside is £224,840. This amount is 37% lower than the average price in England. There are more than 10,000 property listings for sale in North Tyneside.
What locations have the most expensive properties for sale in North Tyneside?
The locations with the most expensive properties for sale in North Tyneside are Whitley Bay at an average of £334,876, North Shields at an average of £235,685 and Newcastle Upon Tyne at an average of £204,585.
What locations have the most affordable properties for sale in North Tyneside?
The locations with the most affordable properties for sale in North Tyneside are Cramlington at an average of £143,372 and Wallsend at an average of £148,767.
Which train stations are available in or near North Tyneside?
Some of the train stations available in or near North Tyneside are Manors, Heworth and Newcastle.
Property Price Paid in North Tyneside by Year
The average sold property price by year was:
| Year | Average Sold Price | Price Change |
Sold Properties
|
|---|---|---|---|
| 2026 | £211,741 | -11% |
490 Properties |
| 2025 | £235,718 | 5% |
3,085 Properties |
| 2024 | £224,943 | 4% |
3,226 Properties |
| 2023 | £215,985 | 2% |
3,103 Properties |
| 2022 | £212,577 | 7% |
3,356 Properties |
| 2021 | £197,802 | 3% |
4,135 Properties |
| 2020 | £192,843 | 1% |
3,277 Properties |
| 2019 | £190,717 | 3% |
3,828 Properties |
| 2018 | £185,797 | 1% |
4,121 Properties |
| 2017 | £183,945 | 6% |
4,015 Properties |
Property Price per Property Type in North Tyneside
Here you can find historic sold price data in order to help with your property search.
The average Property Paid Price for specific property types in the last three years are:
| Property Type | Average Sold Price | Sold Properties |
|---|---|---|
| Semi Detached House | £244,019.00 | 3,185 Semi Detached Houses |
| Terraced House | £222,129.00 | 3,307 Terraced Houses |
| Detached House | £372,634.00 | 1,151 Detached Houses |
| Flat | £126,549.00 | 2,261 Flats |
Transport in North Tyneside
Please see below transportation links in this area:
