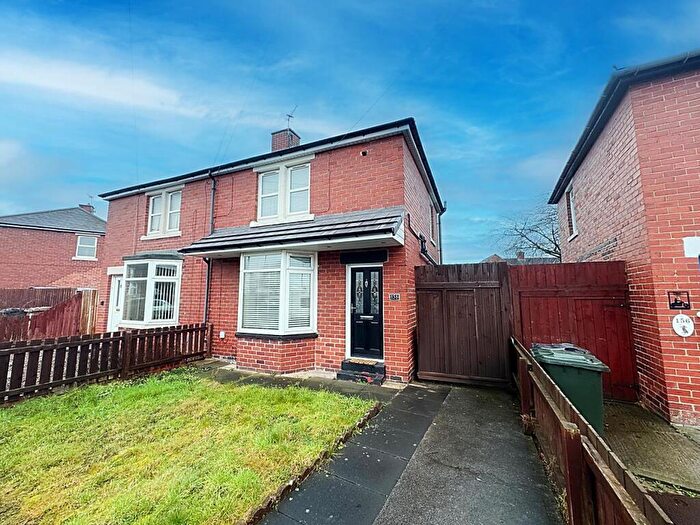
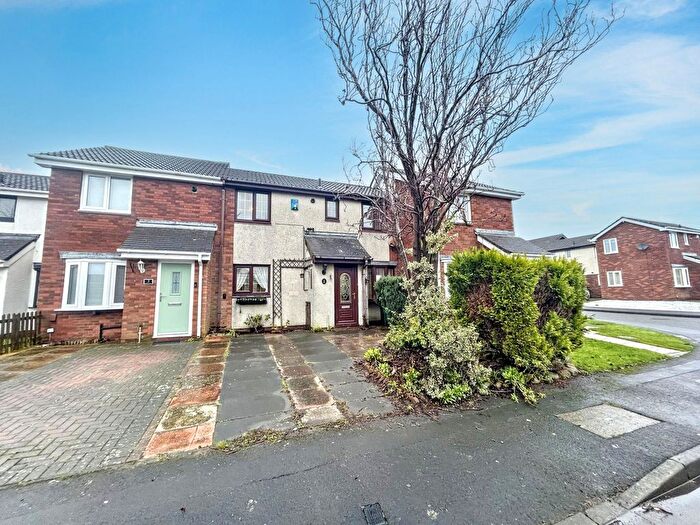
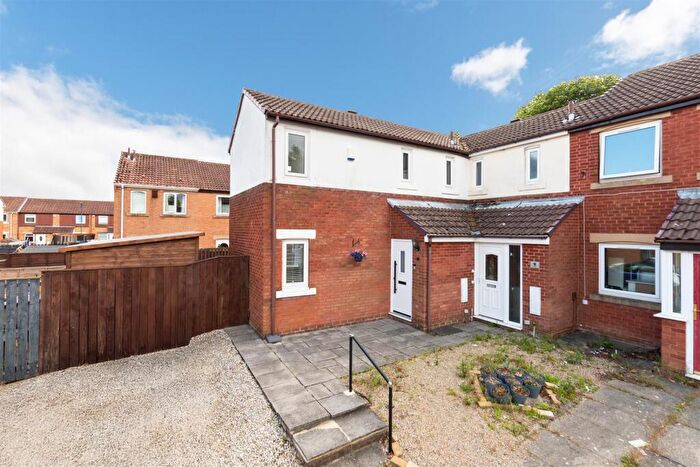
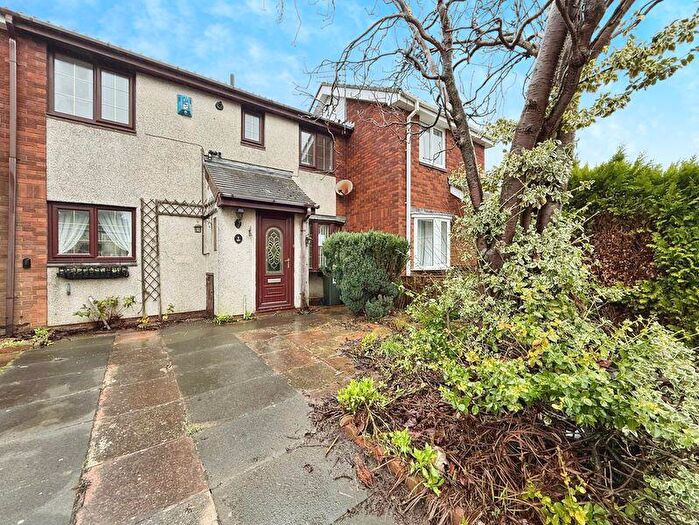
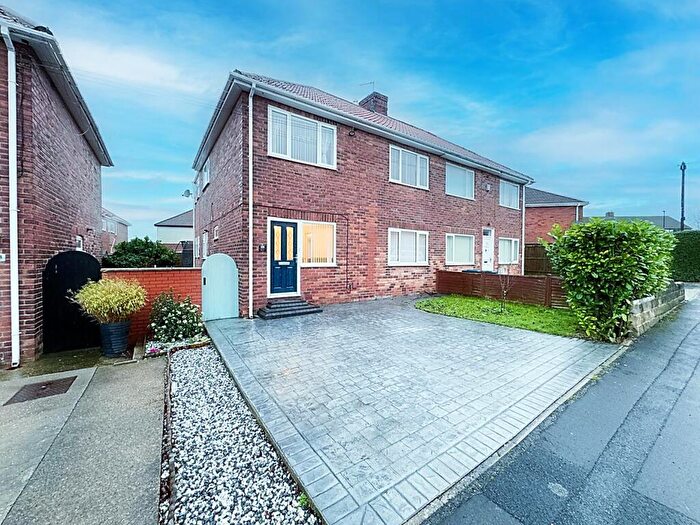
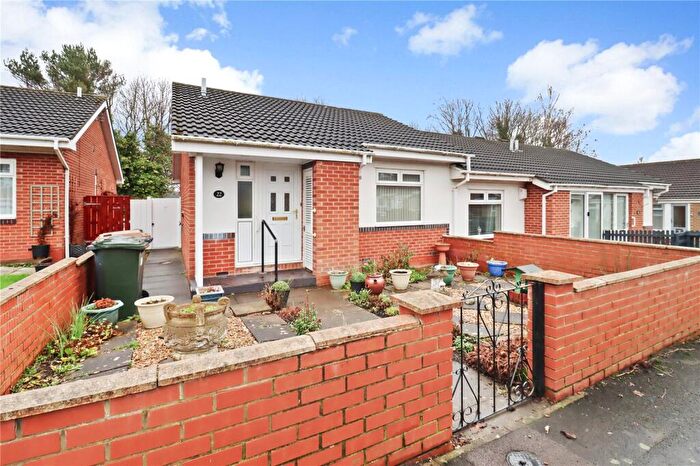
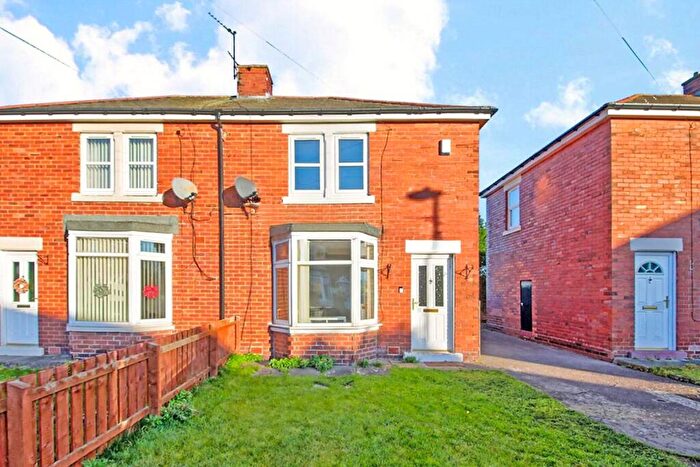
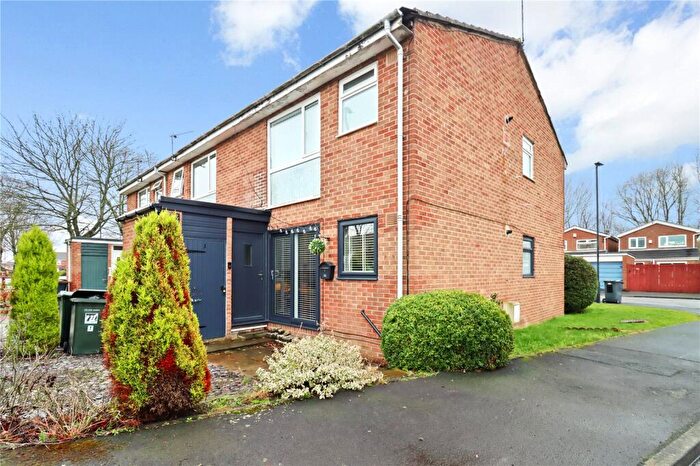
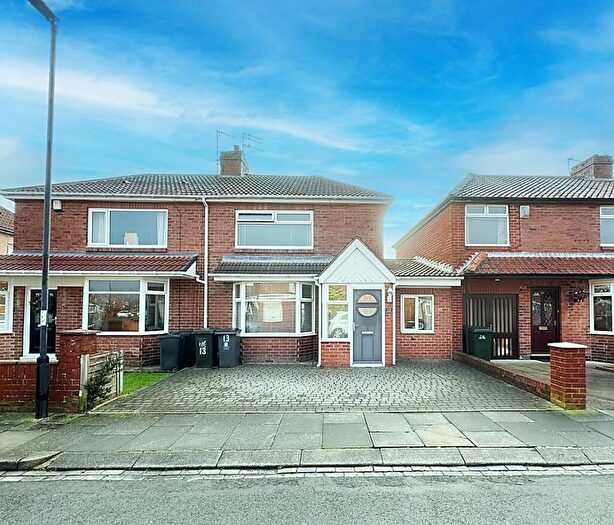
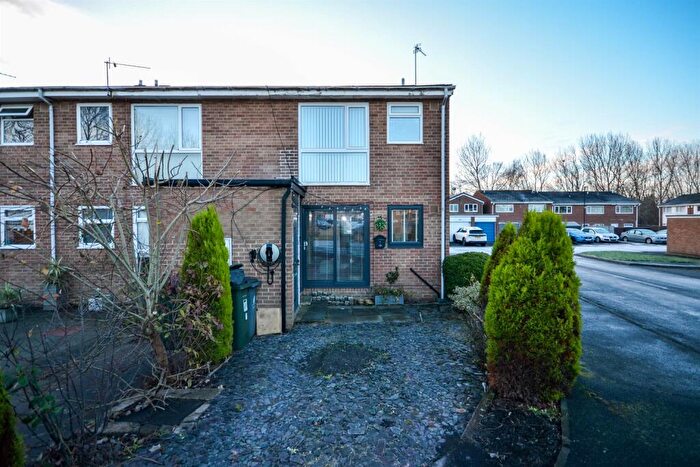
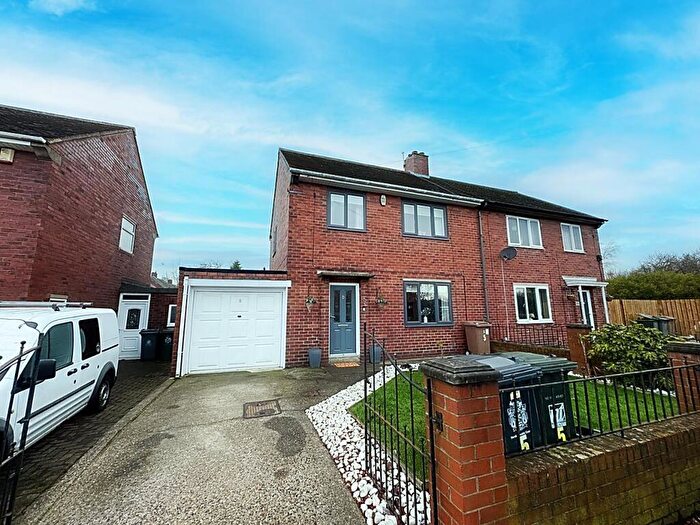
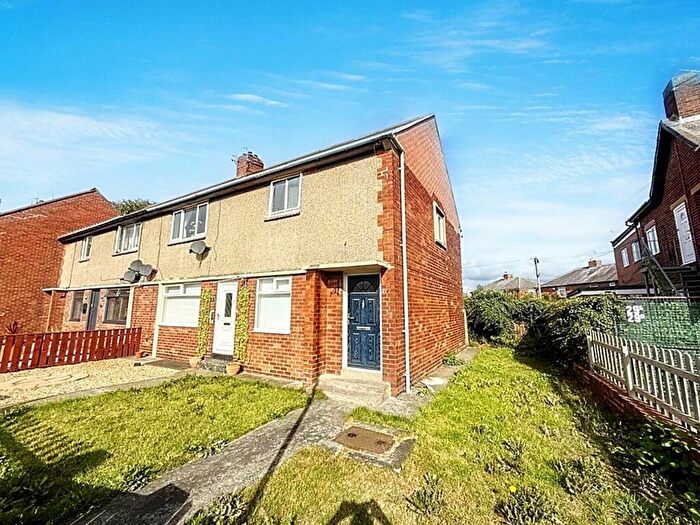
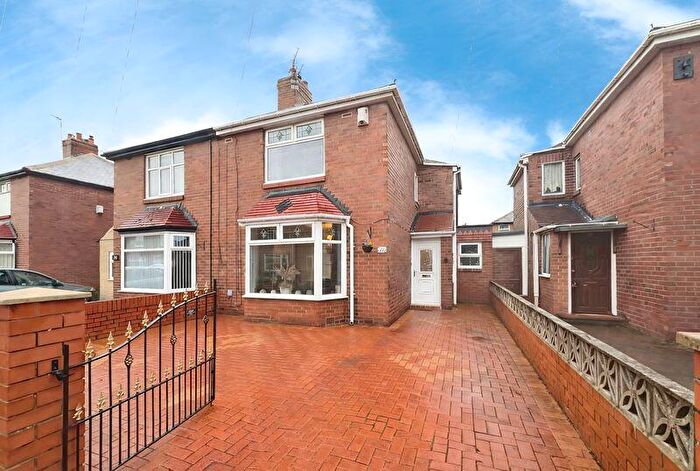
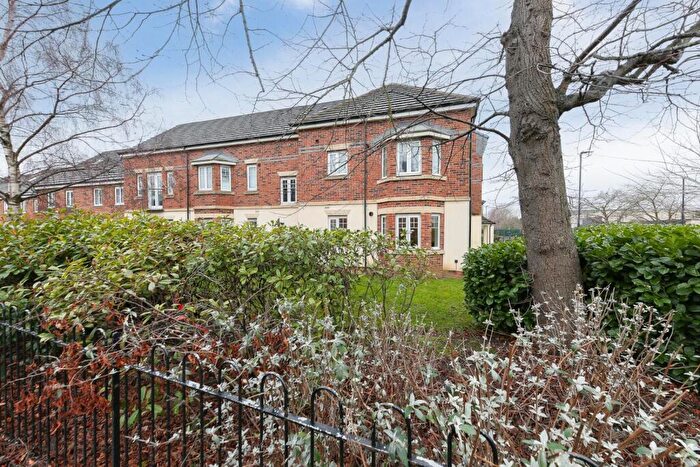
Houses for sale & to rent in Northumberland, Wallsend
House Prices in Northumberland
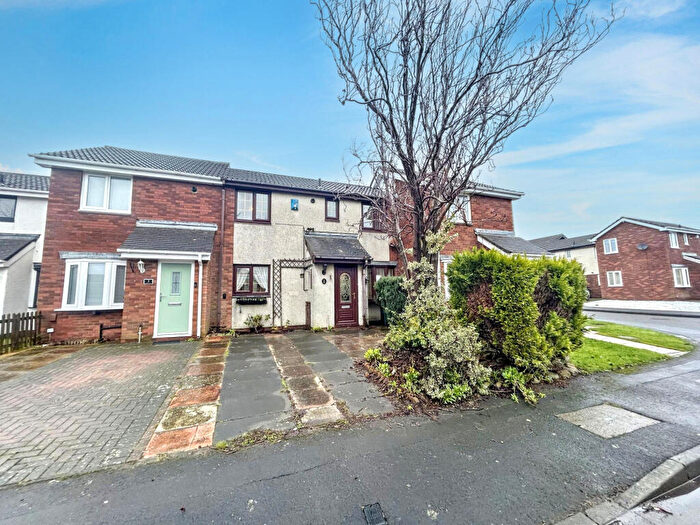
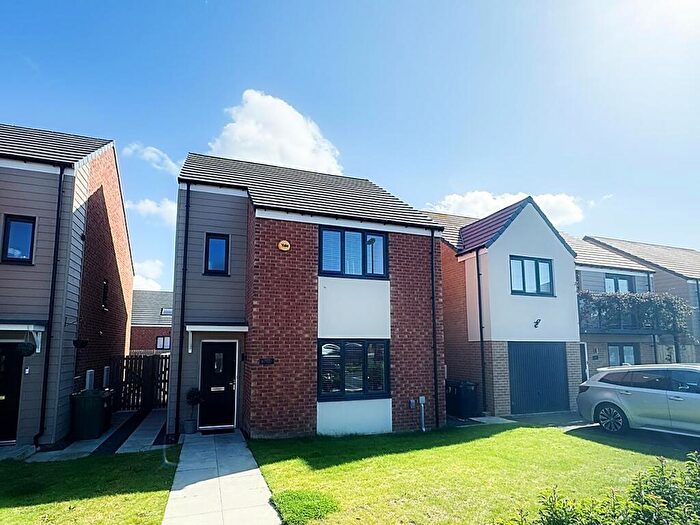
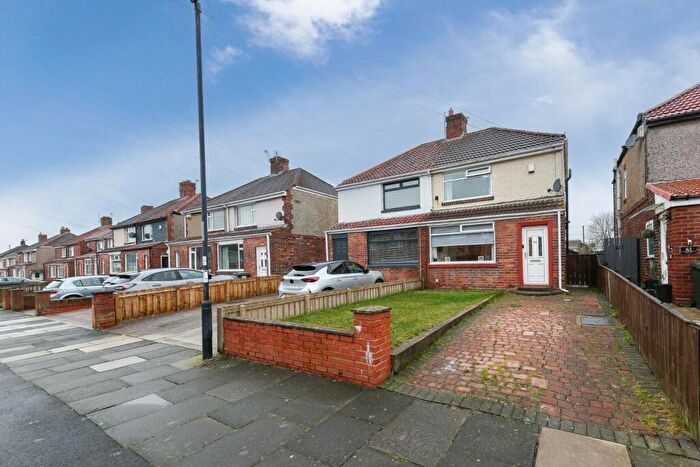
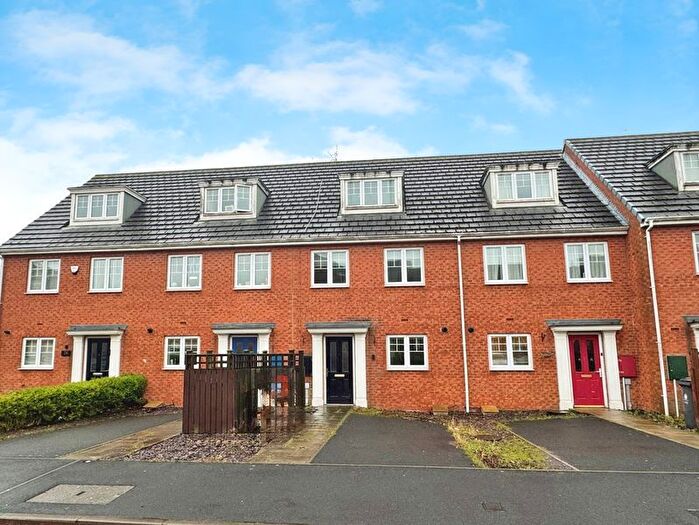
Properties in Northumberland have an average house price of £173,875.00 and had 422 Property Transactions within the last 3 years¹.
Northumberland is an area in Wallsend, North Tyneside with 3,719 households², where the most expensive property was sold for £495,000.00.
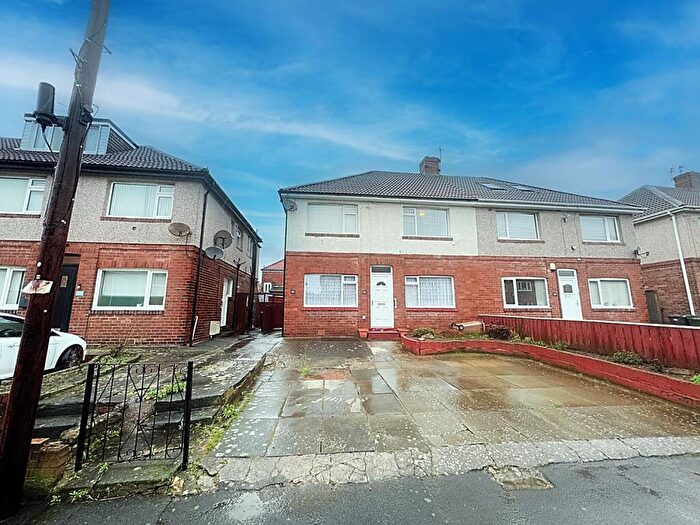
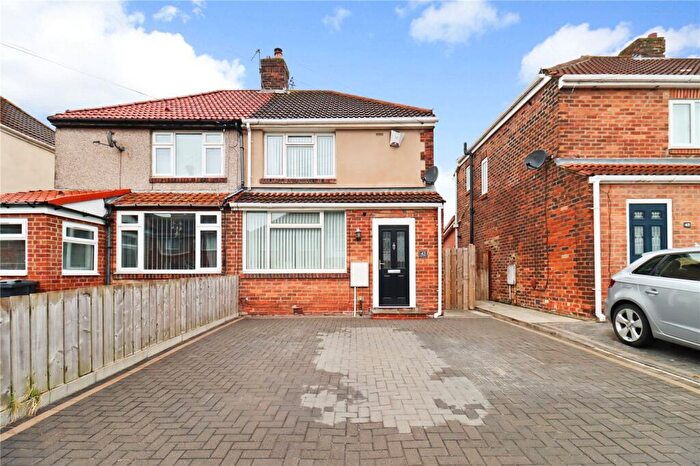
Properties for sale in Northumberland
Roads and Postcodes in Northumberland
Navigate through our locations to find the location of your next house in Northumberland, Wallsend for sale or to rent.
| Streets | Postcodes |
|---|---|
| Airedale | NE28 8TL |
| Ashfield Gardens | NE28 8AP |
| Beaumont Drive | NE28 9GF |
| Bedford Avenue | NE28 8EF |
| Beechfield Gardens | NE28 8AS |
| Benton Court | NE28 9GD |
| Benton Crescent | NE28 9GJ |
| Benton Rise | NE28 9EW |
| Benton Walk | NE28 9GB |
| Bigges Gardens | NE28 8BB |
| Bishopdale | NE28 9TP |
| Bittern Close | NE28 9GL |
| Bowman Drive | NE28 9FU |
| Brockwell Gardens | NE28 9GH |
| Brooksmead | NE28 8PW |
| Calderdale | NE28 8SN |
| Cambridge Avenue | NE28 8EQ |
| Cheshire Gardens | NE28 8EE |
| Chesterwood Drive | NE28 8EP |
| Chicken Road | NE28 8NH NE28 8NN |
| Churcher Gardens | NE28 9ET |
| Coalfield Way | NE28 9GG |
| Coast Road | NE28 8DA NE28 9HP |
| Collingwood Avenue | NE28 9LD NE28 9LW |
| Conway Gardens | NE28 9HH |
| Cotterdale | NE28 8TN |
| Coverdale | NE28 8TJ |
| Cross Avenue | NE28 8BE NE28 8BG |
| Dalton Court | NE28 9TN |
| Deepdale | NE28 8SL |
| Delaval Way | NE28 9FW |
| Derby Gardens | NE28 8EB |
| Devonshire Gardens | NE28 8EA |
| Dorset Avenue | NE28 8DX |
| Edge Way | NE28 9FH |
| Elliott Gardens | NE28 9EU |
| Elmfield Gardens | NE28 8AN NE28 8AW |
| Eltringham Close | NE28 8ES |
| Eston Court | NE28 9TL |
| Exeter Road | NE28 9HG NE28 9HQ NE28 9YP NE28 9YR |
| Fallow Park | NE28 9GA |
| Farndale | NE28 8TH |
| Furrow Drive | NE28 9FG |
| Grace Gardens | NE28 8NL |
| Green Park | NE28 8UL |
| Hardy Grove | NE28 9HF |
| Henderson Road | NE28 9LF NE28 9LE |
| High View North | NE28 9LB NE28 9LG NE28 9LQ |
| Holland Park | NE28 8UJ |
| Hollings Crescent | NE28 9LN |
| Home Park | NE28 8UH |
| Hotspur Road | NE28 9HB NE28 9HJ |
| Hyde Park | NE28 8UG |
| Kensington Gardens | NE28 8UW |
| Leicester Close | NE28 9YX NE28 9YY NE28 9YZ |
| Lincoln Avenue | NE28 8DZ |
| Littondale | NE28 8TZ |
| Low Gardens | NE28 9FB |
| Mackley Court | NE28 9FD |
| Main Crescent | NE28 8AF NE28 8AG |
| Malton Gardens | NE28 9LA |
| Mason Road | NE28 9ER |
| Mayfield Gardens | NE28 8AT |
| Mcilvenna Gardens | NE28 9EY |
| Miller Way | NE28 8EL |
| Moor Drive | NE28 9FE |
| Moor Edge Drive | NE28 9FQ NE28 9FR |
| Mulcaster Gardens | NE28 8NJ |
| Mullen Gardens | NE28 9EZ |
| Mullen Road | NE28 9EX NE28 9HA |
| Oakfield Gardens | NE28 8AR |
| Ohanlon Crescent | NE28 9ES |
| Orchard Gardens | NE28 8AY |
| Oxen Close | NE28 9FT |
| Oxen Drive | NE28 9FJ |
| Oxford Avenue | NE28 8EG |
| Parkside Terrace | NE28 9EP |
| Primrose Gardens | NE28 8NW |
| Prince Road | NE28 8DN |
| Prospect Avenue North | NE28 9LL NE28 9LP |
| Quarry Close | NE28 9GE |
| Queens Crescent | NE28 8DL NE28 8DR NE28 8DW |
| Regent Road | NE28 8DP |
| Regents Court | NE28 8UF |
| Regents Park | NE28 8UE |
| Rheydt Avenue | NE28 8SU NE28 8SX |
| Ribblesdale | NE28 8UA |
| Richmond Park | NE28 8UN |
| Ridge Way | NE28 9FF |
| Ridley Drive | NE28 9FL |
| Rosedale | NE28 9TX |
| Ryedale | NE28 8TT |
| Saxon Way | NE28 9FX |
| Sherwood View | NE28 8NP |
| Somerset Gardens | NE28 8DY |
| Springfield Gardens | NE28 8AJ |
| Stamfordham Close | NE28 8ER |
| Station Road | NE28 8DH NE28 8DS NE28 8DT NE28 8DU NE28 8AH NE28 8DF NE28 8DG NE28 8EN |
| Station Road North | NE28 8AA NE28 8AB NE28 8AD NE28 8NF NE28 8NG NE28 8NQ NE28 8NR NE28 8AE |
| Stephenson Way | NE28 9FN |
| Strawberry Gardens | NE28 8AX NE28 8AZ NE28 8BA |
| Sun Walk | NE28 9FA |
| Sunholme Drive | NE28 9YT NE28 9YU NE28 9YW |
| Sutton Court | NE28 9TW |
| Swaledale | NE28 8TR |
| Swallow Court | NE28 9FS |
| Swan Close | NE28 8EJ |
| Sydney Grove | NE28 9HD NE28 9HE NE28 9YS |
| The Drive | NE28 8DQ |
| The Risings | NE28 9PB |
| Thompson Gardens | NE28 8DJ |
| Waltham Close | NE28 8TA |
| Welwyn Close | NE28 8TE |
| Wensleydale | NE28 8TW |
| West Street | NE28 8ED NE28 8EH |
| Westburn Gardens | NE28 8BD |
| Westerdale | NE28 8UB NE28 8UD |
| Wharfedale | NE28 8TP |
| Wiltshire Drive | NE28 8TS NE28 8TU |
| Wiltshire Gardens | NE28 8AL NE28 8AU |
| Wimslow Close | NE28 8TB |
| Windsor Park | NE28 8UQ |
| Woburn Close | NE28 8TG NE28 8TQ |
| Worsley Close | NE28 8TF |
| Worthing Close | NE28 8TD |
| NE12 9SH |
Transport near Northumberland
- FAQ
- Price Paid By Year
- Property Type Price
Frequently asked questions about Northumberland
What is the average price for a property for sale in Northumberland?
The average price for a property for sale in Northumberland is £173,875. This amount is 17% higher than the average price in Wallsend. There are 1,245 property listings for sale in Northumberland.
What streets have the most expensive properties for sale in Northumberland?
The streets with the most expensive properties for sale in Northumberland are Hyde Park at an average of £425,000, Kensington Gardens at an average of £328,500 and Richmond Park at an average of £288,750.
What streets have the most affordable properties for sale in Northumberland?
The streets with the most affordable properties for sale in Northumberland are Hardy Grove at an average of £90,097, Ryedale at an average of £99,500 and Worsley Close at an average of £100,000.
Which train stations are available in or near Northumberland?
Some of the train stations available in or near Northumberland are Manors, Heworth and Newcastle.
Property Price Paid in Northumberland by Year
The average sold property price by year was:
| Year | Average Sold Price | Price Change |
Sold Properties
|
|---|---|---|---|
| 2025 | £183,852 | 4% |
116 Properties |
| 2024 | £175,820 | 7% |
165 Properties |
| 2023 | £163,390 | -9% |
141 Properties |
| 2022 | £177,558 | 0,1% |
158 Properties |
| 2021 | £177,300 | 8% |
248 Properties |
| 2020 | £163,856 | 6% |
257 Properties |
| 2019 | £154,512 | -3% |
262 Properties |
| 2018 | £158,697 | -2% |
255 Properties |
| 2017 | £162,278 | 17% |
227 Properties |
| 2016 | £134,605 | 18% |
135 Properties |
| 2015 | £110,910 | -7% |
111 Properties |
| 2014 | £119,213 | 11% |
104 Properties |
| 2013 | £105,555 | -2% |
87 Properties |
| 2012 | £107,484 | 4% |
75 Properties |
| 2011 | £103,582 | -8% |
78 Properties |
| 2010 | £111,789 | 10% |
70 Properties |
| 2009 | £100,077 | -14% |
65 Properties |
| 2008 | £113,954 | -12% |
73 Properties |
| 2007 | £127,586 | 8% |
211 Properties |
| 2006 | £117,344 | 7% |
216 Properties |
| 2005 | £109,488 | 9% |
177 Properties |
| 2004 | £99,339 | 24% |
159 Properties |
| 2003 | £75,855 | 26% |
186 Properties |
| 2002 | £56,143 | 13% |
173 Properties |
| 2001 | £49,049 | 5% |
174 Properties |
| 2000 | £46,455 | 6% |
170 Properties |
| 1999 | £43,550 | -4% |
162 Properties |
| 1998 | £45,285 | 12% |
161 Properties |
| 1997 | £39,660 | 0,1% |
135 Properties |
| 1996 | £39,640 | -2% |
162 Properties |
| 1995 | £40,423 | - |
127 Properties |
Property Price per Property Type in Northumberland
Here you can find historic sold price data in order to help with your property search.
The average Property Paid Price for specific property types in the last three years are:
| Property Type | Average Sold Price | Sold Properties |
|---|---|---|
| Semi Detached House | £174,229.00 | 181 Semi Detached Houses |
| Detached House | £280,394.00 | 68 Detached Houses |
| Terraced House | £146,063.00 | 134 Terraced Houses |
| Flat | £82,059.00 | 39 Flats |

