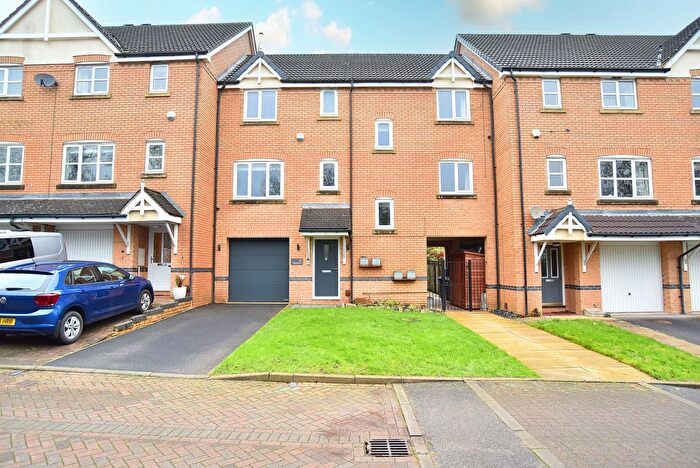
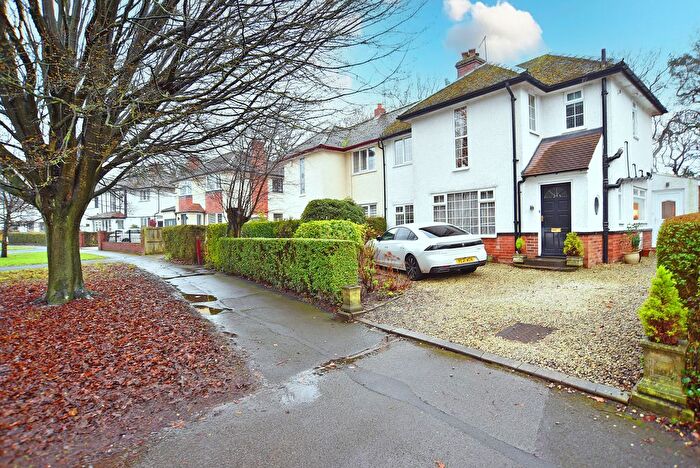
Houses for sale & to rent in Granby, Harrogate
House Prices in Granby
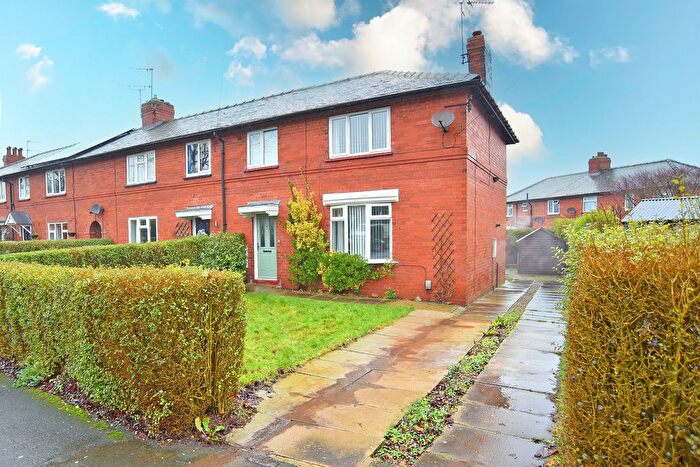
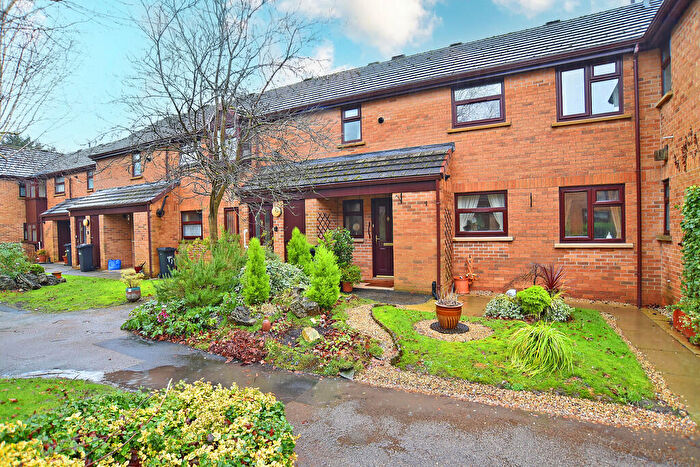
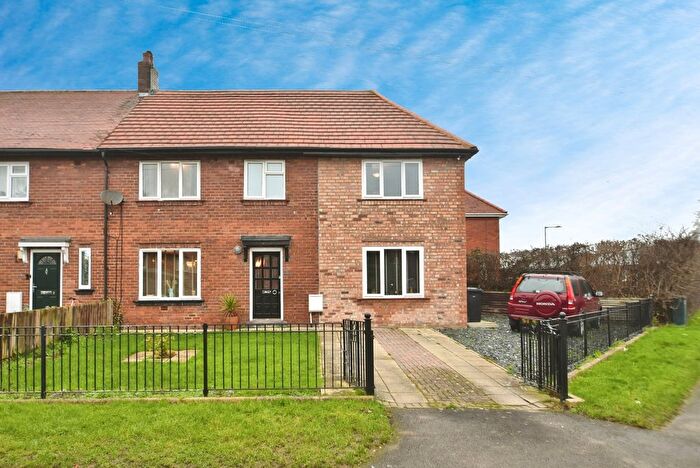
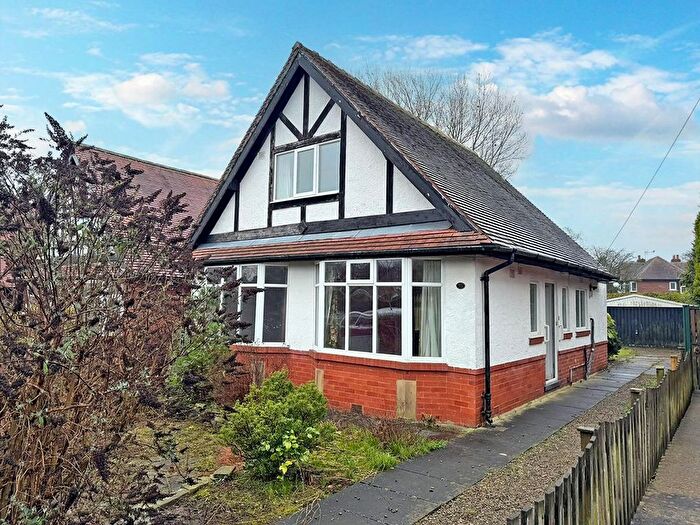
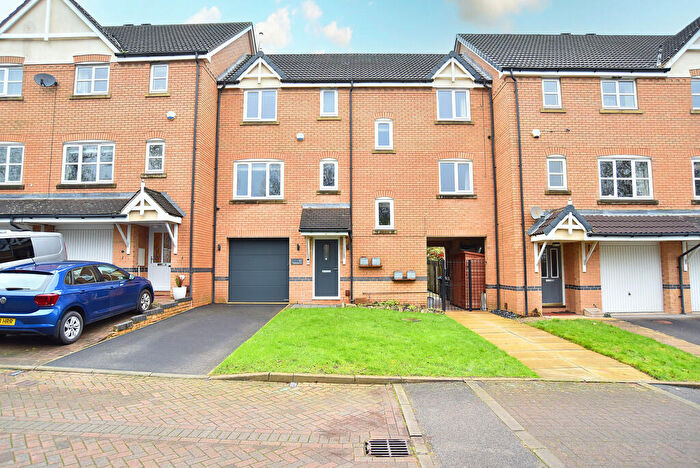
Properties in Granby have an average house price of £305,241.00 and had 224 Property Transactions within the last 3 years¹.
Granby is an area in Harrogate, North Yorkshire with 2,421 households², where the most expensive property was sold for £1,250,000.00.
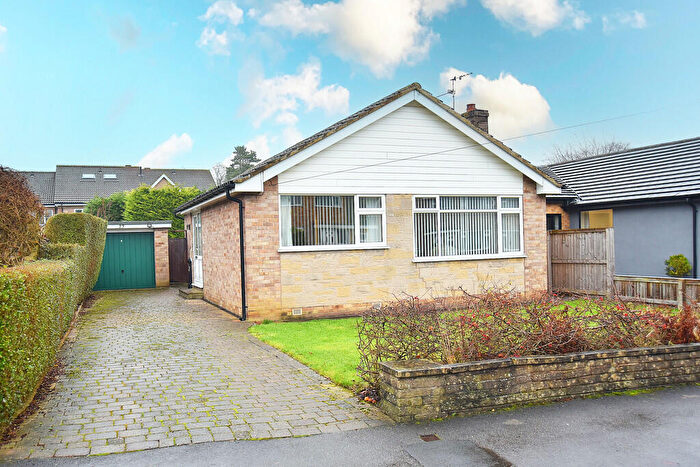
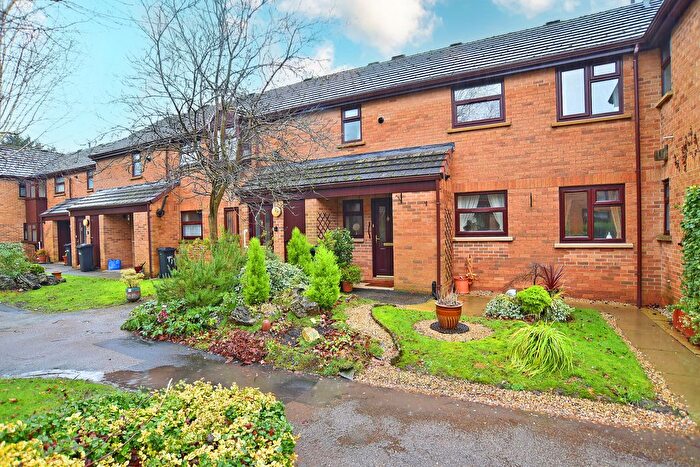
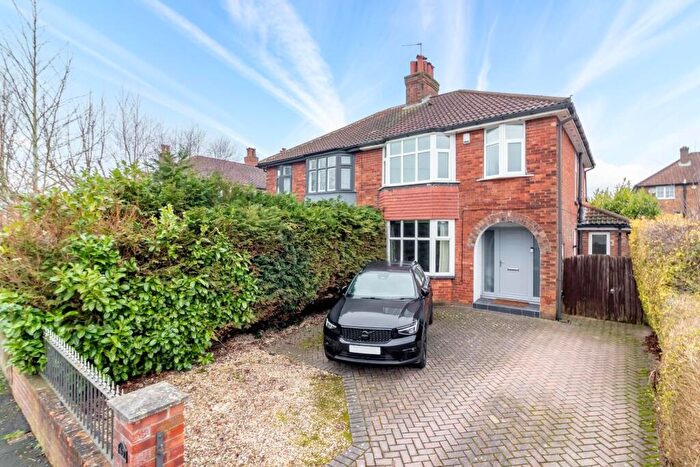
Properties for sale in Granby
Roads and Postcodes in Granby
Navigate through our locations to find the location of your next house in Granby, Harrogate for sale or to rent.
| Streets | Postcodes |
|---|---|
| Ainsty Road | HG1 4AW |
| Anchor Road | HG1 4TA |
| Avondale Road | HG1 4AN |
| Birstwith Road | HG1 4TG HG1 4TQ |
| Cawthorn Avenue | HG2 7QA HG2 7QD |
| Cawthorne Place | HG2 7QE |
| Century Walk | HG1 4NN |
| Claro Avenue | HG1 4AX |
| Claro Road | HG1 4AU |
| Coniston Road | HG1 4SL |
| Deane Place | HG2 7RA |
| Derwent Road | HG1 4SG |
| Fairfax Avenue | HG2 7RF HG2 7RQ HG2 7RU |
| Gascoigne Crescent | HG1 4AJ |
| Granby Park | HG1 4AE |
| Granby Road | HG1 4SR HG1 4ST |
| Hambleton Road | HG1 4AS |
| Hargrove Road | HG2 7RD |
| Hawes Road | HG1 4SB HG1 4SE |
| Hurstleigh Terrace | HG1 4TF |
| Jesmond Road | HG1 4RZ HG1 4SA |
| Kendal Road | HG1 4SH |
| Kennion Road | HG2 7QY |
| Kingsley Drive | HG1 4TH HG1 4TJ HG1 4TL |
| Kingsley Road | HG1 4RB |
| Kirkstone Road | HG1 4SJ |
| Knaresborough Road | HG2 7LT HG2 7LU HG2 7LX HG2 7LY HG2 7NW HG2 7SP HG2 7SR |
| Lancaster Park Road | HG2 7SN HG2 7SW |
| Leyland Crescent | HG1 4RX |
| Leyland Road | HG1 4RT HG1 4RU |
| Lynton Gardens | HG1 4TE |
| Malden Road | HG1 4SF |
| Newnham Terrace | HG2 7ST |
| Nightingale Drive | HG1 4NJ |
| Roseville Avenue | HG1 4AB HG1 4SU |
| Roseville Drive | HG1 4SZ |
| Roseville Road | HG1 4TD |
| Rosewood Crescent | HG1 4NL |
| Rydal Road | HG1 4SD HG1 4SQ |
| Silverfields Road | HG1 4SY |
| Slingsby Crescent | HG1 4AL |
| St Andrews Avenue | HG2 7RH HG2 7RN |
| St Andrews Crescent | HG2 7RT |
| St Andrews Grove | HG2 7RP |
| St Andrews Parade | HG2 7RJ |
| St Andrews Place | HG2 7RW |
| St Andrews Road | HG2 7RR |
| St Andrews Street | HG2 7RS |
| St Andrews Walk | HG2 7RL |
| St Nicholas Place | HG2 7PZ |
| St Nicholas Road | HG2 7PX |
| St Nicholas Walk | HG2 7PY |
| Stanhope Drive | HG2 7QX HG2 7RE |
| Stonefall Drive | HG2 7QJ |
| Stonefall Place | HG2 7QL |
| Swarcliffe Road | HG1 4NW HG1 4QX HG1 4QY HG1 4QZ |
| Torrs Road | HG1 4TB |
| Tunstall Road | HG2 7RG |
| Tyson Place | HG2 7QB |
| Walworth Avenue | HG2 7QZ HG2 7RB |
| Wedderburn Avenue | HG2 7QR HG2 7QW |
| Wedderburn Drive | HG2 7QF |
| Wedderburn Road | HG2 7QG HG2 7QH HG2 7QQ |
| Wetherby Road | HG2 7SG HG2 7SH |
| Woodlands Avenue | HG2 7SJ |
| Woodlands Court | HG2 7SE |
| Woodlands Drive | HG2 7AT HG2 7AX |
Transport near Granby
- FAQ
- Price Paid By Year
- Property Type Price
Frequently asked questions about Granby
What is the average price for a property for sale in Granby?
The average price for a property for sale in Granby is £305,241. This amount is 23% lower than the average price in Harrogate. There are 2,036 property listings for sale in Granby.
What streets have the most expensive properties for sale in Granby?
The streets with the most expensive properties for sale in Granby are Woodlands Drive at an average of £480,333, Woodlands Avenue at an average of £449,286 and Lynton Gardens at an average of £448,900.
What streets have the most affordable properties for sale in Granby?
The streets with the most affordable properties for sale in Granby are Cawthorn Avenue at an average of £192,625, Slingsby Crescent at an average of £197,500 and St Nicholas Walk at an average of £205,000.
Which train stations are available in or near Granby?
Some of the train stations available in or near Granby are Starbeck, Harrogate and Hornbeam Park.
Property Price Paid in Granby by Year
The average sold property price by year was:
| Year | Average Sold Price | Price Change |
Sold Properties
|
|---|---|---|---|
| 2025 | £306,202 | 1% |
70 Properties |
| 2024 | £302,764 | -1% |
83 Properties |
| 2023 | £307,189 | -4% |
71 Properties |
| 2022 | £318,232 | 14% |
107 Properties |
| 2021 | £272,677 | 11% |
123 Properties |
| 2020 | £243,572 | -6% |
80 Properties |
| 2019 | £258,354 | -3% |
101 Properties |
| 2018 | £266,305 | 9% |
99 Properties |
| 2017 | £241,678 | 6% |
101 Properties |
| 2016 | £227,534 | 4% |
97 Properties |
| 2015 | £217,471 | 6% |
95 Properties |
| 2014 | £205,224 | 3% |
88 Properties |
| 2013 | £198,638 | 2% |
90 Properties |
| 2012 | £195,568 | 5% |
90 Properties |
| 2011 | £185,852 | -3% |
61 Properties |
| 2010 | £191,681 | 8% |
76 Properties |
| 2009 | £177,067 | 4% |
78 Properties |
| 2008 | £170,447 | -19% |
86 Properties |
| 2007 | £202,145 | 10% |
124 Properties |
| 2006 | £182,016 | 6% |
147 Properties |
| 2005 | £171,744 | 4% |
127 Properties |
| 2004 | £164,586 | 11% |
133 Properties |
| 2003 | £147,197 | 18% |
135 Properties |
| 2002 | £120,262 | 14% |
167 Properties |
| 2001 | £103,384 | 14% |
133 Properties |
| 2000 | £89,139 | 19% |
113 Properties |
| 1999 | £72,274 | 14% |
97 Properties |
| 1998 | £62,012 | -5% |
85 Properties |
| 1997 | £65,059 | 8% |
92 Properties |
| 1996 | £60,124 | 7% |
85 Properties |
| 1995 | £55,873 | - |
72 Properties |
Property Price per Property Type in Granby
Here you can find historic sold price data in order to help with your property search.
The average Property Paid Price for specific property types in the last three years are:
| Property Type | Average Sold Price | Sold Properties |
|---|---|---|
| Semi Detached House | £327,998.00 | 130 Semi Detached Houses |
| Detached House | £598,222.00 | 9 Detached Houses |
| Terraced House | £257,601.00 | 58 Terraced Houses |
| Flat | £200,352.00 | 27 Flats |

