
Houses for sale in North Yorkshire, England
House Prices in North Yorkshire
Properties in North Yorkshire have
an average house price of
£314k
and had 30,268 Property Transactions
within the last 3 years.¹
North Yorkshire is a location in
England with
275,360 households², where the most expensive property was sold for £25M.
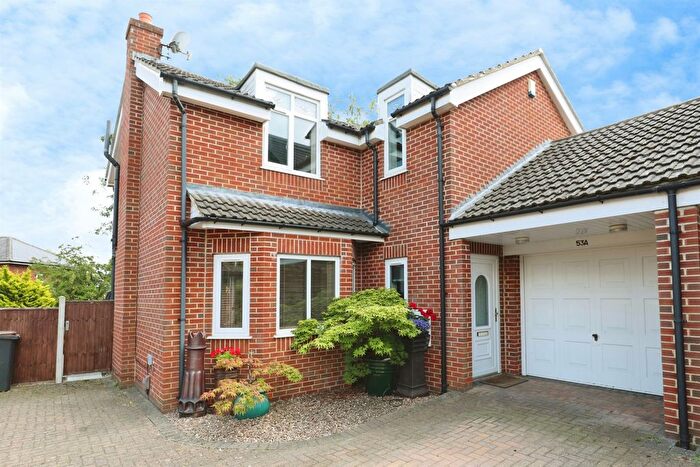
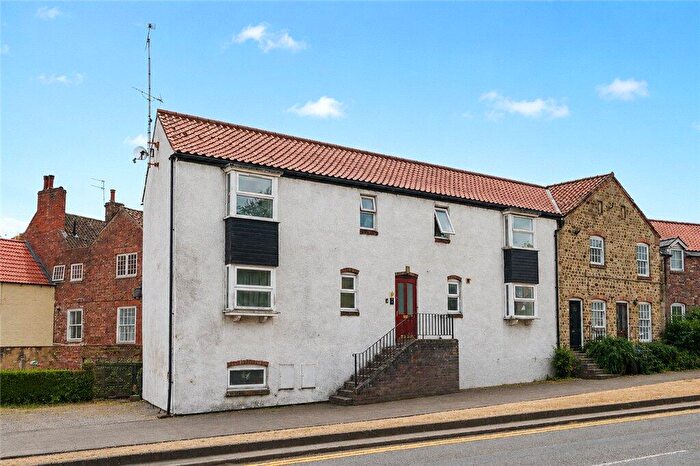
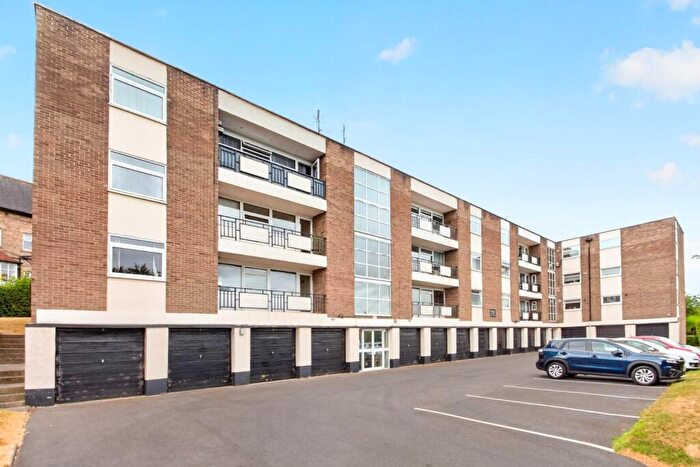
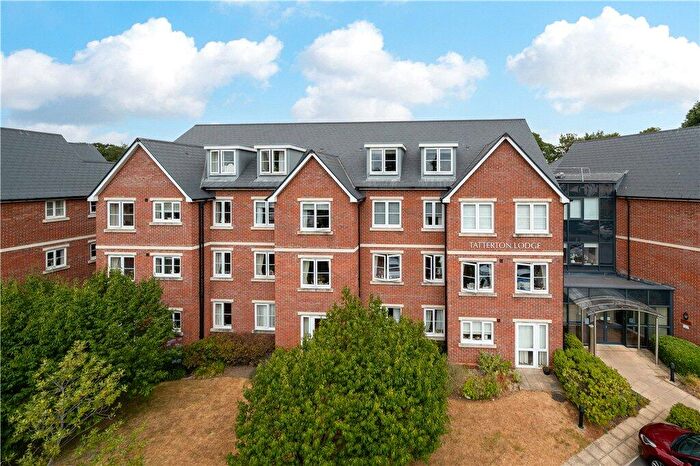
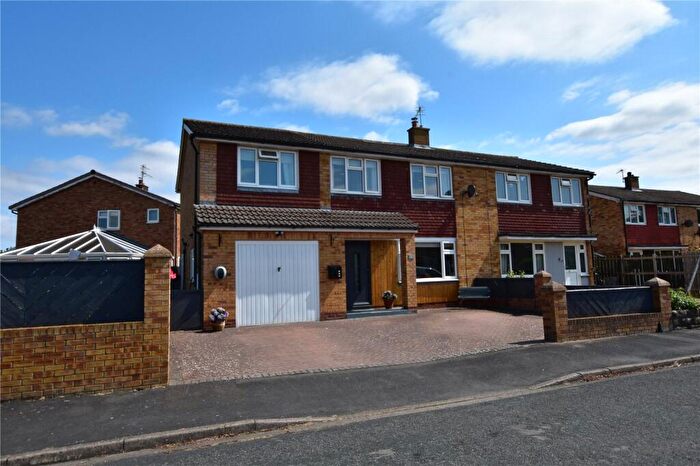
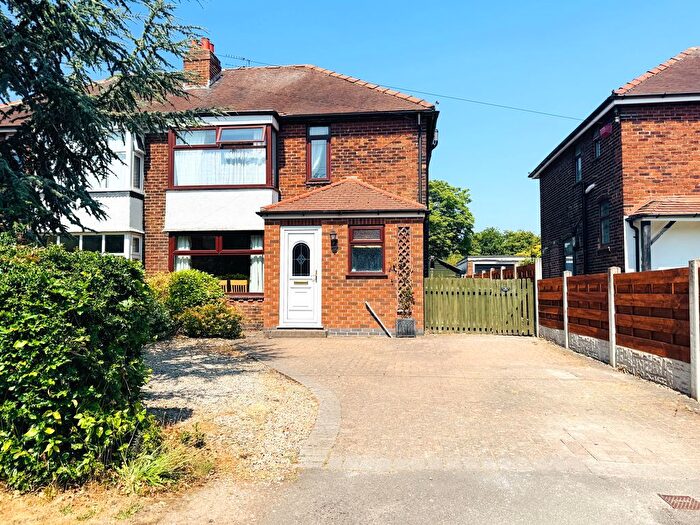
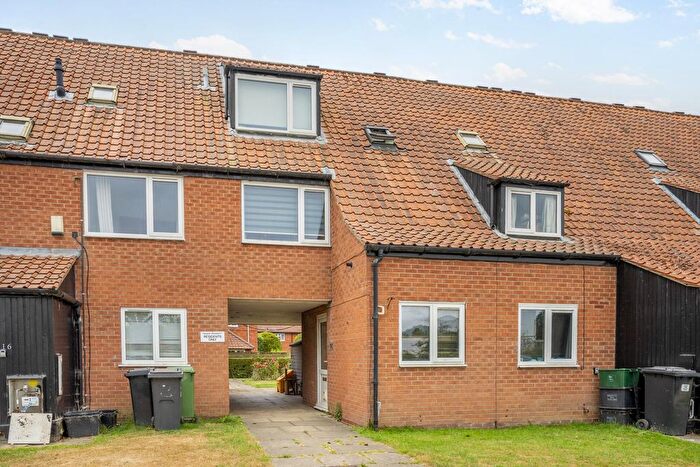
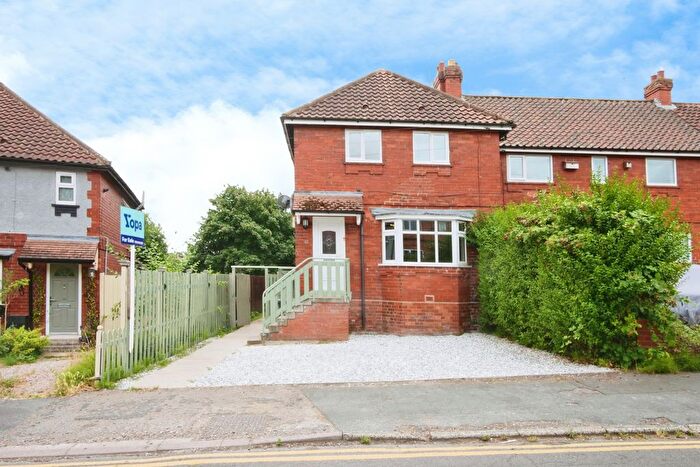
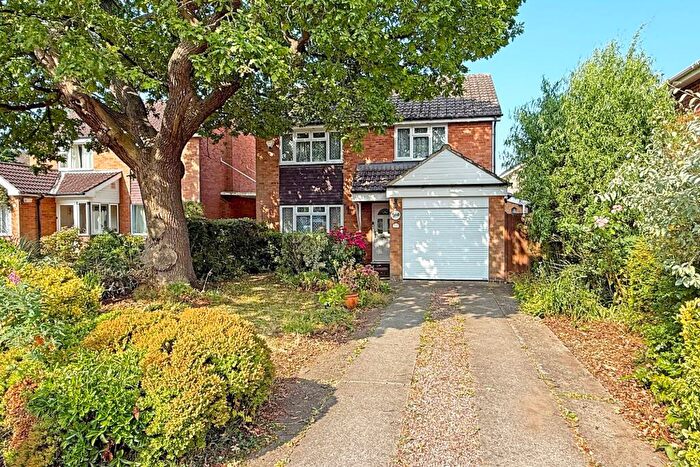
Properties for sale in North Yorkshire
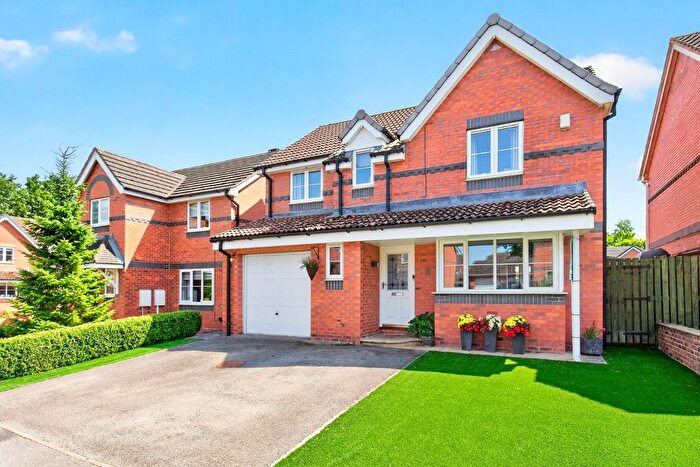
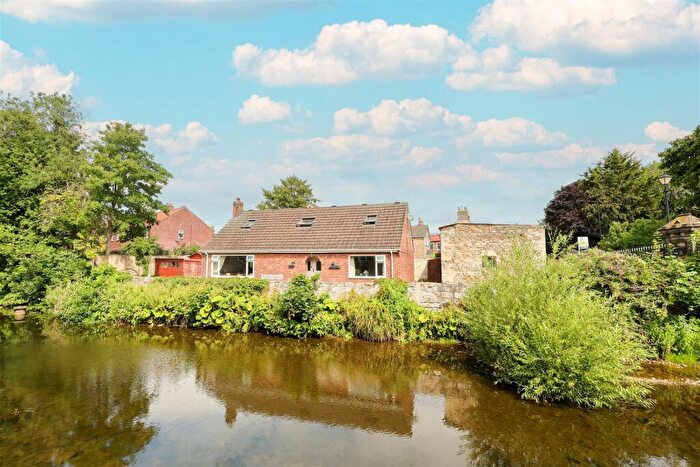
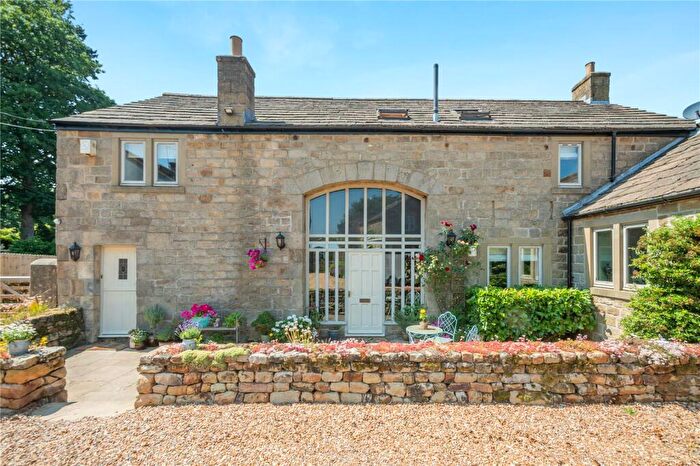
![]()
If you are looking to sell your house, let it out, or receive a property valuation, an expert can help you.
Click the button below to get started.
Towns in North Yorkshire
Navigate through our locations to find the location of your next house in North Yorkshire, England for sale or to rent.
- Sedbergh
- Ilkley
- Selby
- Otley
- Guisborough
- Saltburn-by-the-sea
- Harrogate
- Middlesbrough
- Keighley
- Bedale
- Goole
- Darlington
- Malton
- Pickering
- Northallerton
- Carnforth
- Thirsk
- Ripon
- Scarborough
- Redcar
- Catterick Garrison
- Knaresborough
- Hawes
- Lancaster
- Barnoldswick
- Driffield
- York
- Leeds
- Stockton-on-Tees
- Tadcaster
- Knottingley
- Doncaster
- Settle
- Wetherby
- Leyburn
- Yarm
- Whitby
- Skipton
- Barnard Castle
- Richmond
- Pontefract
- Filey
Property price trends in North Yorkshire
According to the latest Land Registry data, the average home in North Yorkshire sold for £310,668 in 2026. That figure comes from a substantial record of 350,528 sales logged over the past 31 years.
Prices have held fairly steady over the last three years. Compared with 2023, when the typical sale came in around £311,652, values are broadly unchanged.
Looking back five years, average prices are up about 4.2% since 2021, a gain of around £12,664 in cash terms.
Zoom out to the past decade for the fuller picture. Back in 2016, homes here averaged £237,184, so the typical sold price has climbed about 31% since then, roughly 2.7% a year. Stretch the view to fifteen years and that annual pace eases back to about 2.4%.
Frequently asked questions about North Yorkshire
What is the average price for a property for sale in North Yorkshire?
The average price for a property for sale in North Yorkshire is £314,131. This amount is 13% lower than the average price in England. There are more than 10,000 property listings for sale in North Yorkshire.
What locations have the most expensive properties for sale in North Yorkshire?
The locations with the most expensive properties for sale in North Yorkshire are Ilkley at an average of £882,938, Otley at an average of £757,395 and Wetherby at an average of £596,593.
What locations have the most affordable properties for sale in North Yorkshire?
The locations with the most affordable properties for sale in North Yorkshire are Catterick Garrison at an average of £169,231, Scarborough at an average of £205,690 and Filey at an average of £225,968.
Which train stations are available in or near North Yorkshire?
Some of the train stations available in or near North Yorkshire are Thirsk, Cattal and Hammerton.
Property Price Paid in North Yorkshire by Year
The average sold property price by year was:
| Year | Average Sold Price | Price Change |
Sold Properties
|
|---|---|---|---|
| 2026 | £310,668 | -2% |
1,879 Properties |
| 2025 | £316,595 | 1% |
9,534 Properties |
| 2024 | £314,716 | 1% |
9,714 Properties |
| 2023 | £311,652 | -0,3% |
9,141 Properties |
| 2022 | £312,502 | 5% |
11,015 Properties |
| 2021 | £298,004 | 8% |
14,234 Properties |
| 2020 | £274,495 | 7% |
10,724 Properties |
| 2019 | £255,843 | 3% |
12,210 Properties |
| 2018 | £249,308 | 1% |
12,060 Properties |
| 2017 | £247,752 | 4% |
12,458 Properties |
Property Price per Property Type in North Yorkshire
Here you can find historic sold price data in order to help with your property search.
The average Property Paid Price for specific property types in the last three years are:
| Property Type | Average Sold Price | Sold Properties |
|---|---|---|
| Semi Detached House | £278,599.00 | 8,968 Semi Detached Houses |
| Terraced House | £229,920.00 | 8,373 Terraced Houses |
| Detached House | £475,972.00 | 9,205 Detached Houses |
| Flat | £188,931.00 | 3,722 Flats |
Transport in North Yorkshire
Please see below transportation links in this area:
