
Houses for sale & to rent in HG3 5RR, Pateley Bridge, Harrogate
House Prices in HG3 5RR, Pateley Bridge
Properties in HG3 5RR have no sales history available within the last 3 years. HG3 5RR is a postcode in Pateley Bridge, an area in Harrogate, North Yorkshire, with 2 households².
Previously listed properties near HG3 5RR
![]()
If you are looking to sell your house, let it out, or receive a property valuation, an expert can help you.
Click the button below to get started.


Price Paid in HG3 5RR, Pateley Bridge
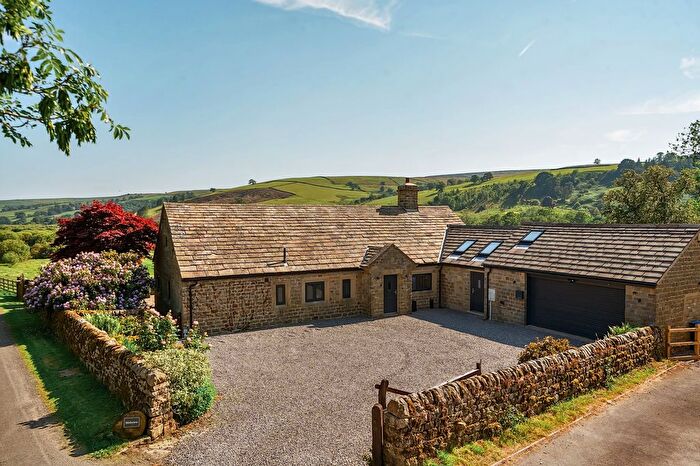
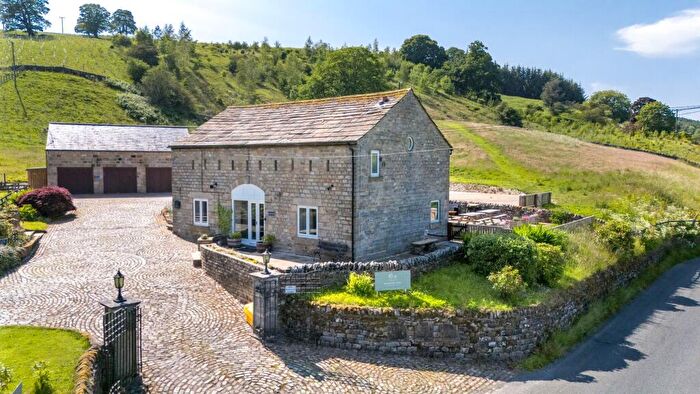
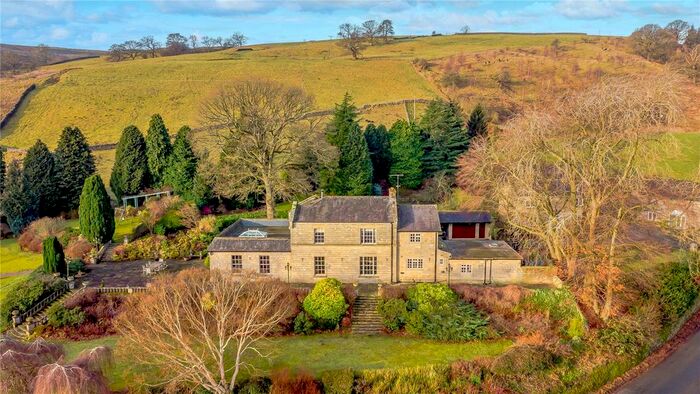
FOUNTAINS HOUSE HG3 5RR, Pateley Bridge Harrogate
Property FOUNTAINS HOUSE has been sold 3 times. The last time it was sold was in 27/05/2021 and the sold price was £1,050,000.00.
This detached house, sold as a freehold on 27/05/2021, is a 263 sqm detached house with an EPC rating of F.
| Date | Price | Property Type | Tenure | Classification |
|---|---|---|---|---|
| 27/05/2021 | £1,050,000.00 | Detached House | freehold | Established Building |
| 01/02/2016 | £900,000.00 | Detached House | freehold | Established Building |
| 31/01/2008 | £925,000.00 | Detached House | freehold | Established Building |
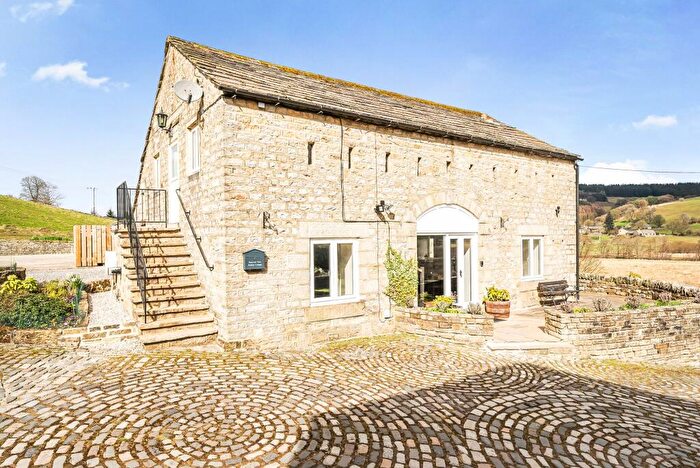
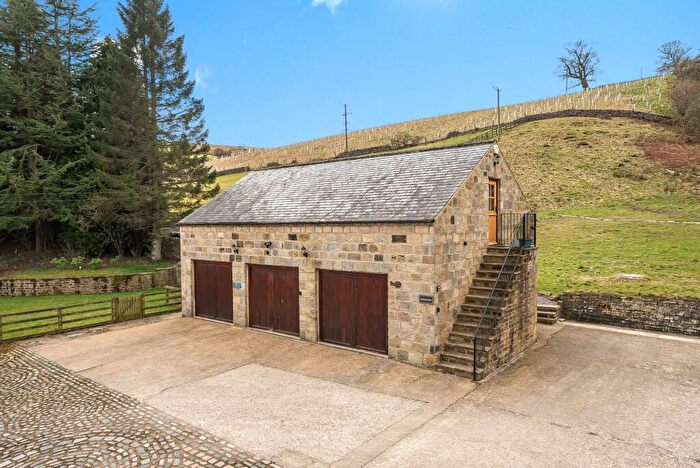
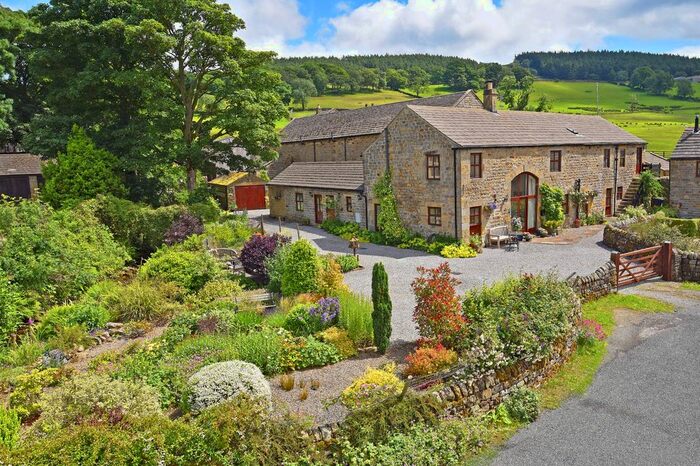
HOLLIN HOUSE BARN HG3 5RR, Pateley Bridge Harrogate
Property HOLLIN HOUSE BARN has been sold 1 time. The last time it was sold was in 22/01/2016 and the sold price was £172,540.00.
This is a Detached House which was sold as a freehold in 22/01/2016
| Date | Price | Property Type | Tenure | Classification |
|---|---|---|---|---|
| 22/01/2016 | £172,540.00 | Detached House | freehold | Established Building |
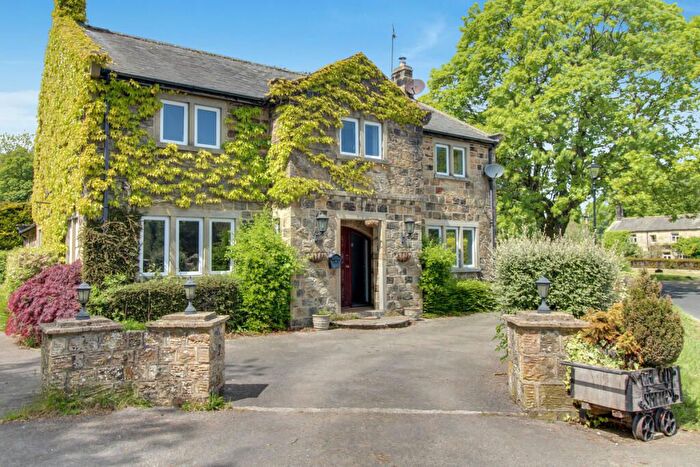
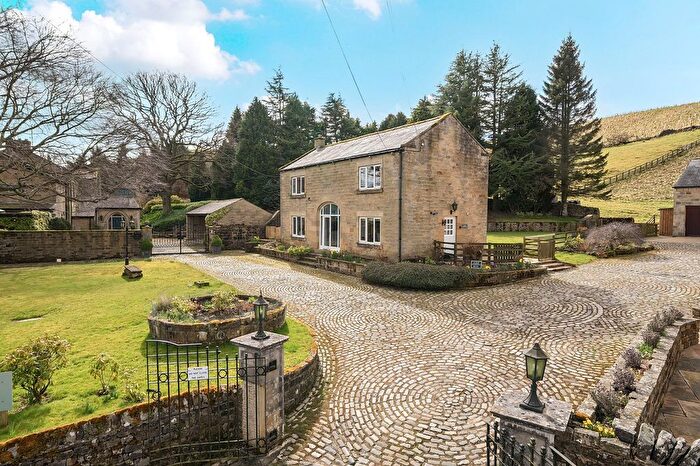
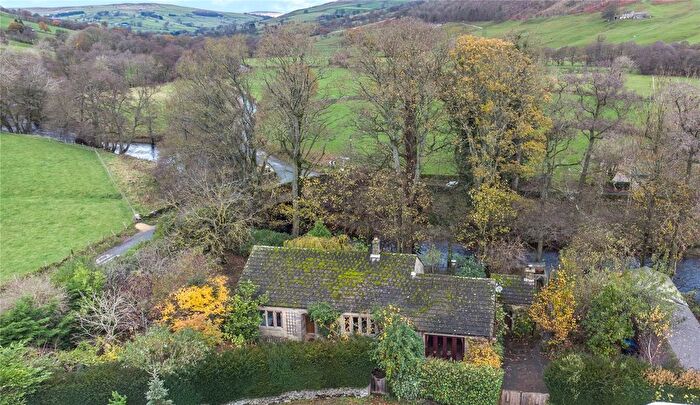
HOLLIN HOUSE HG3 5RR, Pateley Bridge Harrogate
Property HOLLIN HOUSE has been sold 1 time. The last time it was sold was in 27/11/2015 and the sold price was £335,000.00.
This detached house, sold as a freehold on 27/11/2015, is a 145 sqm detached house with an EPC rating of E.
| Date | Price | Property Type | Tenure | Classification |
|---|---|---|---|---|
| 27/11/2015 | £335,000.00 | Detached House | freehold | Established Building |
Transport near HG3 5RR

House price paid reports for HG3 5RR
Click on the buttons below to see price paid reports by year or property price:
- Price Paid By Year
Property Price Paid in HG3 5RR by Year
The average sold property price by year was:
| Year | Average Sold Price | Price Change |
Sold Properties
|
|---|---|---|---|
| 2021 | £1,050,000 | 49% |
1 Property |
| 2016 | £536,270 | 38% |
2 Properties |
| 2015 | £335,000 | -176% |
1 Property |
| 2008 | £925,000 | - |
1 Property |