Houses for sale & to rent in Washburn, Ilkley
House Prices in Washburn
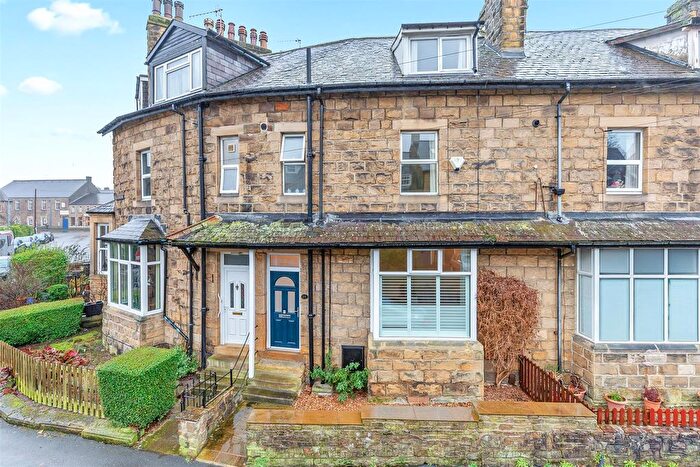
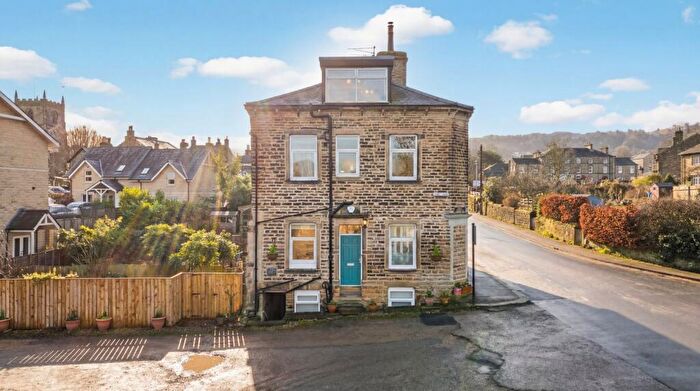
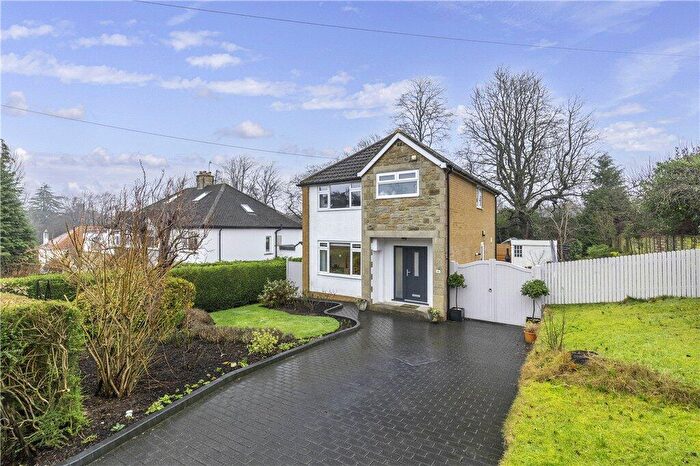
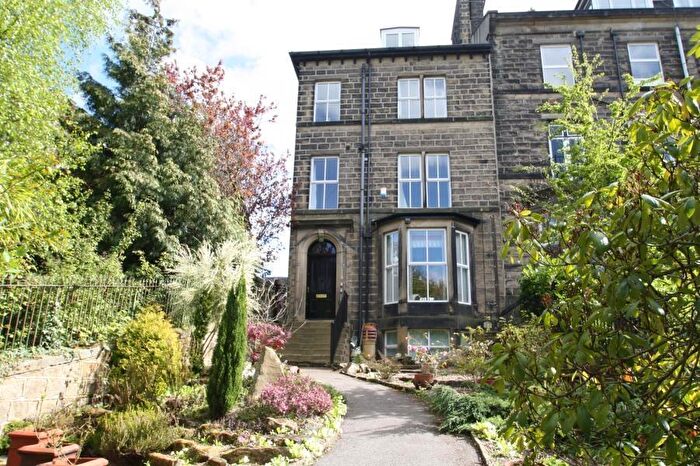
Properties in Washburn have an average house price of £882,938.00 and had 12 Property Transactions within the last 3 years¹.
Washburn is an area in Ilkley, North Yorkshire with 156 households², where the most expensive property was sold for £1,615,000.00.
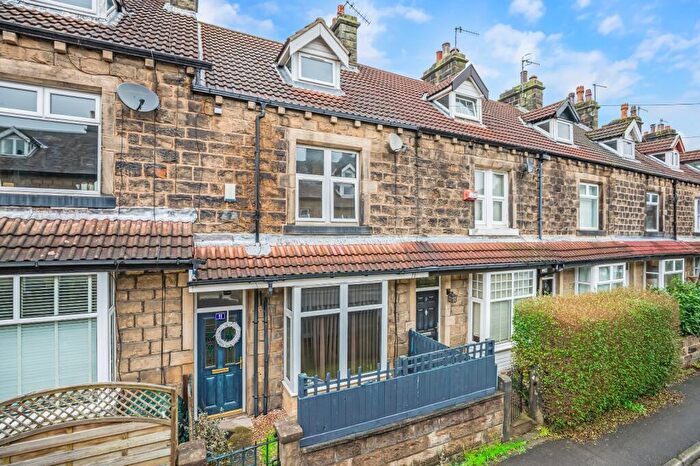
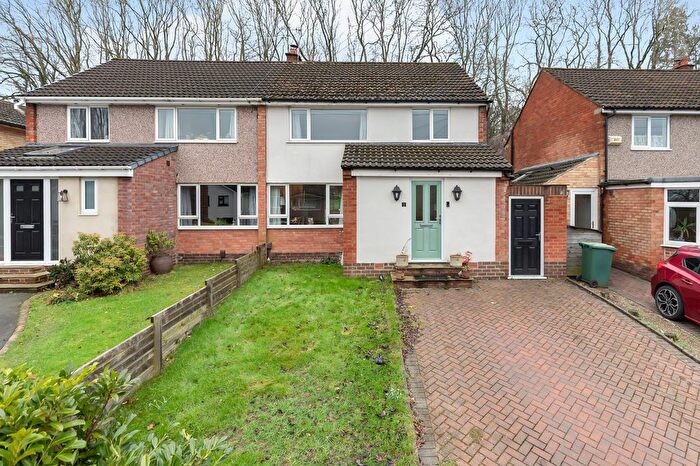
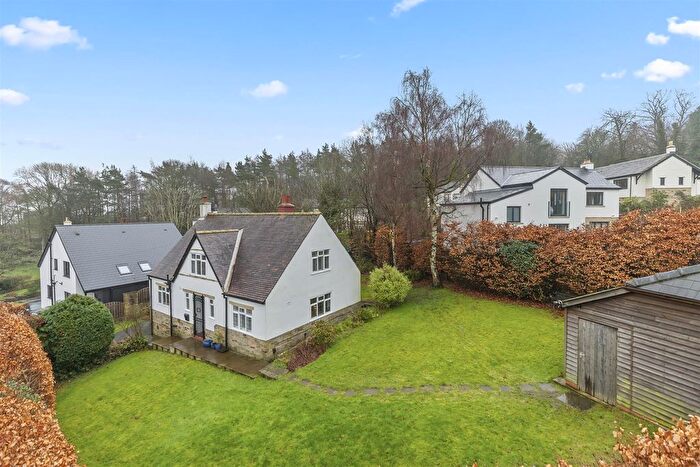
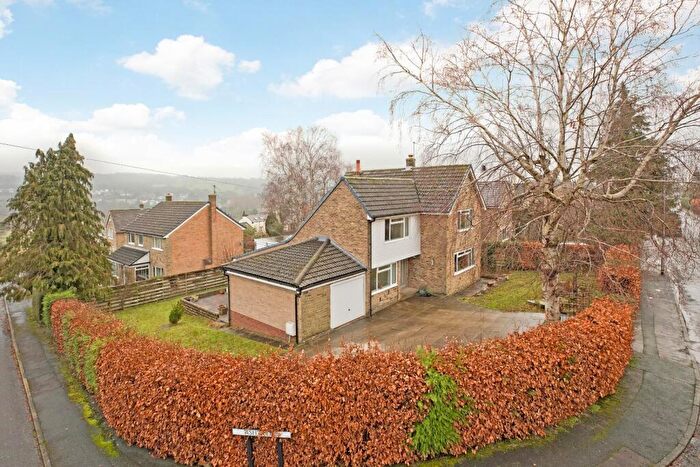
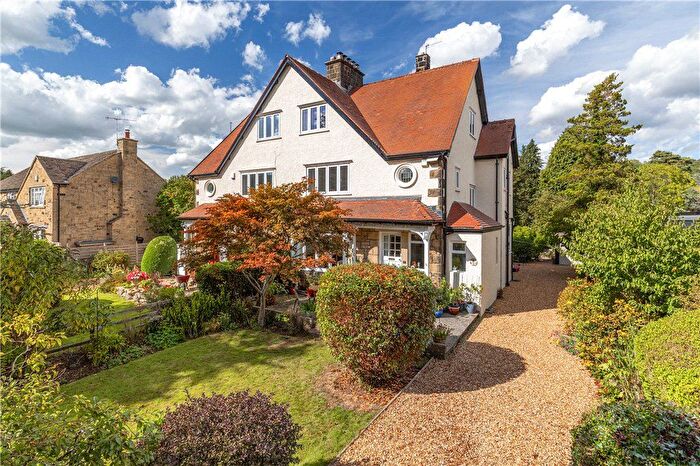
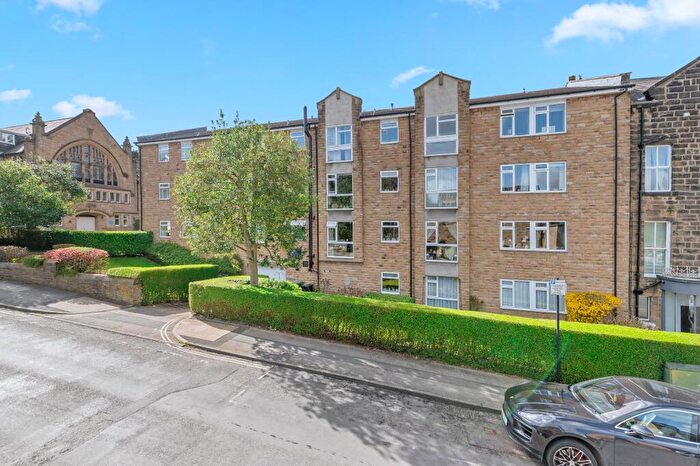
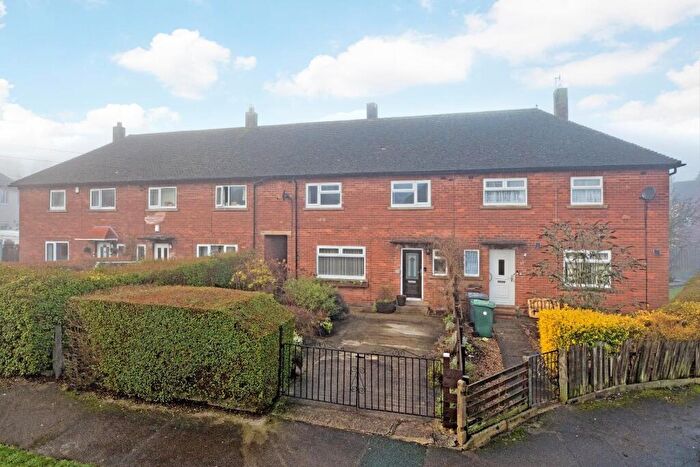
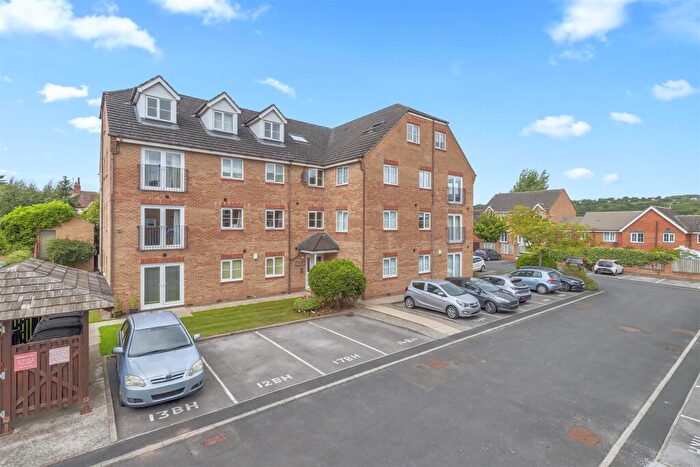
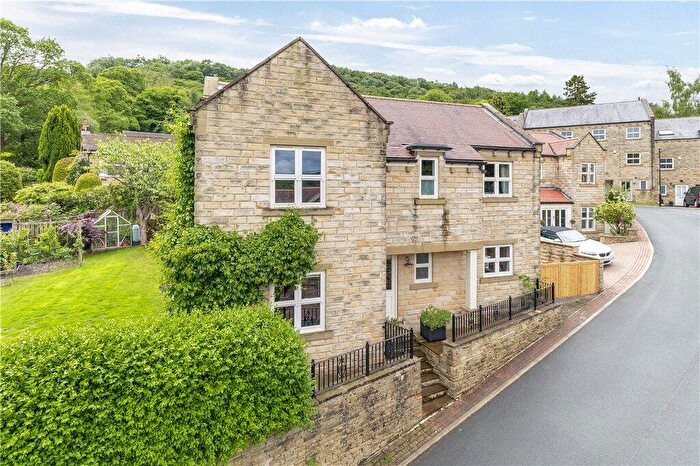
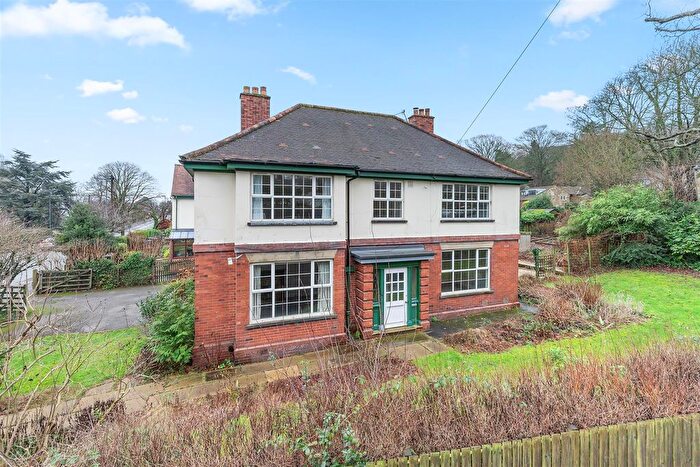
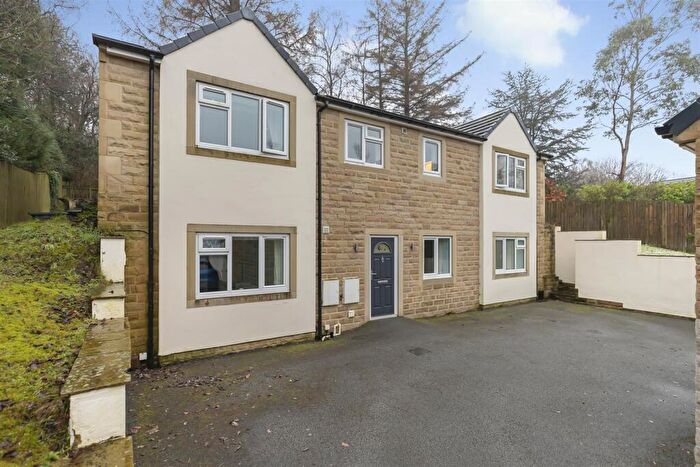
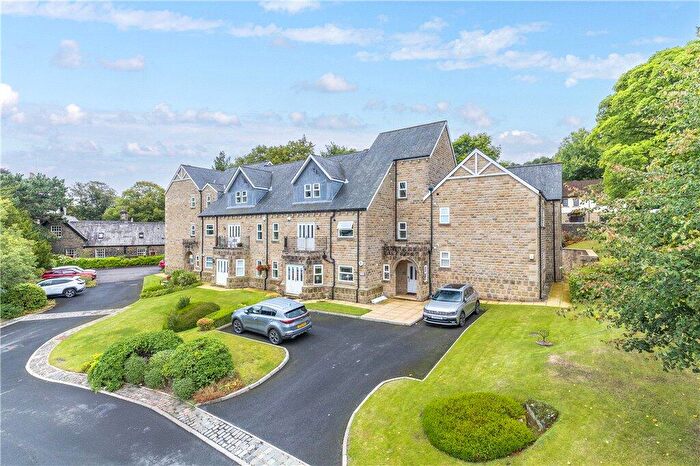
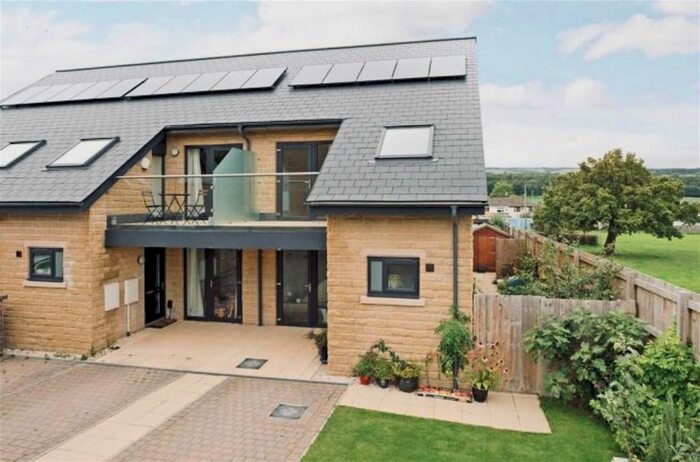
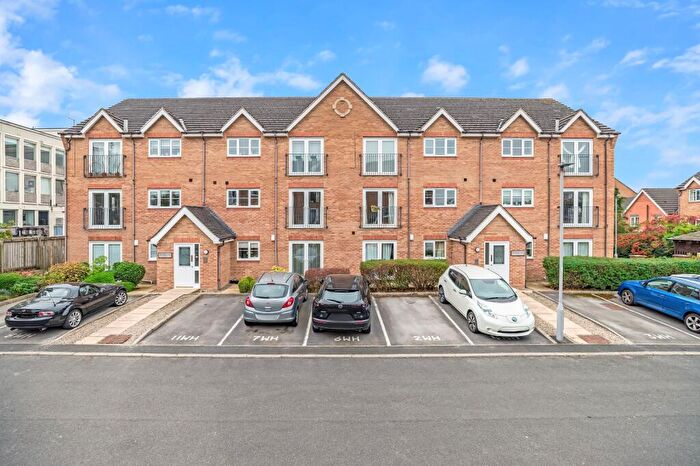
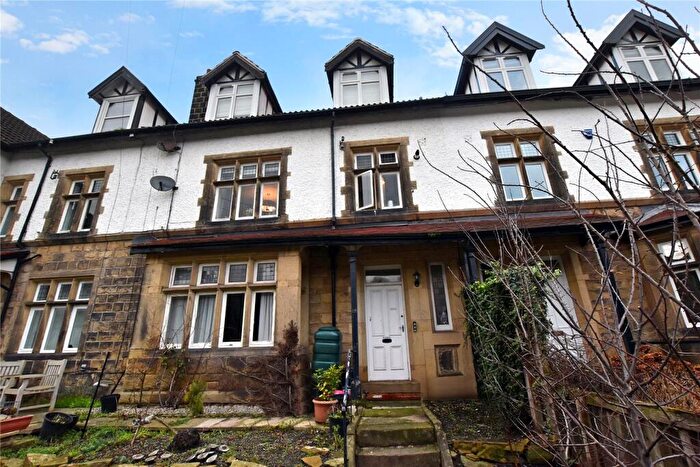
Properties for sale in Washburn
Roads and Postcodes in Washburn
Navigate through our locations to find the location of your next house in Washburn, Ilkley for sale or to rent.
| Streets | Postcodes |
|---|---|
| Briggate | LS29 0BS |
| Carters Lane | LS29 0DQ |
| Chapel Cottages | LS29 0EN |
| Church Row | LS29 0HQ |
| Hathenshaw Lane | LS29 0HR |
| Hunger Hill Road | LS29 0DL LS29 0DN LS29 0DP LS29 0DW |
| Ling Park | LS29 0EJ |
| Nesfield Road | LS29 0BL |
| School Row | LS29 0HG |
| Smithy Lane | LS29 0HJ |
| Viewlands | LS29 0DR |
| LS29 0BJ LS29 0BN LS29 0BU LS29 0BX LS29 0EG LS29 0ET LS29 0EU LS29 0EW LS29 0HE LS29 0HW LS29 0BP LS29 0BT LS29 0BW LS29 0EF LS29 0EH LS29 0EL LS29 0EP LS29 0EQ LS29 0ES LS29 0HD LS29 0HF LS29 0HH LS29 0HL LS29 0HN LS29 0HP LS29 0HS LS29 0HT LS29 0HU |
Transport near Washburn
- FAQ
- Price Paid By Year
- Property Type Price
Frequently asked questions about Washburn
What is the average price for a property for sale in Washburn?
The average price for a property for sale in Washburn is £882,938. There are 1,902 property listings for sale in Washburn.
What streets have the most expensive properties for sale in Washburn?
The street with the most expensive properties for sale in Washburn is Hunger Hill Road at an average of £681,656.
What streets have the most affordable properties for sale in Washburn?
The street with the most affordable properties for sale in Washburn is Briggate at an average of £677,500.
Which train stations are available in or near Washburn?
Some of the train stations available in or near Washburn are Ilkley, Ben Rhydding and Burley-In-Wharfedale.
Property Price Paid in Washburn by Year
The average sold property price by year was:
| Year | Average Sold Price | Price Change |
Sold Properties
|
|---|---|---|---|
| 2025 | £680,000 | -39% |
2 Properties |
| 2024 | £947,662 | 5% |
5 Properties |
| 2023 | £899,390 | 23% |
5 Properties |
| 2022 | £692,895 | 17% |
5 Properties |
| 2021 | £573,571 | 14% |
7 Properties |
| 2020 | £491,666 | 22% |
3 Properties |
| 2019 | £382,464 | -72% |
9 Properties |
| 2018 | £658,766 | 20% |
3 Properties |
| 2017 | £523,875 | -11% |
4 Properties |
| 2016 | £583,250 | -20% |
6 Properties |
| 2015 | £701,666 | 1% |
3 Properties |
| 2014 | £695,000 | -17% |
4 Properties |
| 2013 | £810,000 | -28% |
1 Property |
| 2012 | £1,038,000 | 7% |
2 Properties |
| 2011 | £967,250 | 28% |
2 Properties |
| 2010 | £697,666 | 46% |
6 Properties |
| 2009 | £375,833 | -34% |
3 Properties |
| 2008 | £504,000 | 22% |
2 Properties |
| 2007 | £395,000 | -33% |
1 Property |
| 2006 | £524,166 | 6% |
3 Properties |
| 2005 | £490,250 | 24% |
2 Properties |
| 2004 | £371,000 | 34% |
5 Properties |
| 2003 | £246,451 | -96% |
3 Properties |
| 2002 | £484,083 | 24% |
6 Properties |
| 2001 | £366,665 | 6% |
6 Properties |
| 2000 | £345,125 | 23% |
4 Properties |
| 1999 | £264,501 | 52% |
7 Properties |
| 1998 | £127,666 | -31% |
3 Properties |
| 1997 | £167,666 | -98% |
3 Properties |
| 1996 | £332,500 | 64% |
2 Properties |
| 1995 | £118,500 | - |
4 Properties |
Property Price per Property Type in Washburn
Here you can find historic sold price data in order to help with your property search.
The average Property Paid Price for specific property types in the last three years are:
| Property Type | Average Sold Price | Sold Properties |
|---|---|---|
| Semi Detached House | £617,631.00 | 2 Semi Detached Houses |
| Detached House | £997,500.00 | 8 Detached Houses |
| Terraced House | £690,000.00 | 2 Terraced Houses |

