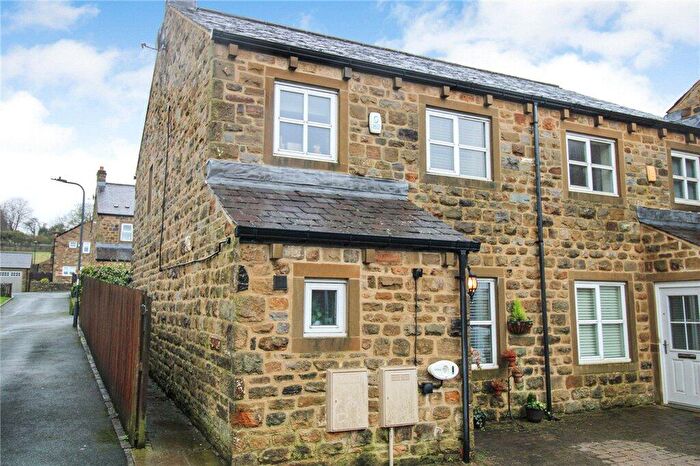
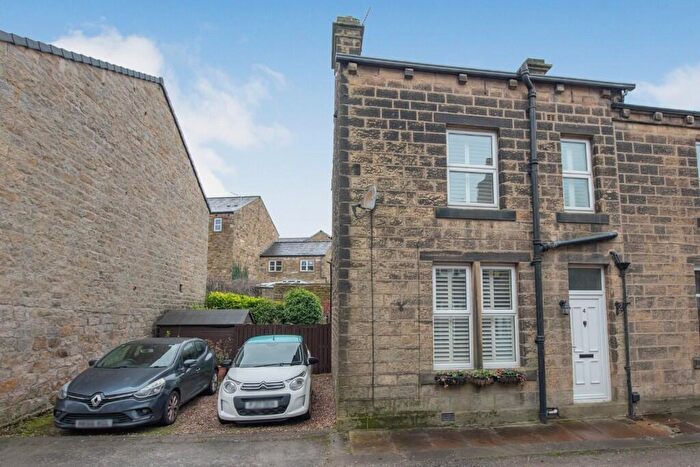
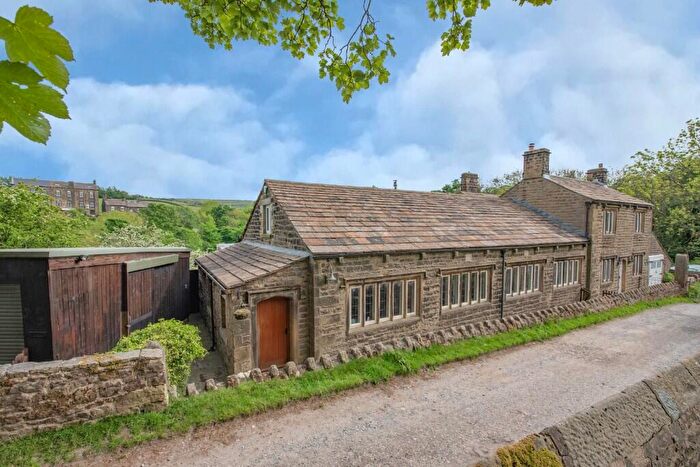
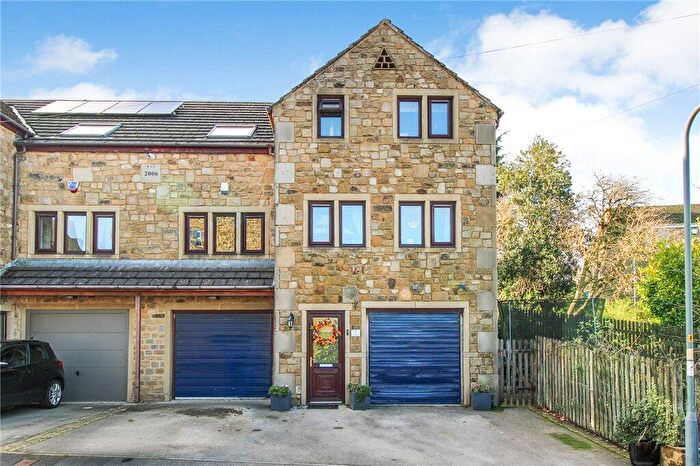
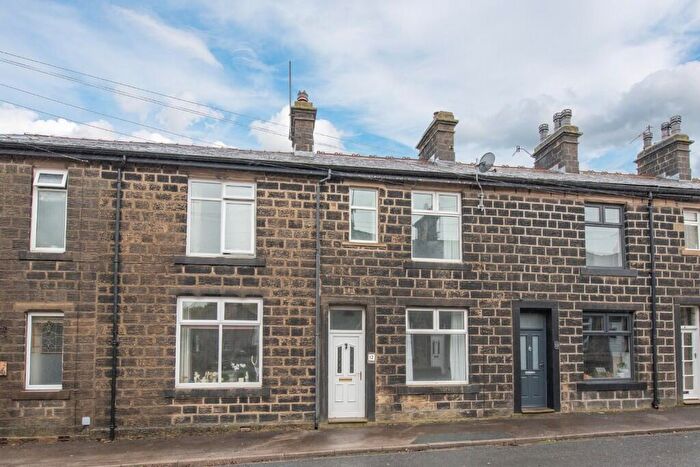
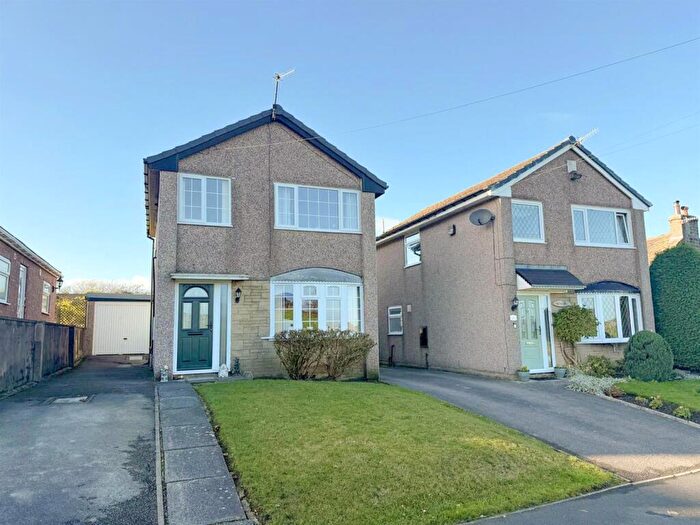
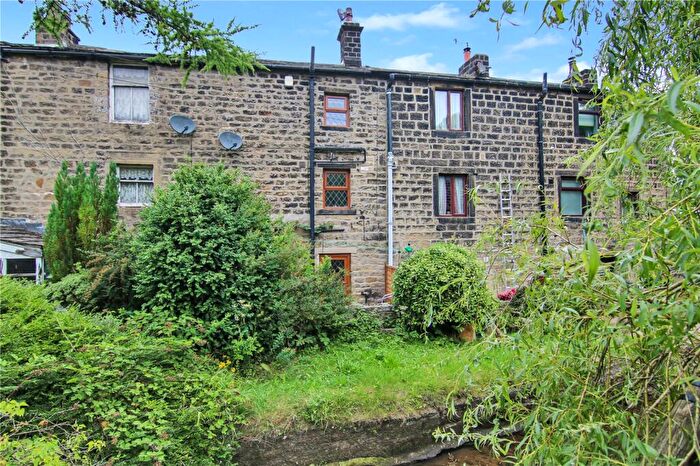
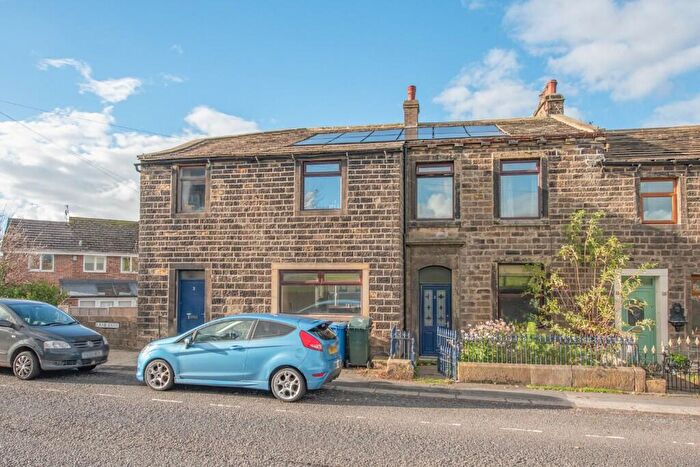
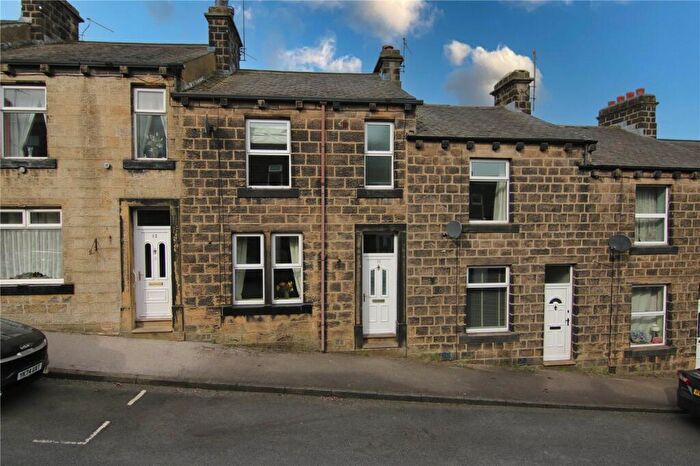
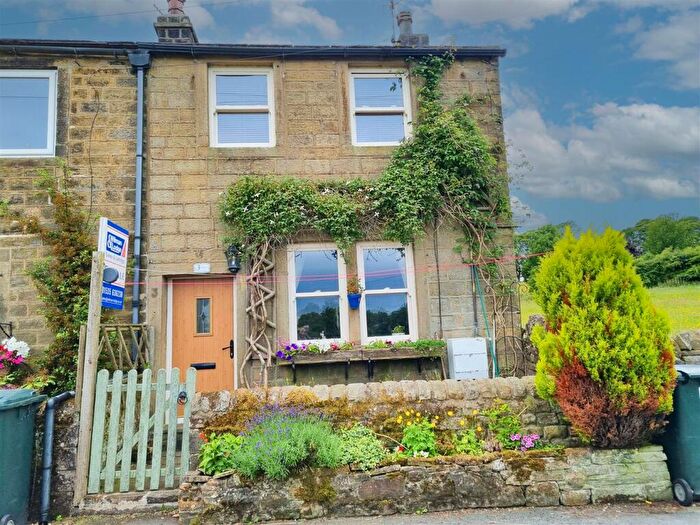
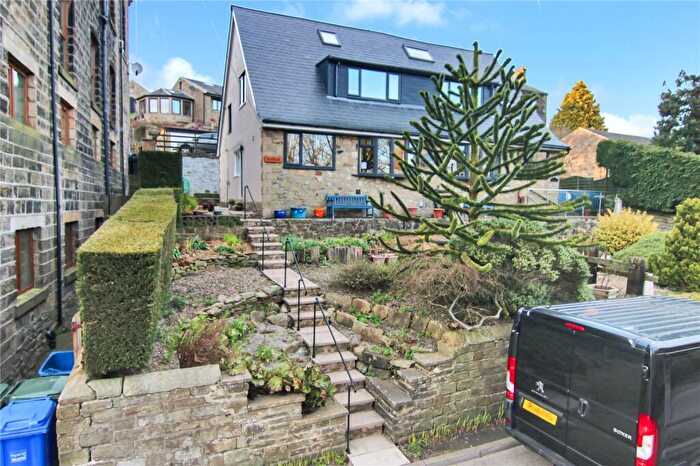
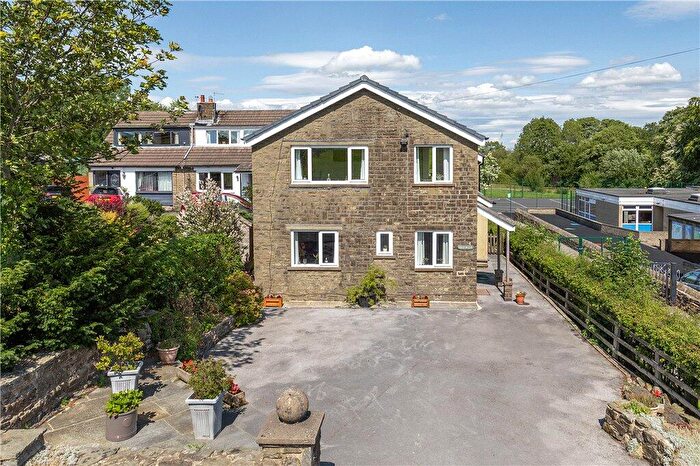
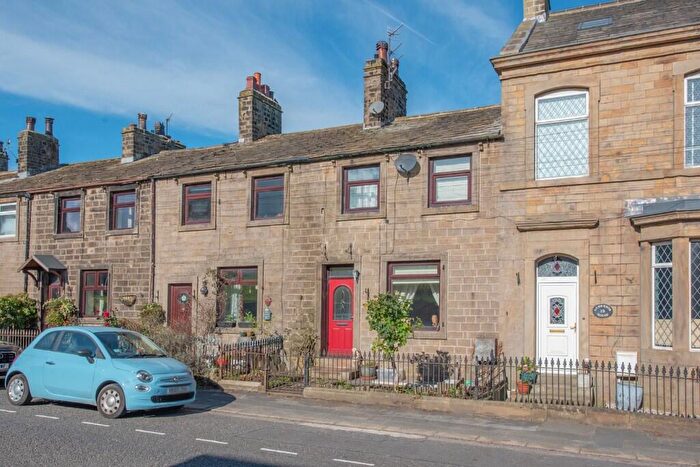
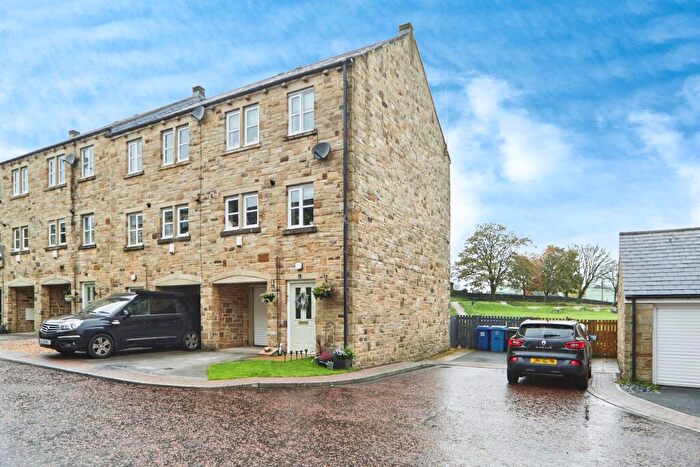
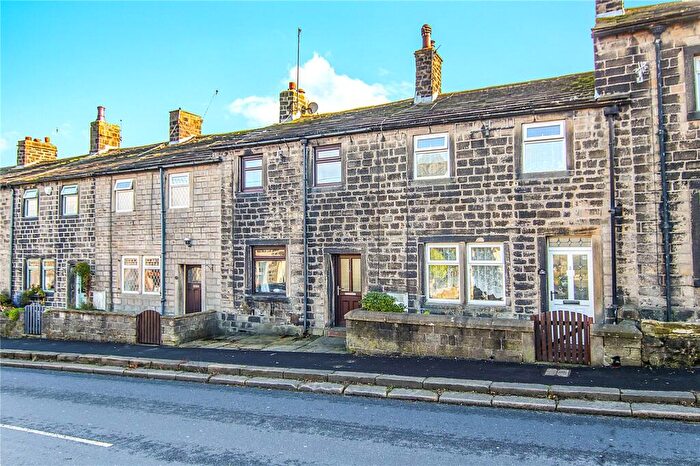
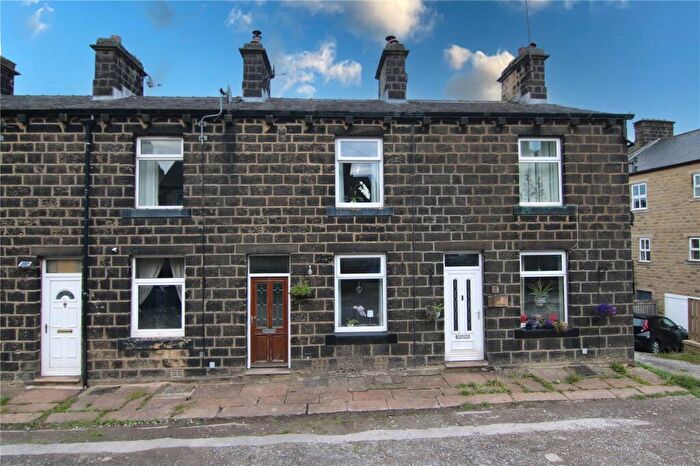
Houses for sale & to rent in Cowling, Keighley
House Prices in Cowling
Properties in Cowling have an average house price of £231,026.00 and had 121 Property Transactions within the last 3 years¹.
Cowling is an area in Keighley, North Yorkshire with 979 households², where the most expensive property was sold for £750,000.00.
Properties for sale in Cowling
Previously listed properties in Cowling
Roads and Postcodes in Cowling
Navigate through our locations to find the location of your next house in Cowling, Keighley for sale or to rent.
| Streets | Postcodes |
|---|---|
| Acre Meadow | BD22 0EG |
| Acre Mews | BD22 0FP |
| Acre Road | BD22 0FN |
| Bannister Walk | BD22 0NU |
| Carr Head Lane | BD20 8DX BD22 0LD |
| Carr Meadows | BD22 0BR |
| Close Lane | BD22 0NZ |
| Collinge Road | BD22 0AG |
| Colne Road | BD22 0BZ BD22 0NN |
| Cowling Hill | BD22 0LP |
| Craiglands | BD22 0BD |
| Craven Court | BD22 0SJ |
| Cross Street | BD22 0AY |
| Dick Lane | BD22 0JZ |
| Earl Crag View | BD22 0NG |
| Farling Top | BD22 0NW |
| Fold Lane | BD22 0BG BD22 0BQ |
| Freegate | BD22 0DJ |
| Garden Terrace | BD22 0AD |
| Gibb Street | BD22 0BJ |
| Gill Lane | BD22 0DD BD22 0DF BD22 0LT |
| Gill Top | BD22 0LU |
| Glenroyd Terrace | BD22 0DG |
| Green Street | BD22 0AT BD22 0DX |
| Hartley Place | BD22 0AU |
| Holme House Lane | BD22 0FD |
| Ickornshaw | BD22 0DB BD22 0DE BD22 0DH |
| Keighley Road | BD22 0AA BD22 0AB BD22 0AF BD22 0AH BD22 0AL BD22 0AS BD22 0AW BD22 0BA BD22 0BE BD22 0BH BD22 0BX BD22 0BY BD22 0HG BD22 0JX BD22 0LA |
| Lane Ends | BD22 0JY |
| Lane Ends Lane | BD22 0NX |
| Laycock Fields | BD22 0DN |
| Lingcrag Gardens | BD22 0AN |
| Lumb Lane | BD22 0NF |
| Manor Park | BD22 0DW |
| Middleton | BD22 0DQ |
| Mill Croft | BD22 0AJ |
| Mire Close Lane | BD22 0LE BD22 0LQ |
| Nan Scar | BD22 0DL |
| Old Oakworth Road | BD22 0NP BD22 0NR |
| Pad Cote Lane | BD22 0FA BD22 0NY |
| Park Lane | BD22 0NH BD22 0NL |
| Park Lane Bottom | BD22 0ND |
| Park Lane Cottages | BD22 0NQ |
| Park Road | BD22 0BP |
| Pinnacle View | BD22 0DR |
| Queen Street | BD22 0BL |
| Royd Street | BD22 0BN |
| Scar View | BD22 0BW |
| Shop Lane | BD22 0LS |
| Spring Gardens | BD22 0AX |
| Springwell Close | BD22 0AP |
| Sun Street | BD22 0BB |
| The Old Saw Mill | BD22 0JT |
| Victoria Road | BD22 0AR |
| Wainmans Close | BD22 0NT |
| Walton Street | BD22 0AZ |
| West View | BD22 0AQ |
| Winkholme | BD22 0DA |
| Woodland Street | BD22 0BS |
| BD22 0LH BD22 0LJ BD22 0LL BD22 0LX BD22 0LY BD22 0LZ BD22 0NA BD22 0NB BD22 0NJ BD22 0AE BD22 0FB BD22 0LN BD22 0LR BD22 0NS |
Transport near Cowling
-
Cononley Station
-
Steeton and Silsden Station
-
Skipton Station
-
Colne Station
-
Keighley Station
-
Gargrave Station
-
Nelson Station
-
Crossflatts Station
-
Brierfield Station
-
Bingley Station
- FAQ
- Price Paid By Year
- Property Type Price
Frequently asked questions about Cowling
What is the average price for a property for sale in Cowling?
The average price for a property for sale in Cowling is £231,026. This amount is 16% lower than the average price in Keighley. There are 159 property listings for sale in Cowling.
What streets have the most expensive properties for sale in Cowling?
The streets with the most expensive properties for sale in Cowling are Park Lane at an average of £662,000, Old Oakworth Road at an average of £652,500 and Pad Cote Lane at an average of £615,000.
What streets have the most affordable properties for sale in Cowling?
The streets with the most affordable properties for sale in Cowling are Green Street at an average of £130,000, Nan Scar at an average of £145,166 and Winkholme at an average of £151,750.
Which train stations are available in or near Cowling?
Some of the train stations available in or near Cowling are Cononley, Steeton and Silsden and Skipton.
Property Price Paid in Cowling by Year
The average sold property price by year was:
| Year | Average Sold Price | Price Change |
Sold Properties
|
|---|---|---|---|
| 2025 | £239,579 | -0,5% |
42 Properties |
| 2024 | £240,711 | 13% |
44 Properties |
| 2023 | £208,588 | -2% |
35 Properties |
| 2022 | £213,416 | -23% |
36 Properties |
| 2021 | £263,215 | 29% |
63 Properties |
| 2020 | £188,032 | 13% |
44 Properties |
| 2019 | £163,964 | -10% |
47 Properties |
| 2018 | £180,698 | -20% |
46 Properties |
| 2017 | £217,486 | 8% |
53 Properties |
| 2016 | £200,562 | 7% |
58 Properties |
| 2015 | £186,382 | 15% |
57 Properties |
| 2014 | £158,040 | 3% |
43 Properties |
| 2013 | £153,304 | -6% |
43 Properties |
| 2012 | £163,093 | -7% |
42 Properties |
| 2011 | £174,052 | -15% |
26 Properties |
| 2010 | £199,839 | 3% |
29 Properties |
| 2009 | £194,814 | 15% |
30 Properties |
| 2008 | £164,916 | 3% |
43 Properties |
| 2007 | £159,864 | -5% |
64 Properties |
| 2006 | £168,433 | 4% |
80 Properties |
| 2005 | £161,961 | 18% |
65 Properties |
| 2004 | £133,409 | 8% |
72 Properties |
| 2003 | £123,166 | 23% |
85 Properties |
| 2002 | £94,889 | 17% |
97 Properties |
| 2001 | £79,073 | 18% |
68 Properties |
| 2000 | £64,661 | 5% |
59 Properties |
| 1999 | £61,517 | 8% |
73 Properties |
| 1998 | £56,862 | 10% |
37 Properties |
| 1997 | £51,192 | -7% |
52 Properties |
| 1996 | £54,879 | 15% |
35 Properties |
| 1995 | £46,779 | - |
40 Properties |
Property Price per Property Type in Cowling
Here you can find historic sold price data in order to help with your property search.
The average Property Paid Price for specific property types in the last three years are:
| Property Type | Average Sold Price | Sold Properties |
|---|---|---|
| Semi Detached House | £305,480.00 | 30 Semi Detached Houses |
| Detached House | £371,666.00 | 9 Detached Houses |
| Terraced House | £189,029.00 | 79 Terraced Houses |
| Flat | £170,500.00 | 3 Flats |

