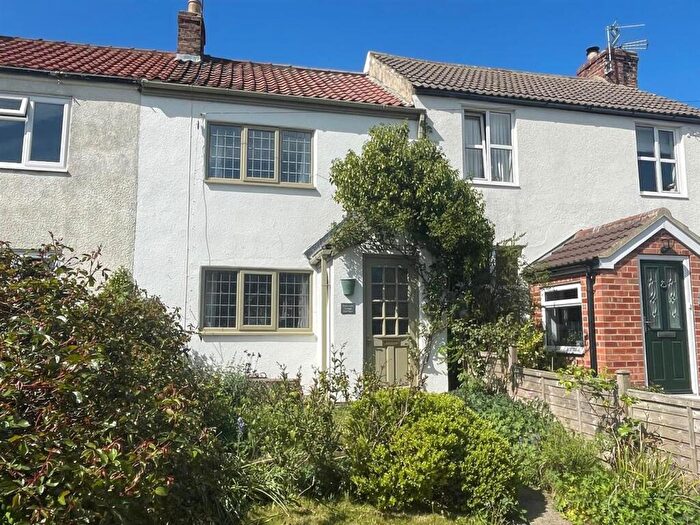
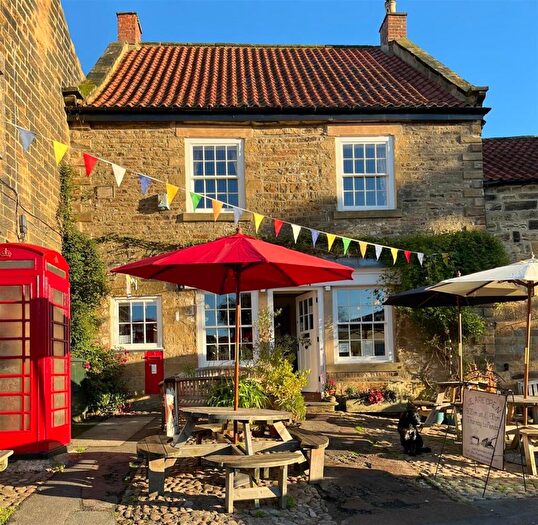
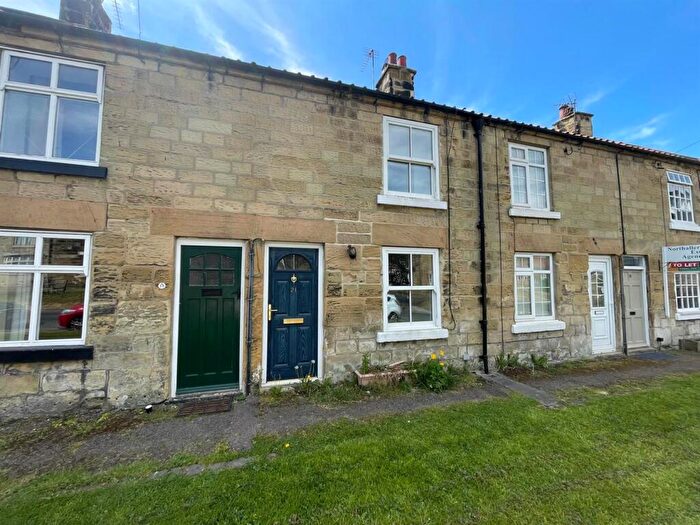
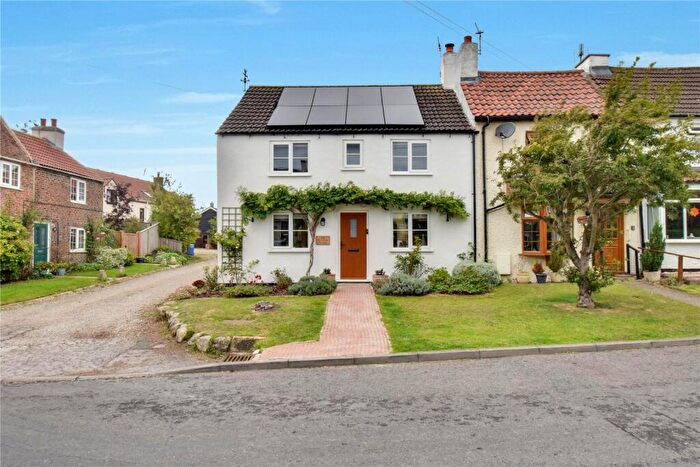
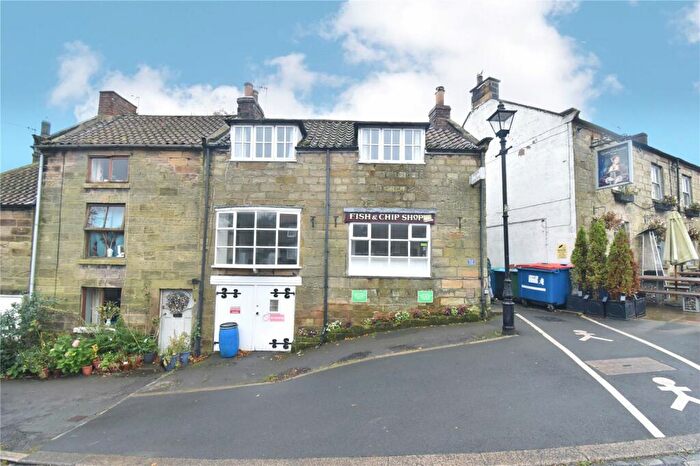
Houses for sale & to rent in Osmotherley, Northallerton
House Prices in Osmotherley
Properties in Osmotherley have an average house price of £383,889.00 and had 49 Property Transactions within the last 3 years¹.
Osmotherley is an area in Northallerton, North Yorkshire with 588 households², where the most expensive property was sold for £1,067,000.00.
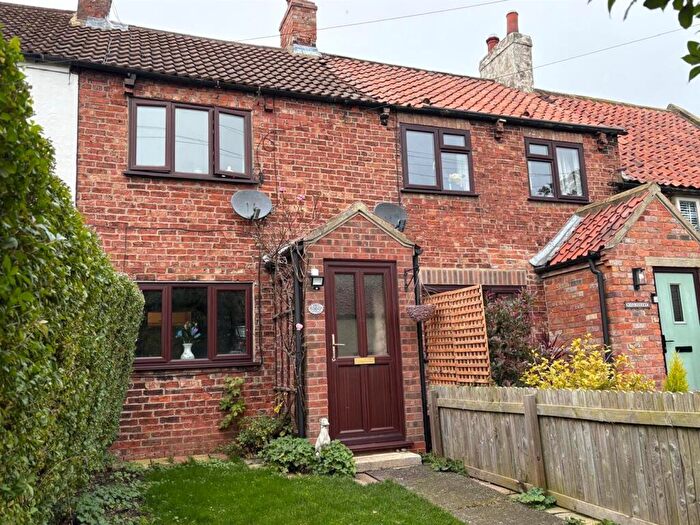
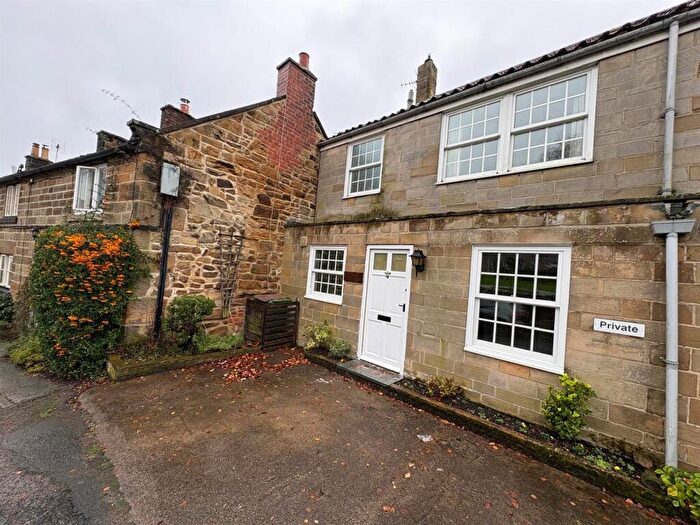
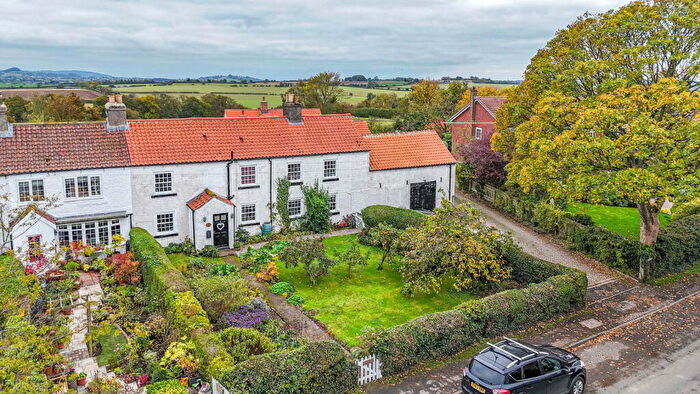
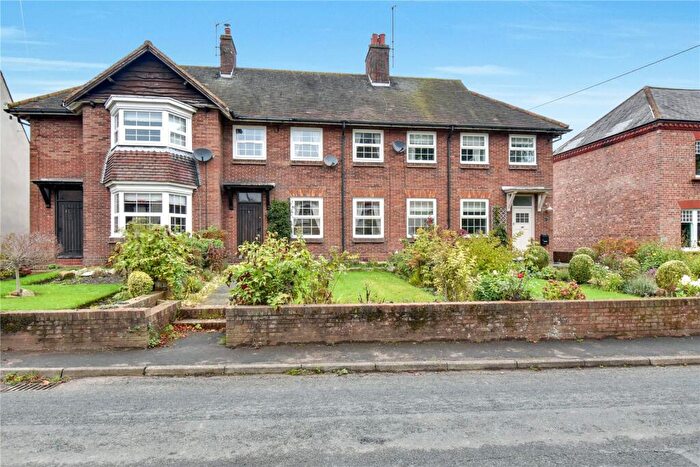
Properties for sale in Osmotherley
Roads and Postcodes in Osmotherley
Navigate through our locations to find the location of your next house in Osmotherley, Northallerton for sale or to rent.
| Streets | Postcodes |
|---|---|
| Back Lane | DL6 3BJ |
| Beacon View | DL6 3TE |
| Bullamoor Road | DL6 3RA |
| Carlton Cottages | DL6 2DD |
| Clack Bank | DL6 3PW |
| Clack Lane | DL6 3PN DL6 3PP |
| Foxton View | DL6 2RX |
| Grant Close | DL6 3BD |
| Hall Cottages | DL6 2BP |
| Hambleton Cottages | DL6 2DE |
| Long Lane | DL6 2TG |
| Manor Cottages | DL6 2DH |
| North End | DL6 3BA DL6 3BB DL6 3BE DL6 3BH DL6 3BQ |
| Oswaldene | DL6 3AD |
| Quarry Lane | DL6 3AL |
| Ruebury Lane | DL6 3AW DL6 3BG |
| School Lane | DL6 3AF DL6 3BW |
| Shire Garth | DL6 2SS |
| South End | DL6 3BL DL6 3BN DL6 3BP |
| Spring Hill | DL6 2SQ |
| Staddlebridge | DL6 3JF |
| Station Cottages | DL6 2SA |
| Summerfield House Farm Cottages | DL6 2SL |
| The Beeches | DL6 2DJ |
| Tofts Lane | DL6 2SD |
| West End | DL6 3AA DL6 3AE DL6 3AG |
| Wye Carr | DL6 2ED |
| DL6 2BL DL6 2BW DL6 2DB DL6 2DF DL6 2DP DL6 2DR DL6 2DW DL6 2DY DL6 2EB DL6 2RY DL6 2SB DL6 2SE DL6 2SF DL6 2SG DL6 2SH DL6 2TB DL6 3AQ DL6 3PR DL6 3PU DL6 3PY DL6 3QG DL6 3RD DL6 3RE DL6 3TA DL6 3TB DL6 3TD DL6 3TF |
Transport near Osmotherley
-
Northallerton Station
-
Yarm Station
-
Allen's West Station
-
Thirsk Station
-
Teesside Airport Station
-
Eaglescliffe Station
-
Dinsdale Station
-
Battersby Station
-
Great Ayton Station
-
Nunthorpe Station
- FAQ
- Price Paid By Year
- Property Type Price
Frequently asked questions about Osmotherley
What is the average price for a property for sale in Osmotherley?
The average price for a property for sale in Osmotherley is £383,889. This amount is 34% higher than the average price in Northallerton. There are 420 property listings for sale in Osmotherley.
What streets have the most expensive properties for sale in Osmotherley?
The streets with the most expensive properties for sale in Osmotherley are Clack Lane at an average of £900,100, The Beeches at an average of £678,500 and Back Lane at an average of £397,250.
What streets have the most affordable properties for sale in Osmotherley?
The streets with the most affordable properties for sale in Osmotherley are West End at an average of £147,050, Grant Close at an average of £220,000 and North End at an average of £321,125.
Which train stations are available in or near Osmotherley?
Some of the train stations available in or near Osmotherley are Northallerton, Yarm and Allen's West.
Property Price Paid in Osmotherley by Year
The average sold property price by year was:
| Year | Average Sold Price | Price Change |
Sold Properties
|
|---|---|---|---|
| 2025 | £369,296 | -2% |
15 Properties |
| 2024 | £376,180 | -12% |
23 Properties |
| 2023 | £419,909 | -31% |
11 Properties |
| 2022 | £549,586 | 34% |
19 Properties |
| 2021 | £364,789 | 15% |
28 Properties |
| 2020 | £309,000 | -66% |
13 Properties |
| 2019 | £513,518 | 55% |
14 Properties |
| 2018 | £233,166 | -27% |
15 Properties |
| 2017 | £295,200 | -6% |
15 Properties |
| 2016 | £312,750 | -11% |
22 Properties |
| 2015 | £345,798 | 12% |
17 Properties |
| 2014 | £305,836 | 11% |
33 Properties |
| 2013 | £270,694 | -24% |
26 Properties |
| 2012 | £336,083 | 9% |
12 Properties |
| 2011 | £305,281 | -30% |
16 Properties |
| 2010 | £396,421 | 18% |
7 Properties |
| 2009 | £324,666 | 4% |
12 Properties |
| 2008 | £313,215 | 3% |
16 Properties |
| 2007 | £305,375 | -16% |
15 Properties |
| 2006 | £353,750 | 11% |
36 Properties |
| 2005 | £313,772 | 5% |
33 Properties |
| 2004 | £299,013 | 18% |
27 Properties |
| 2003 | £244,650 | 26% |
25 Properties |
| 2002 | £180,340 | 18% |
32 Properties |
| 2001 | £147,275 | 30% |
35 Properties |
| 2000 | £103,239 | -33% |
24 Properties |
| 1999 | £137,382 | 14% |
17 Properties |
| 1998 | £117,570 | -0,2% |
24 Properties |
| 1997 | £117,808 | 12% |
29 Properties |
| 1996 | £103,901 | 14% |
20 Properties |
| 1995 | £89,002 | - |
17 Properties |
Property Price per Property Type in Osmotherley
Here you can find historic sold price data in order to help with your property search.
The average Property Paid Price for specific property types in the last three years are:
| Property Type | Average Sold Price | Sold Properties |
|---|---|---|
| Semi Detached House | £309,285.00 | 7 Semi Detached Houses |
| Detached House | £599,110.00 | 19 Detached Houses |
| Terraced House | £228,804.00 | 23 Terraced Houses |

