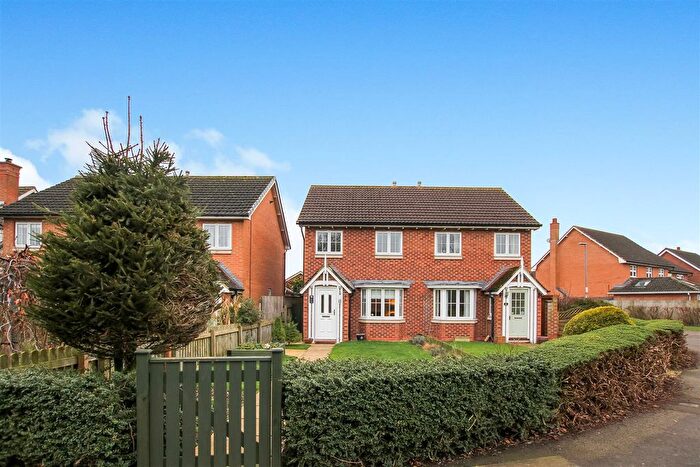
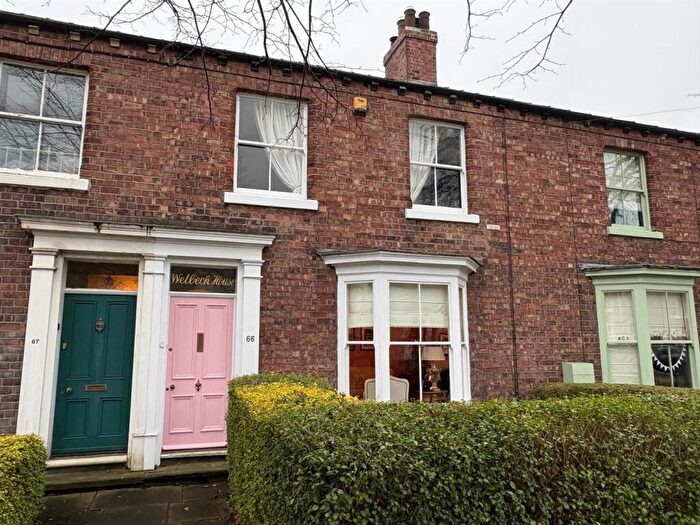
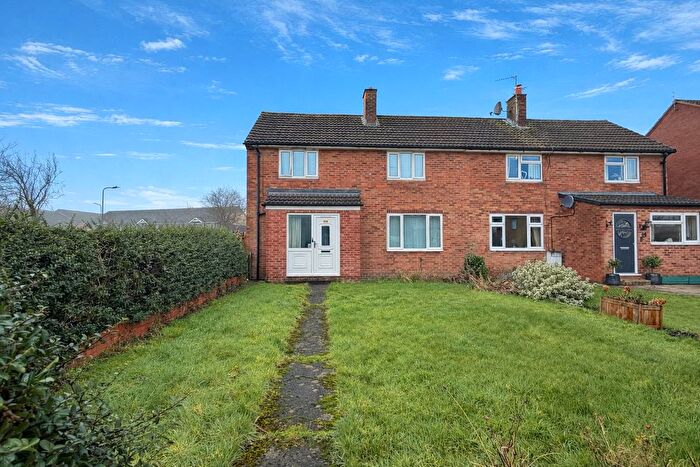
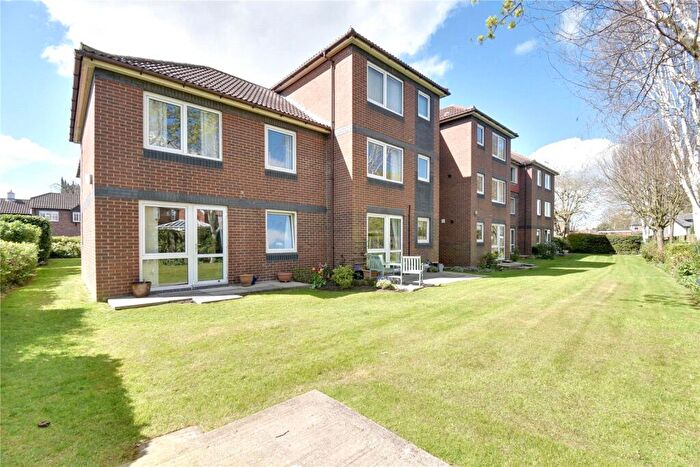
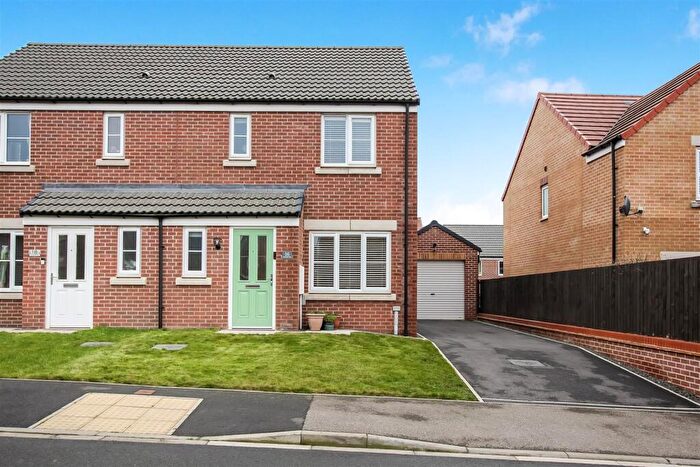
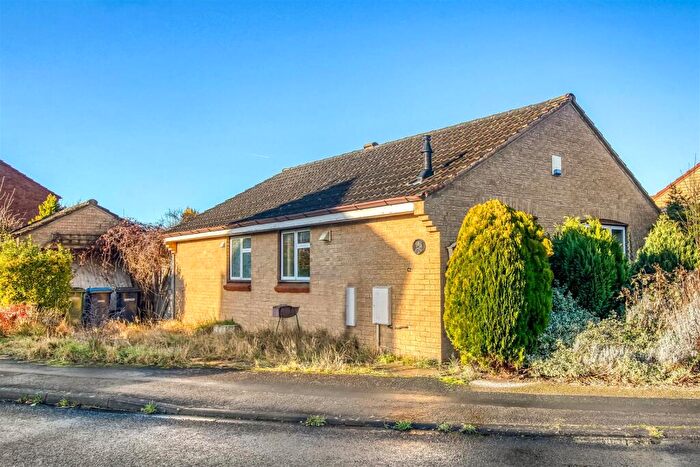
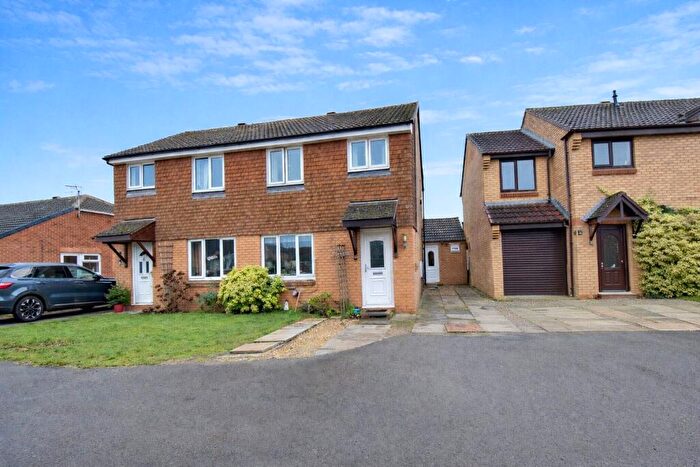
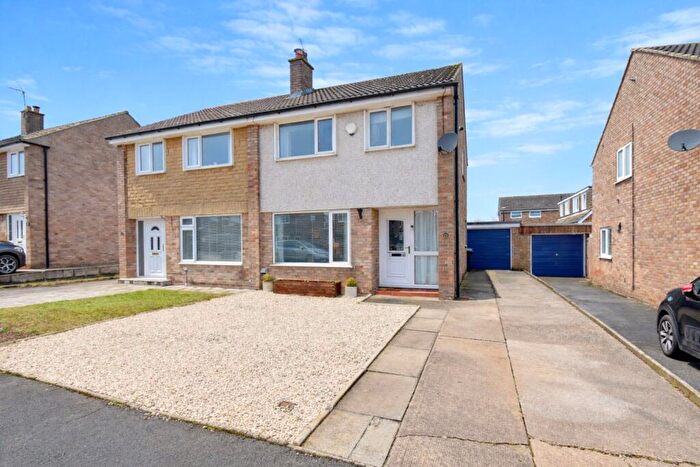
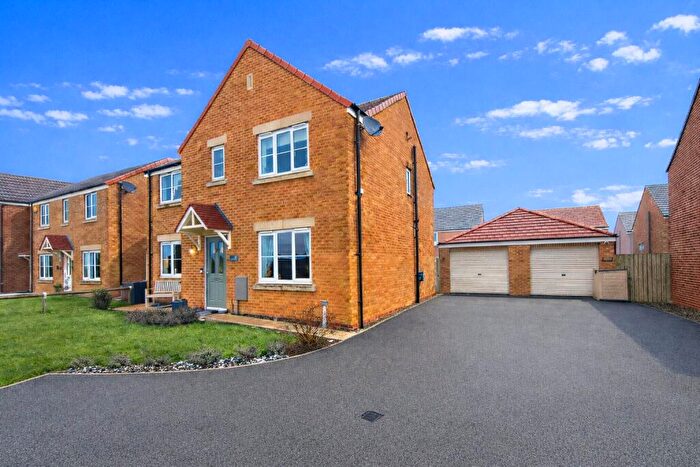
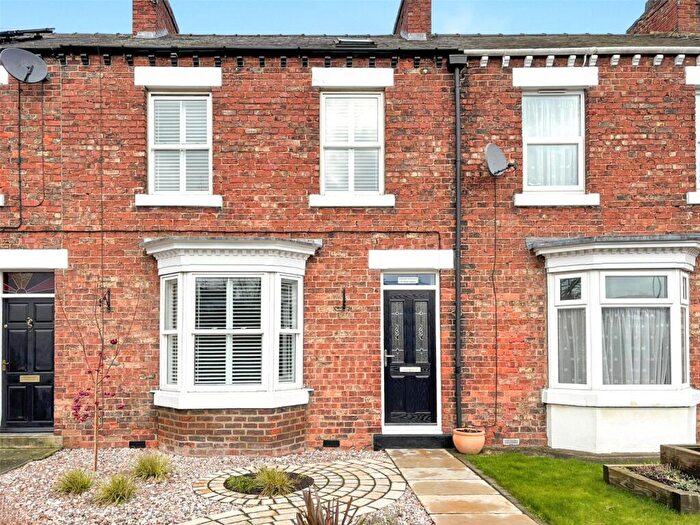
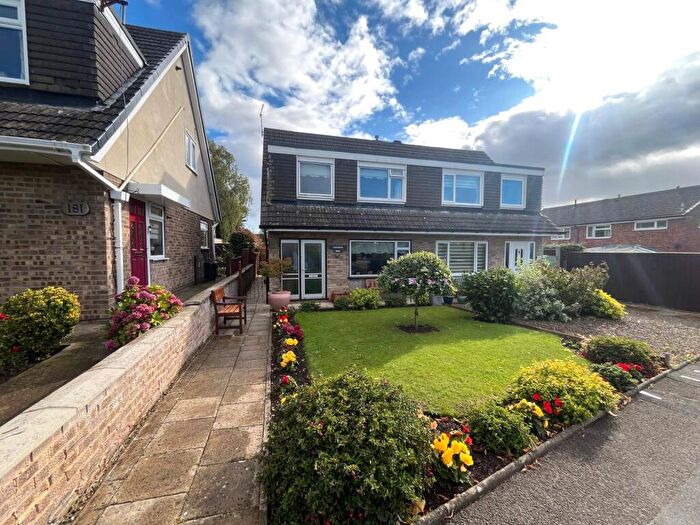
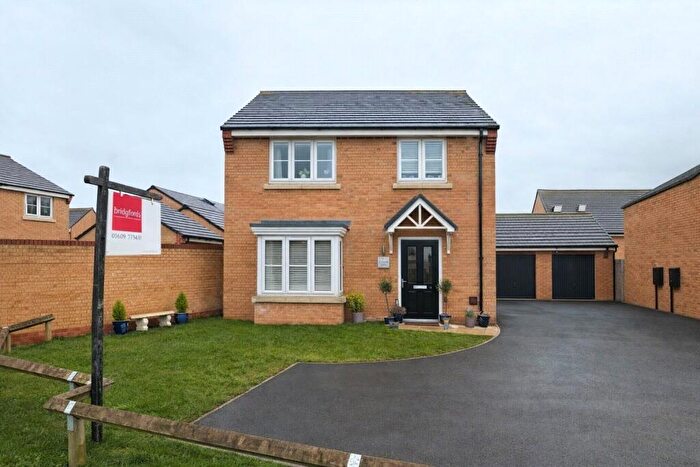
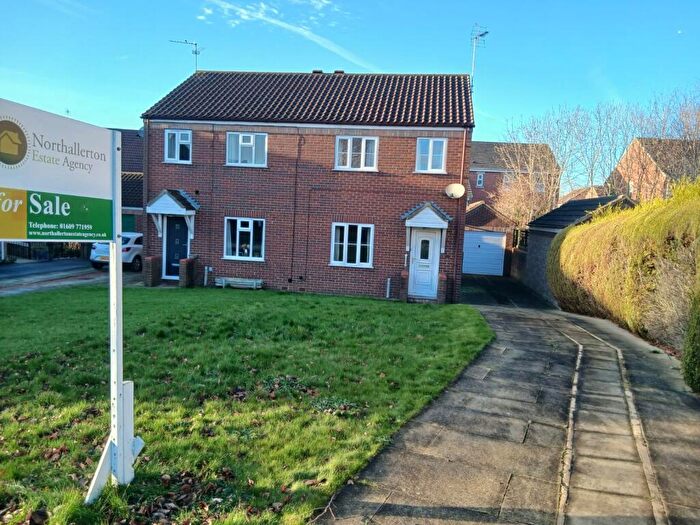
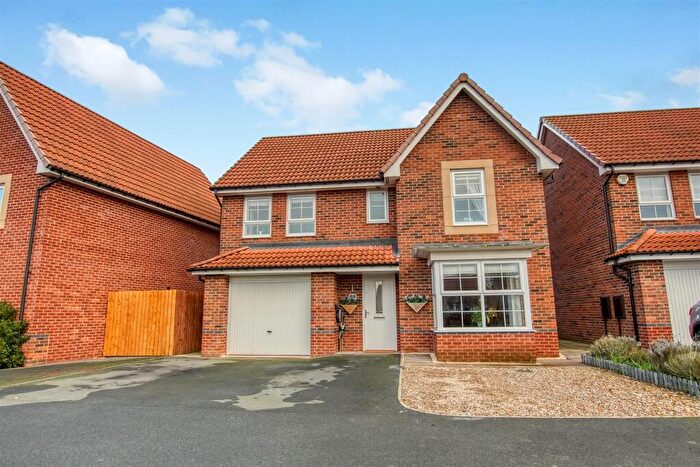
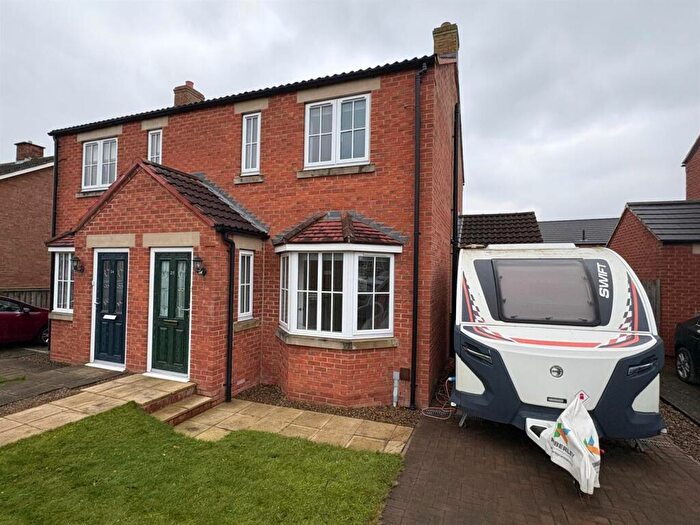
Houses for sale & to rent in Romanby, Northallerton
House Prices in Romanby
Properties in Romanby have an average house price of £275,512.00 and had 163 Property Transactions within the last 3 years¹.
Romanby is an area in Northallerton, North Yorkshire with 1,738 households², where the most expensive property was sold for £775,000.00.
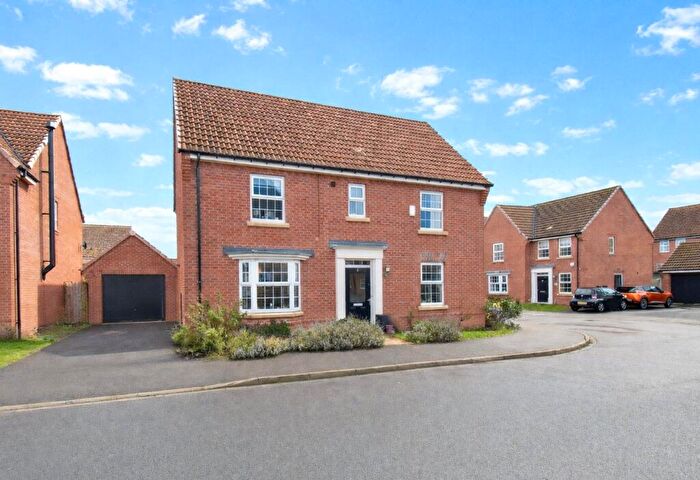
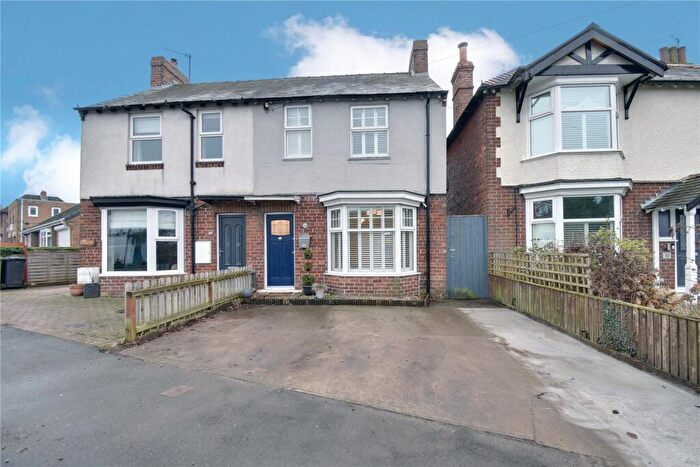
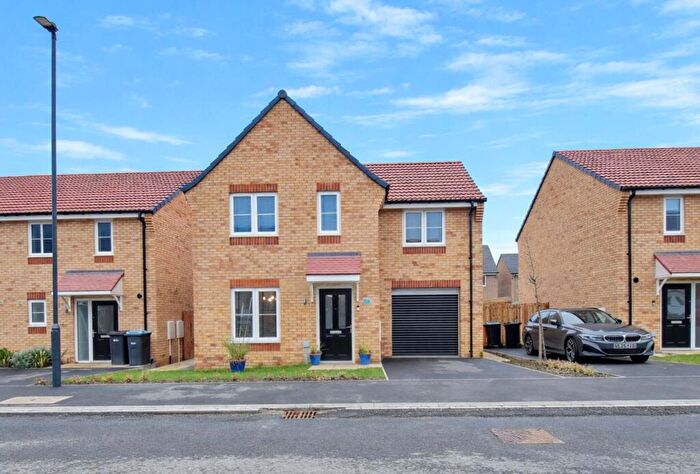
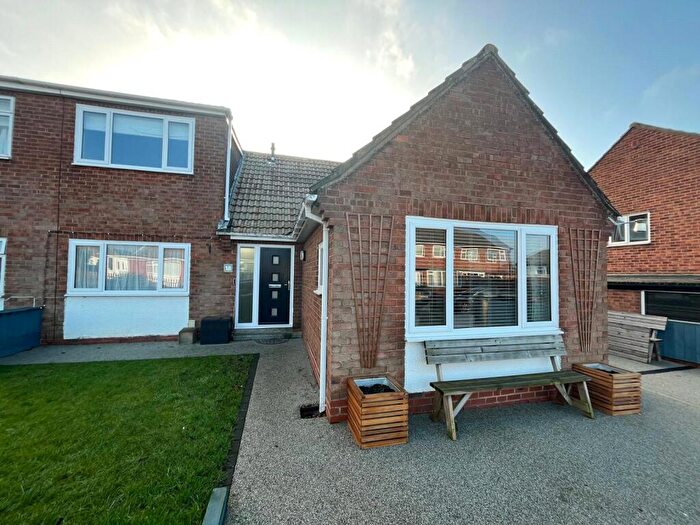
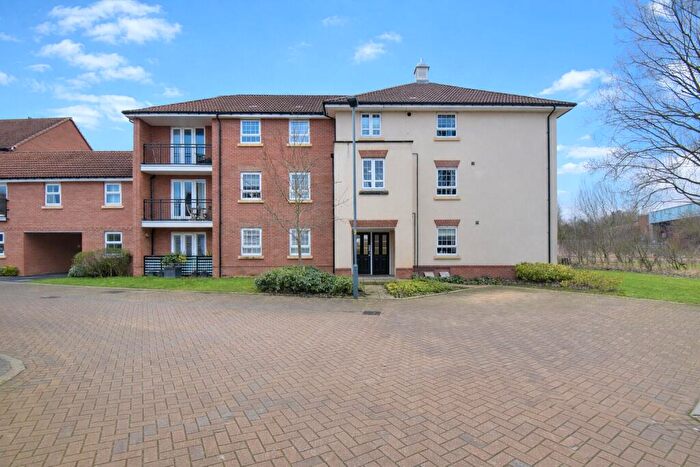
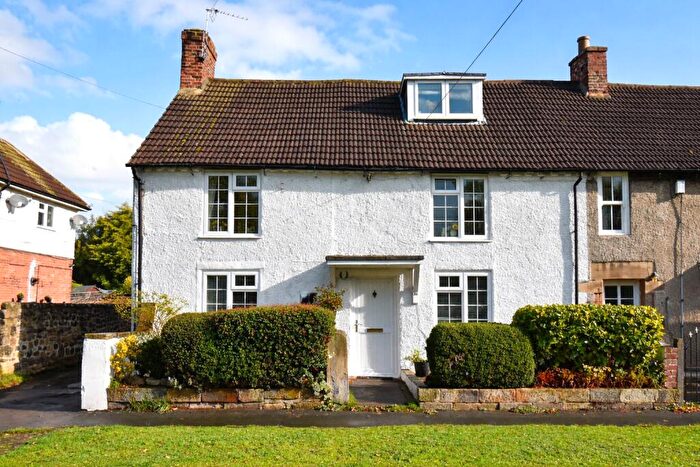
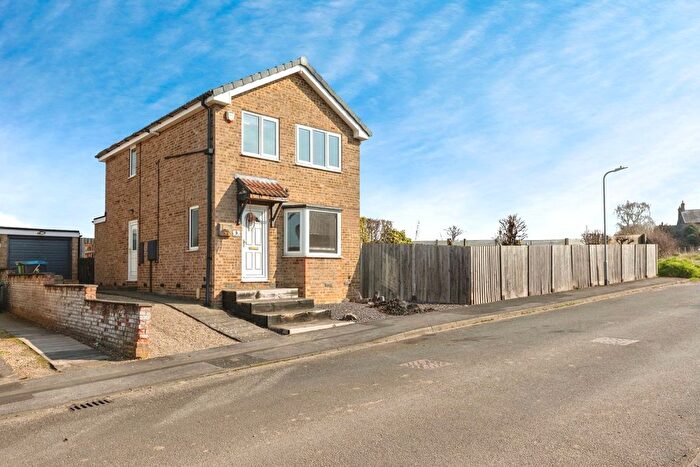
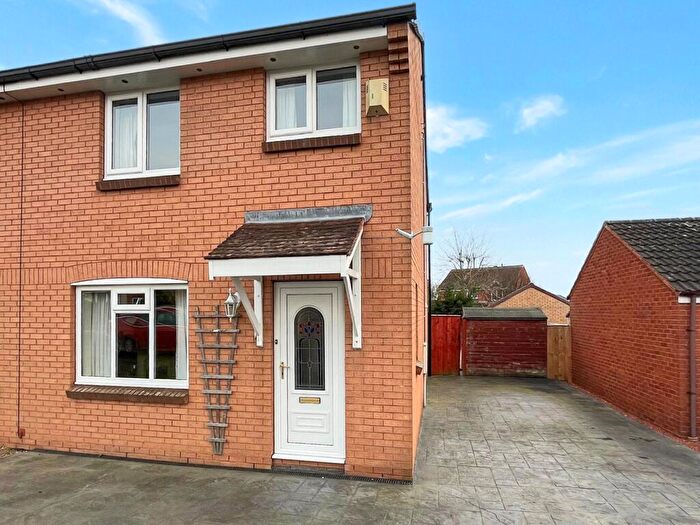
Properties for sale in Romanby
Roads and Postcodes in Romanby
Navigate through our locations to find the location of your next house in Romanby, Northallerton for sale or to rent.
| Streets | Postcodes |
|---|---|
| Ainderby Gardens | DL7 8GR DL7 8GT DL7 8GU DL7 8GS |
| Ainderby Road | DL7 8HA DL7 8HD DL7 8HF DL7 8HG DL7 8HJ DL7 8HL DL7 9JR DL7 8HB |
| Aysgarth Grove | DL7 8HY |
| Beckside | DL7 8PA |
| Bilsdale Close | DL7 8FT |
| Boroughbridge Road | DL7 8AT DL7 8AX DL7 8BE DL7 8BG DL7 8BN DL7 8BP DL7 8BW DL7 8UJ DL7 8AW DL7 8UH DL7 9EL DL7 9EN |
| Bransdale Avenue | DL7 8FY DL7 8FZ |
| Broomfield Avenue | DL7 8UL |
| Castleton Avenue | DL7 8SU DL7 8SR |
| Chantry Road | DL7 8JD DL7 8JH DL7 8JJ DL7 8JL DL7 8JP |
| Cherry Garth Road | DL7 8AZ |
| Coverham Close | DL7 8SS |
| Craven Court | DL7 8UZ |
| Eden Road | DL7 8HU |
| Farndale Avenue | DL7 8SN |
| Farndon Cottages | DL7 8HE |
| Foxglove Close | DL7 8FB |
| Grange Close | DL7 8XD |
| Grassington Avenue | DL7 8SY |
| Hambleton Avenue | DL7 8SW |
| Harebell Close | DL7 8FE |
| Harewood Chase | DL7 8FX |
| Harewood Lane | DL7 8BQ |
| Helmsley Way | DL7 8SP DL7 8SX DL7 8TA |
| Honeysuckle Close | DL7 8FD |
| Howden Road | DL7 8JA |
| Kirk Road | DL7 8JN DL7 8JS |
| Lees Lane | DL7 8DA DL7 8DB DL7 8UY |
| Manor Green | DL7 8BA |
| Mulberry Vale | DL7 8US |
| Neile Close | DL7 8NN |
| Newsham Way | DL7 8HS DL7 8HT DL7 8HX |
| Oaktree Drive | DL7 8FA DL7 8FG |
| Orchard Court | DL7 8DQ |
| Penhill Court | DL7 8ST |
| Pennine View | DL7 8HN DL7 8HP DL7 8HR DL7 8JB |
| Poplar Crescent | DL7 8BD |
| Racecourse Lane | DL7 8AD DL7 8AE DL7 8AH DL7 8AL DL7 8DD DL7 8SB DL7 8XE |
| Richmond Rise | DL7 8JR |
| Romanby Road | DL7 8UN |
| Rowans Way | DL7 8PB |
| Sandy Bank | DL6 1AW DL6 3RW |
| Slingsby Gardens | DL7 8JW |
| South Vale | DL6 1BD |
| St Cuthbert Drive | DL7 8JF |
| St James Mews | DL7 8AU |
| St James Road | DL7 8HH |
| St Paulinus Drive | DL7 8JE |
| St Wilfred Drive | DL7 8JG |
| Studley Close | DL7 8HZ |
| Sutton Drive | DL7 8DH |
| The Close | DL7 8BJ DL7 8BL |
| The Fairway | DL7 8AY DL7 8BB |
| The Green | DL7 8NL DL7 8NR DL7 8NW |
| The Link | DL7 8HQ |
| The Peppergarth | DL7 8NP |
| Thistle Close | DL7 8FF |
| Wensley Road | DL7 8HW |
| Wooden Hill Lane | DL7 8UX |
| Wycliffe Avenue | DL7 8SZ |
| Yafforth Road | DL7 0PE DL7 8UT DL7 8UU |
Transport near Romanby
-
Northallerton Station
-
Thirsk Station
-
Yarm Station
-
Dinsdale Station
-
Teesside Airport Station
-
Darlington Station
-
Allen's West Station
-
Eaglescliffe Station
-
North Road Station
- FAQ
- Price Paid By Year
- Property Type Price
Frequently asked questions about Romanby
What is the average price for a property for sale in Romanby?
The average price for a property for sale in Romanby is £275,512. This amount is 4% lower than the average price in Northallerton. There are 1,878 property listings for sale in Romanby.
What streets have the most expensive properties for sale in Romanby?
The streets with the most expensive properties for sale in Romanby are Sandy Bank at an average of £729,750, Farndon Cottages at an average of £494,000 and Foxglove Close at an average of £455,000.
What streets have the most affordable properties for sale in Romanby?
The streets with the most affordable properties for sale in Romanby are Ainderby Gardens at an average of £164,396, Howden Road at an average of £165,000 and Grange Close at an average of £180,000.
Which train stations are available in or near Romanby?
Some of the train stations available in or near Romanby are Northallerton, Thirsk and Yarm.
Property Price Paid in Romanby by Year
The average sold property price by year was:
| Year | Average Sold Price | Price Change |
Sold Properties
|
|---|---|---|---|
| 2025 | £269,821 | -10% |
48 Properties |
| 2024 | £296,897 | 13% |
60 Properties |
| 2023 | £257,150 | -6% |
55 Properties |
| 2022 | £273,253 | 6% |
61 Properties |
| 2021 | £256,660 | 11% |
53 Properties |
| 2020 | £228,535 | -3% |
46 Properties |
| 2019 | £235,697 | -5% |
61 Properties |
| 2018 | £246,963 | 13% |
66 Properties |
| 2017 | £215,334 | 2% |
79 Properties |
| 2016 | £211,729 | -5% |
64 Properties |
| 2015 | £222,138 | 7% |
61 Properties |
| 2014 | £207,658 | 3% |
67 Properties |
| 2013 | £202,325 | -5% |
59 Properties |
| 2012 | £212,326 | 5% |
55 Properties |
| 2011 | £202,719 | 2% |
50 Properties |
| 2010 | £199,210 | 8% |
45 Properties |
| 2009 | £183,118 | -13% |
38 Properties |
| 2008 | £207,227 | -1% |
34 Properties |
| 2007 | £209,502 | 5% |
85 Properties |
| 2006 | £198,649 | 0,3% |
91 Properties |
| 2005 | £198,122 | 7% |
88 Properties |
| 2004 | £183,477 | 12% |
79 Properties |
| 2003 | £161,061 | 22% |
67 Properties |
| 2002 | £125,978 | 16% |
90 Properties |
| 2001 | £105,509 | -0,3% |
93 Properties |
| 2000 | £105,844 | 23% |
106 Properties |
| 1999 | £81,403 | -2% |
87 Properties |
| 1998 | £82,947 | 5% |
128 Properties |
| 1997 | £78,917 | 9% |
84 Properties |
| 1996 | £71,916 | -3% |
94 Properties |
| 1995 | £73,751 | - |
76 Properties |
Property Price per Property Type in Romanby
Here you can find historic sold price data in order to help with your property search.
The average Property Paid Price for specific property types in the last three years are:
| Property Type | Average Sold Price | Sold Properties |
|---|---|---|
| Semi Detached House | £252,560.00 | 84 Semi Detached Houses |
| Detached House | £372,476.00 | 47 Detached Houses |
| Terraced House | £215,424.00 | 25 Terraced Houses |
| Flat | £114,500.00 | 7 Flats |

