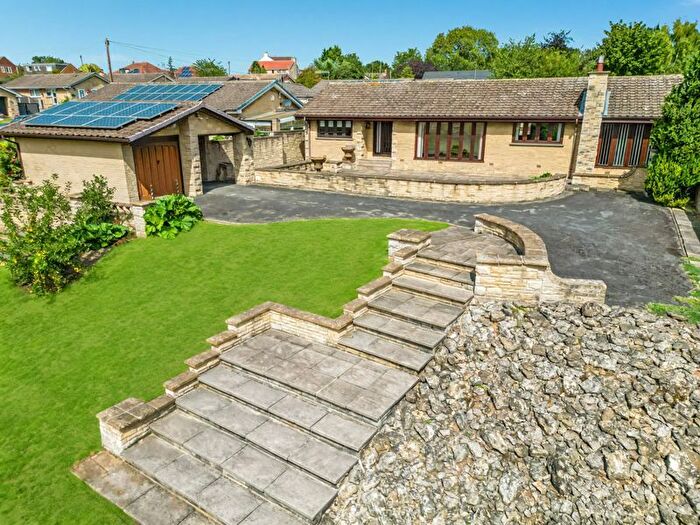
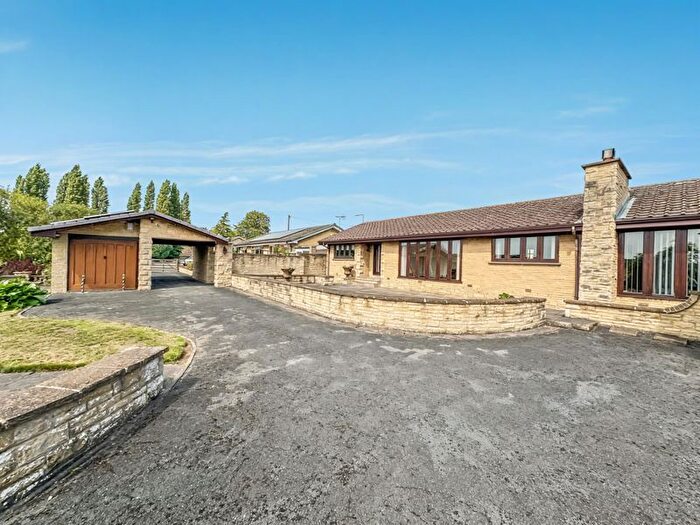
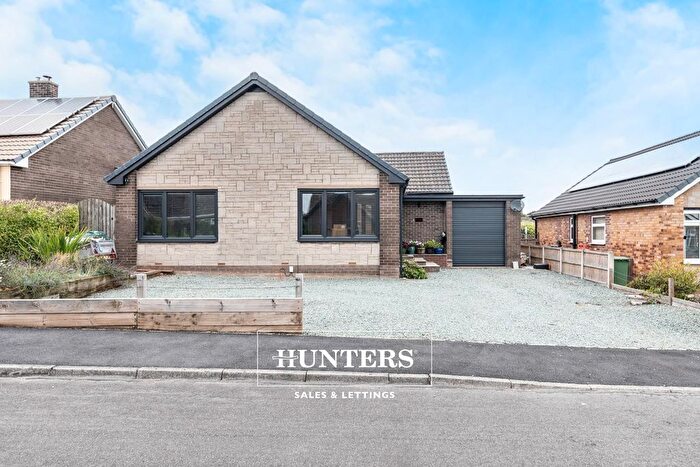
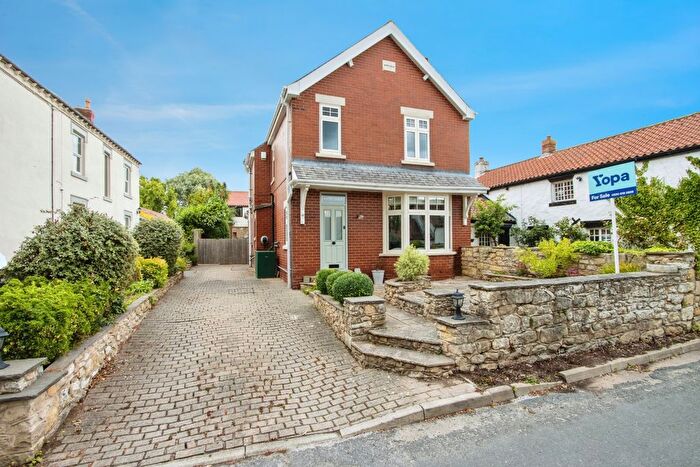
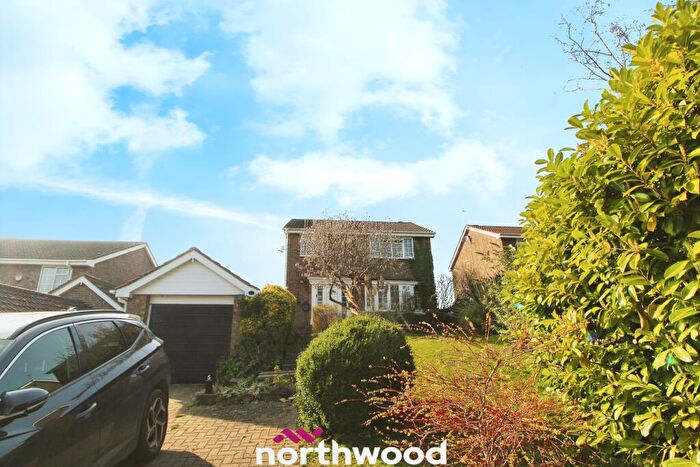
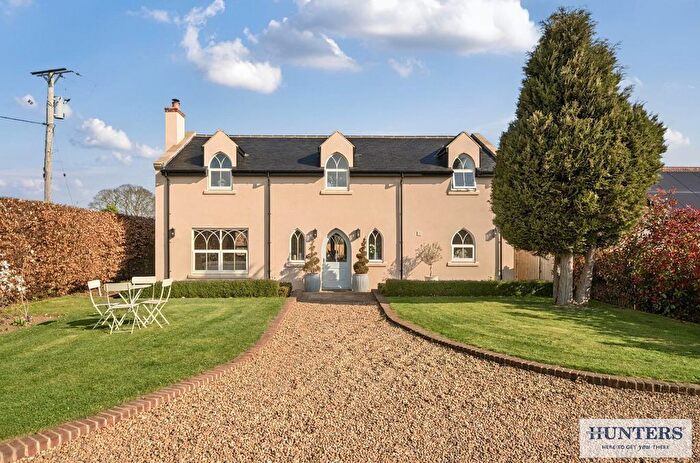
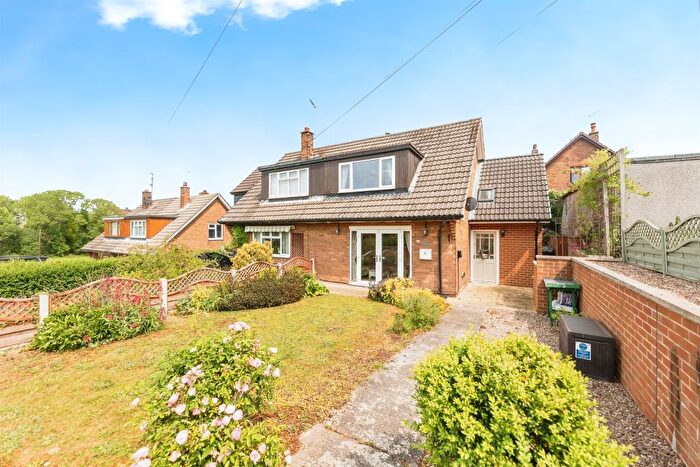
Houses for sale & to rent in Whitley, Pontefract
House Prices in Whitley
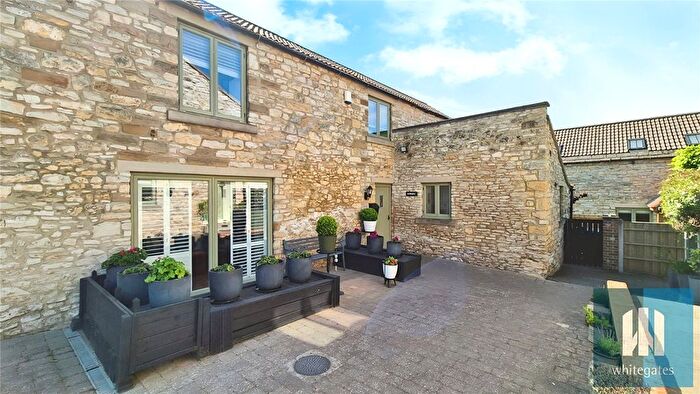
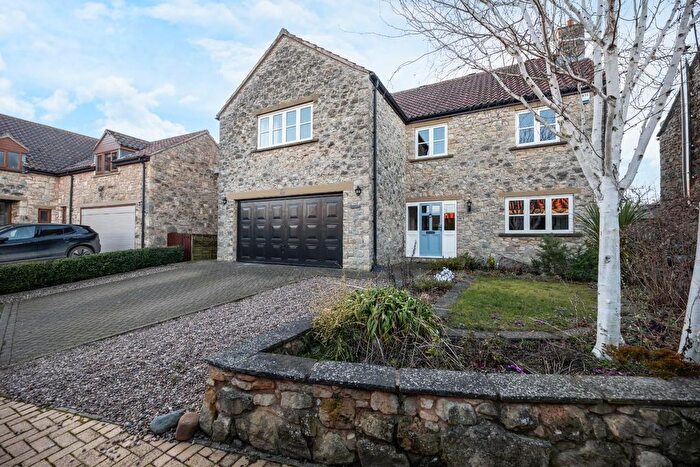
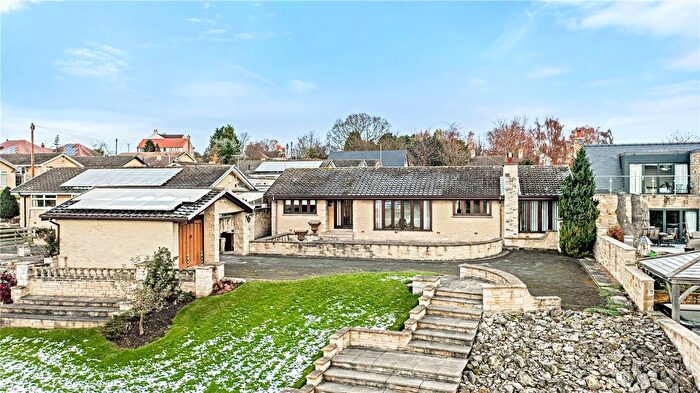
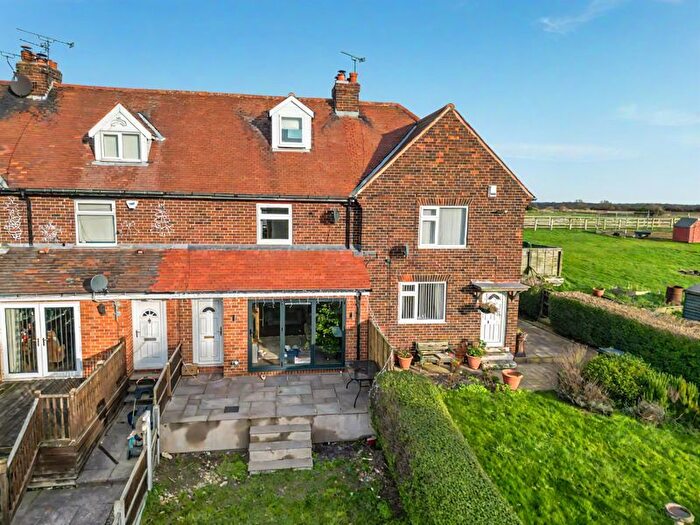
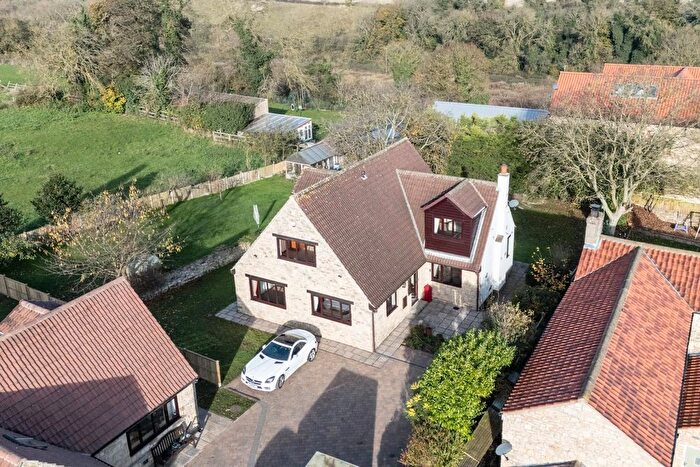
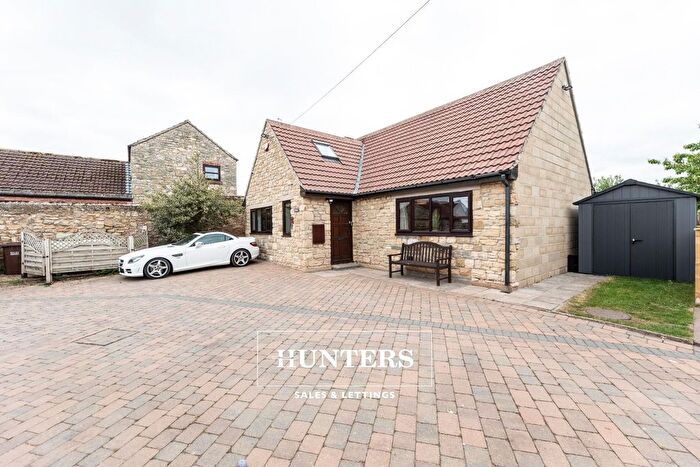
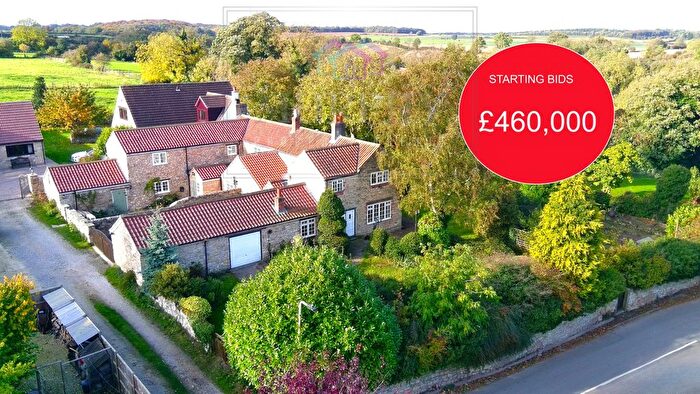
Properties in Whitley have an average house price of £425,291.00 and had 24 Property Transactions within the last 3 years¹.
Whitley is an area in Pontefract, North Yorkshire with 312 households², where the most expensive property was sold for £770,000.00.
Properties for sale in Whitley
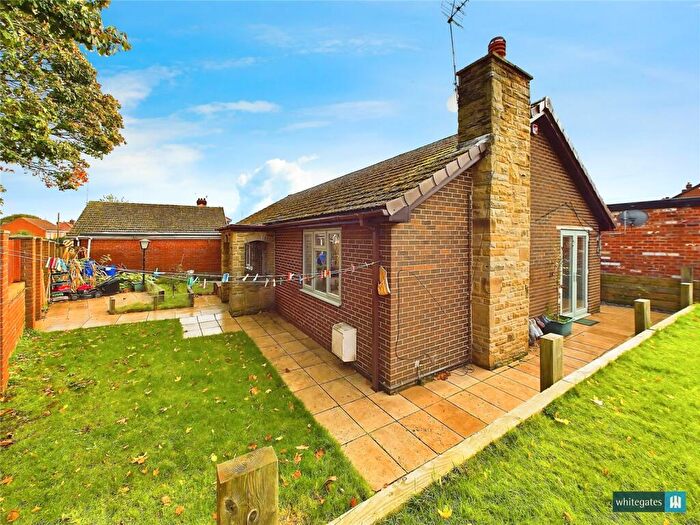
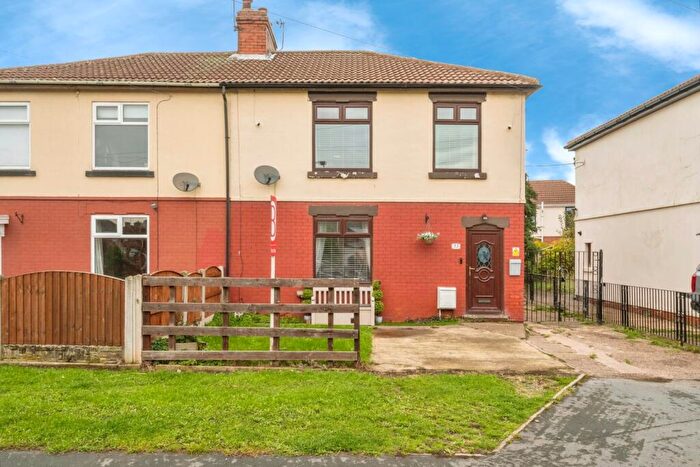
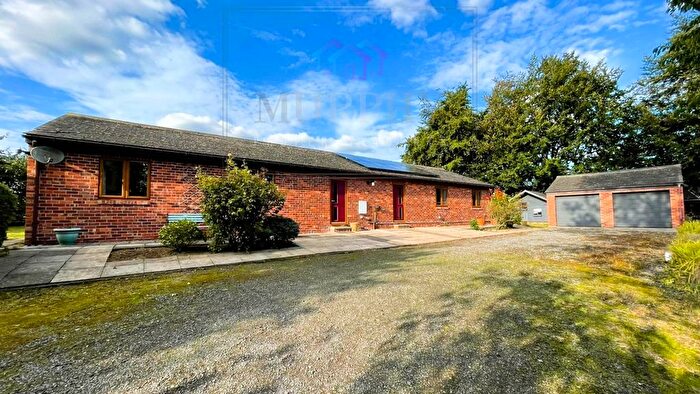
Previously listed properties in Whitley
Roads and Postcodes in Whitley
Navigate through our locations to find the location of your next house in Whitley, Pontefract for sale or to rent.
| Streets | Postcodes |
|---|---|
| Agricultural Houses | WF8 3LL |
| Bankwood Road | WF8 3DD WF8 3DE |
| Chapel Lane | WF8 3LG |
| Churchfield Lane | WF8 3SN |
| Hodge Lane | WF8 3LB |
| Jacksons Lane | WF8 3HZ |
| Long Lane | WF8 3JX |
| Main Street | WF8 3JY WF8 3JZ |
| Manor Close | WF8 3LZ |
| Middlefield Lane | WF8 3JA WF8 3JU |
| Mount Pleasant | WF8 3LW |
| New Road | WF8 3LH WF8 3DF |
| Pinfold Lane | WF8 3JT |
| Rectory Court | WF8 3SP |
| Smeaton Industrial Park | WF8 3LU |
| Springfield Crescent | WF8 3LE |
| Stan Valley | WF8 3LN |
| Stapleton Park Cottages | WF8 3DB |
| Stubbs Road | WF8 3LP |
| Top House Court | WF8 3LA |
| Viewlands | WF8 3LJ |
| Water Lane | WF8 3LD |
| Wentdale | WF8 3LX |
| Wentedge Road | WF8 3JS |
| Willowbridge Road | WF8 3LR |
| Windyridge | WF8 3LQ |
| WF8 3LF |
Transport near Whitley
- FAQ
- Price Paid By Year
- Property Type Price
Frequently asked questions about Whitley
What is the average price for a property for sale in Whitley?
The average price for a property for sale in Whitley is £425,291. There are 120 property listings for sale in Whitley.
What streets have the most expensive properties for sale in Whitley?
The streets with the most expensive properties for sale in Whitley are Chapel Lane at an average of £567,166, Wentedge Road at an average of £565,000 and Top House Court at an average of £507,500.
What streets have the most affordable properties for sale in Whitley?
The streets with the most affordable properties for sale in Whitley are Pinfold Lane at an average of £211,000, Mount Pleasant at an average of £217,500 and Hodge Lane at an average of £250,000.
Which train stations are available in or near Whitley?
Some of the train stations available in or near Whitley are Whitley Bridge, Knottingley and South Elmsall.
Property Price Paid in Whitley by Year
The average sold property price by year was:
| Year | Average Sold Price | Price Change |
Sold Properties
|
|---|---|---|---|
| 2025 | £458,833 | 17% |
9 Properties |
| 2024 | £382,500 | -15% |
9 Properties |
| 2023 | £439,166 | -14% |
6 Properties |
| 2022 | £499,583 | 35% |
12 Properties |
| 2021 | £324,383 | 16% |
9 Properties |
| 2020 | £272,625 | -9% |
8 Properties |
| 2019 | £296,178 | -8% |
14 Properties |
| 2018 | £320,530 | 29% |
15 Properties |
| 2017 | £228,812 | -56% |
12 Properties |
| 2016 | £356,529 | 28% |
17 Properties |
| 2015 | £256,313 | -13% |
11 Properties |
| 2014 | £289,300 | 26% |
12 Properties |
| 2013 | £214,000 | -19% |
5 Properties |
| 2012 | £255,611 | 9% |
9 Properties |
| 2011 | £233,775 | -18% |
10 Properties |
| 2010 | £276,000 | 14% |
7 Properties |
| 2009 | £236,264 | 5% |
9 Properties |
| 2008 | £225,000 | -52% |
3 Properties |
| 2007 | £341,584 | 3% |
20 Properties |
| 2006 | £330,624 | 21% |
8 Properties |
| 2005 | £261,909 | -5% |
11 Properties |
| 2004 | £274,050 | 21% |
10 Properties |
| 2003 | £216,280 | 13% |
13 Properties |
| 2002 | £187,374 | 26% |
14 Properties |
| 2001 | £138,125 | -15% |
12 Properties |
| 2000 | £159,000 | 23% |
10 Properties |
| 1999 | £121,784 | 11% |
13 Properties |
| 1998 | £108,111 | -35% |
9 Properties |
| 1997 | £146,020 | 25% |
5 Properties |
| 1996 | £109,714 | 9% |
7 Properties |
| 1995 | £100,000 | - |
7 Properties |
Property Price per Property Type in Whitley
Here you can find historic sold price data in order to help with your property search.
The average Property Paid Price for specific property types in the last three years are:
| Property Type | Average Sold Price | Sold Properties |
|---|---|---|
| Semi Detached House | £241,000.00 | 5 Semi Detached Houses |
| Detached House | £473,789.00 | 19 Detached Houses |

