
Houses for sale in Barton, Richmond
House Prices in Barton
Properties in Barton have an average house price of £278k and had 27 Property Transactions within the last 3 years¹.
Barton is an area in Richmond, North Yorkshire with 343 households², where the most expensive property was sold for £750k.
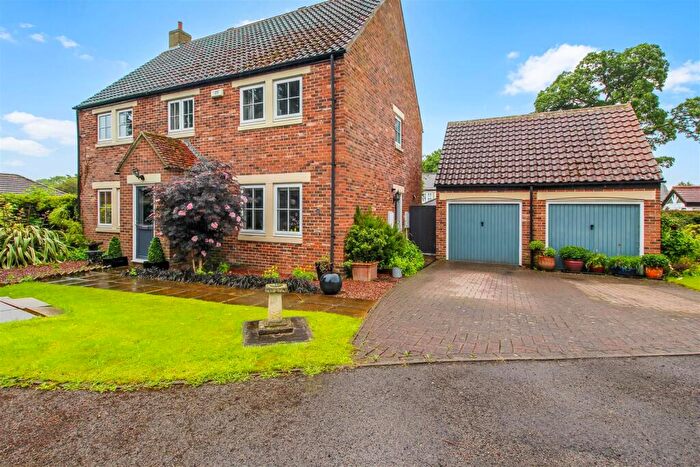
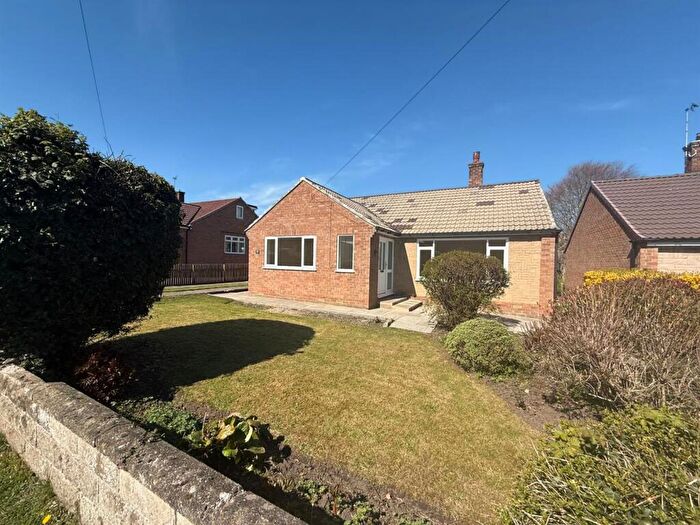
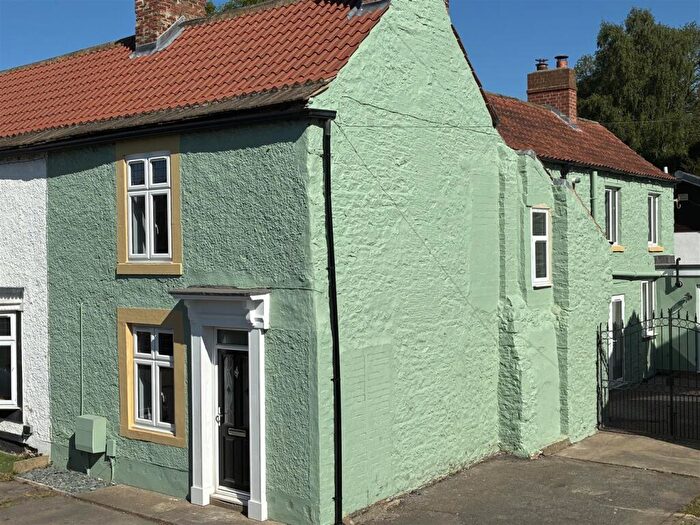
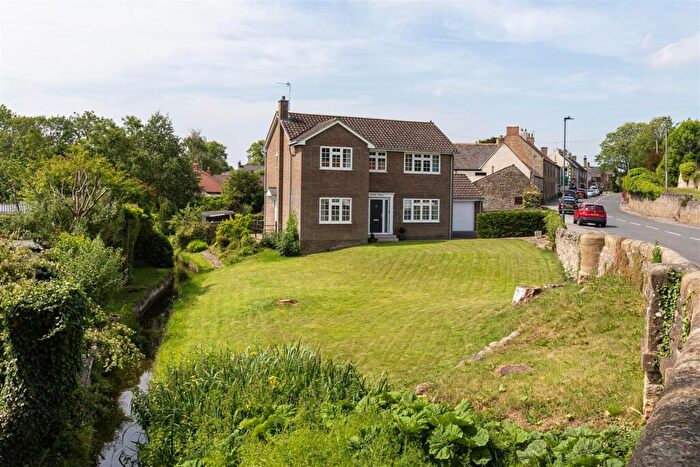
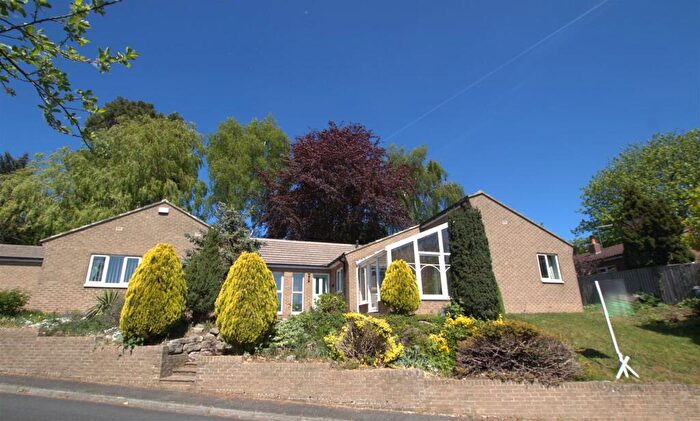
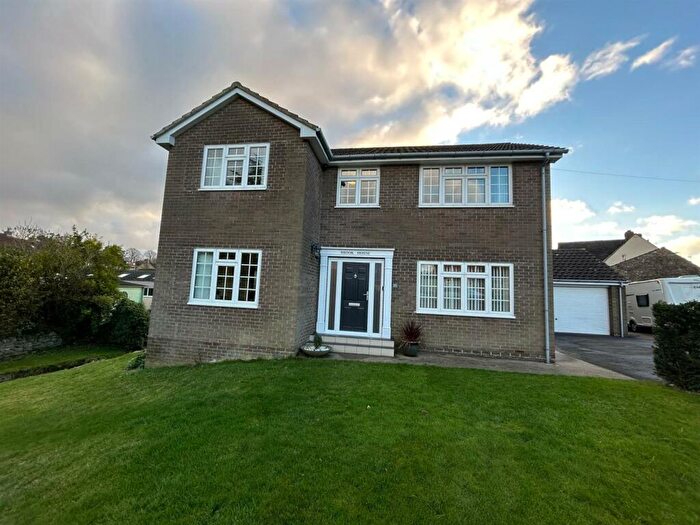
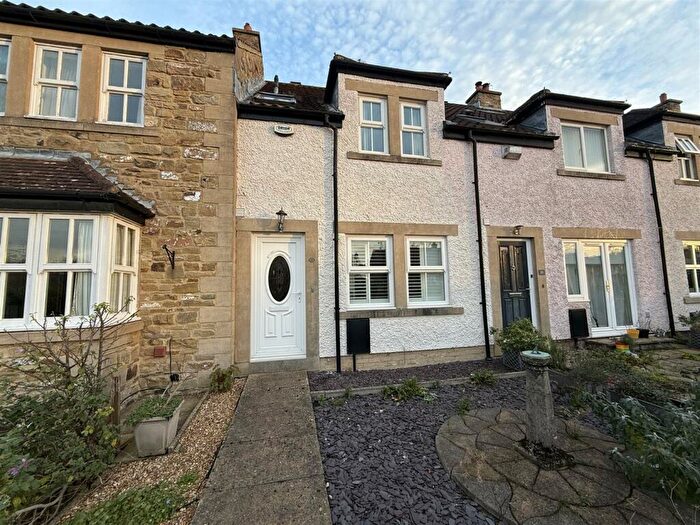
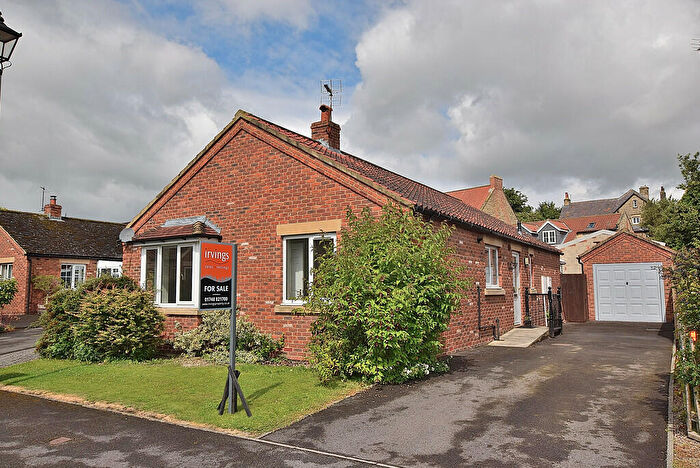
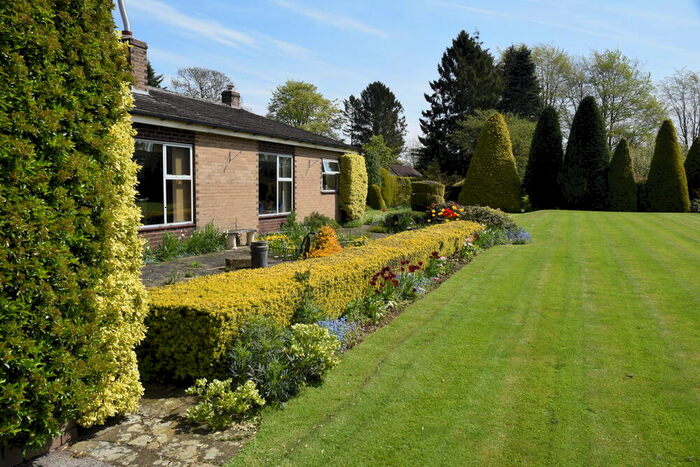
Properties for sale in Barton
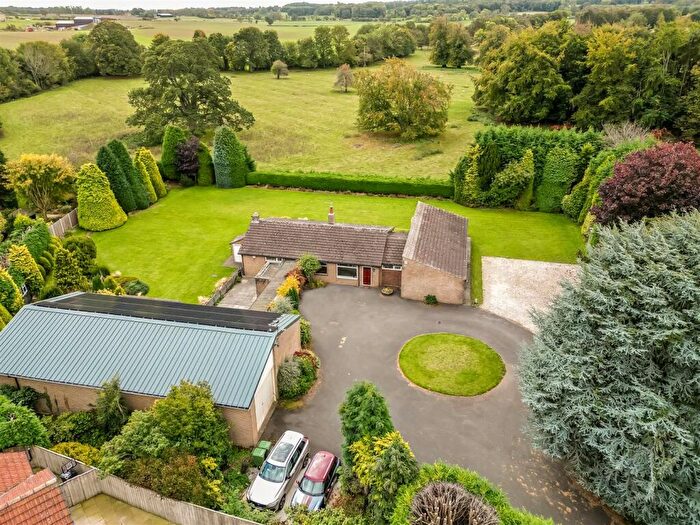
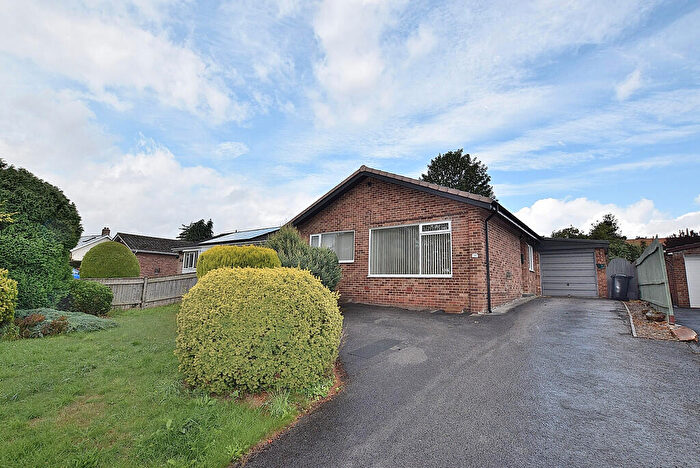
![]()
If you are looking to sell your house, let it out, or receive a property valuation, an expert can help you.
Click the button below to get started.
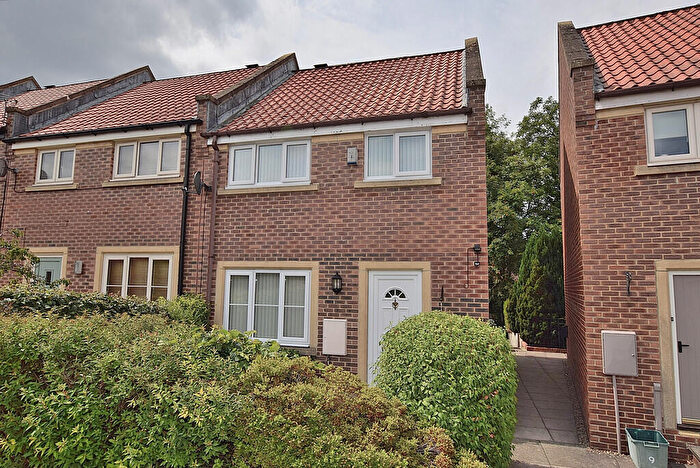
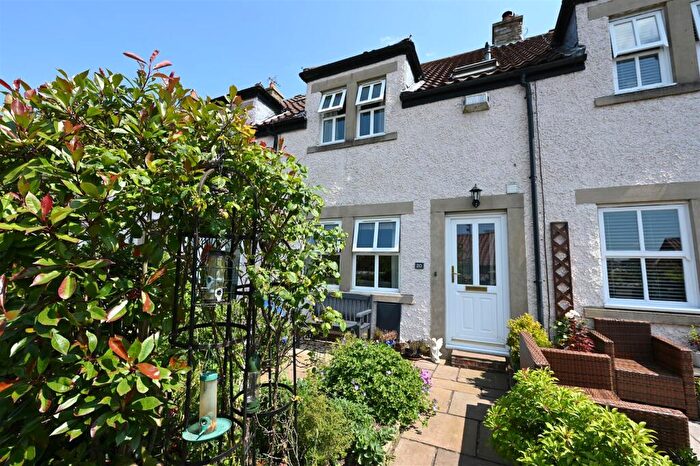
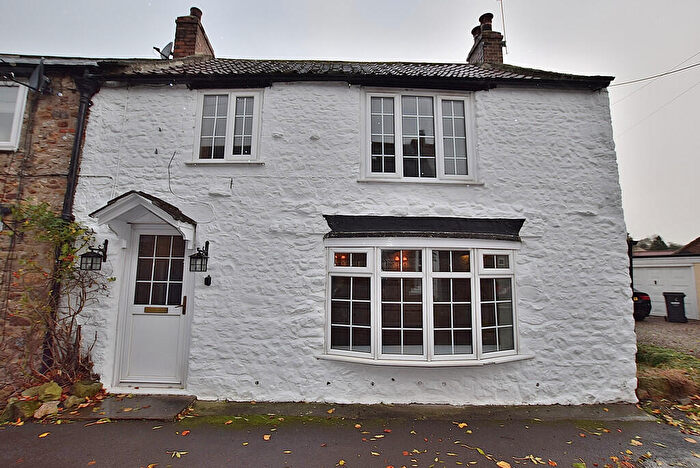
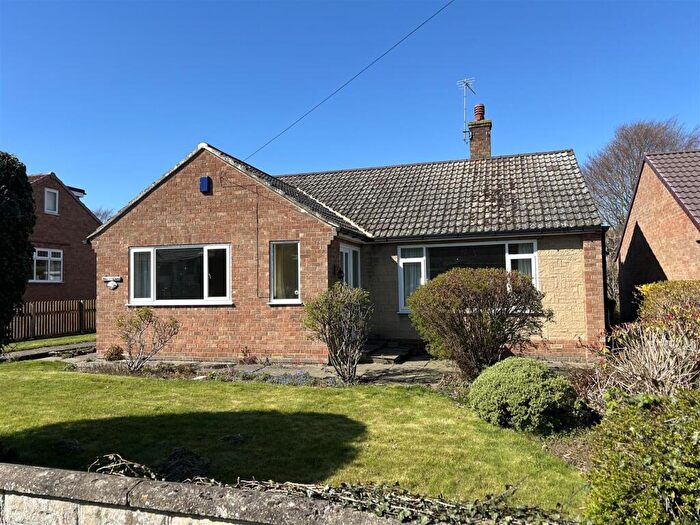
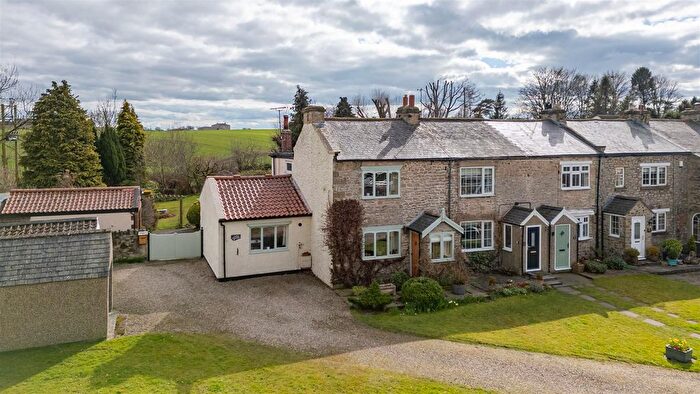
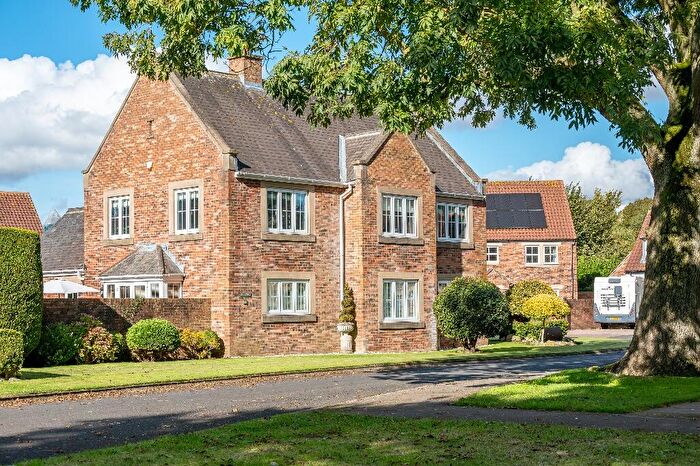
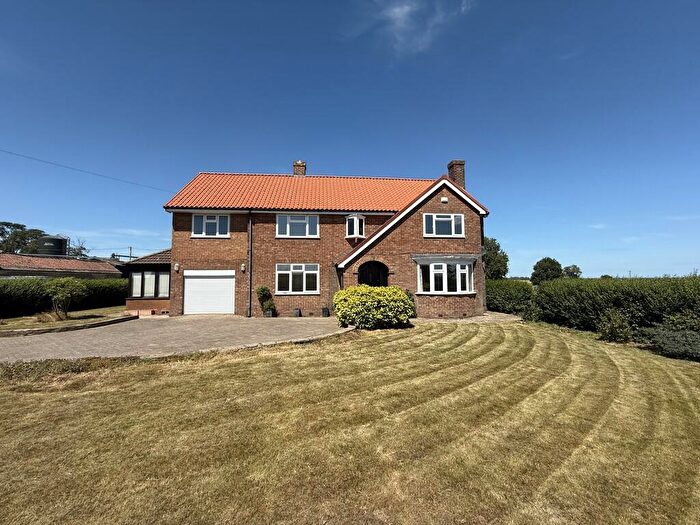
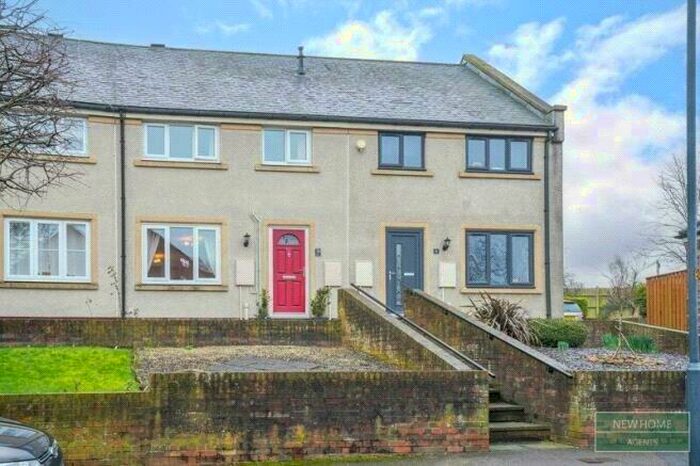
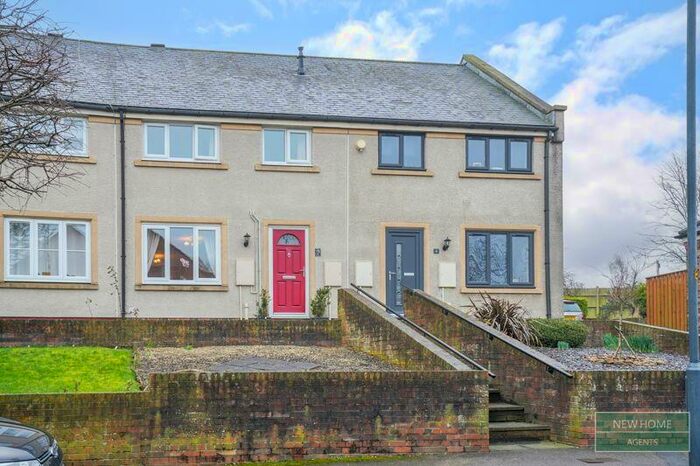
Previously listed properties in Barton
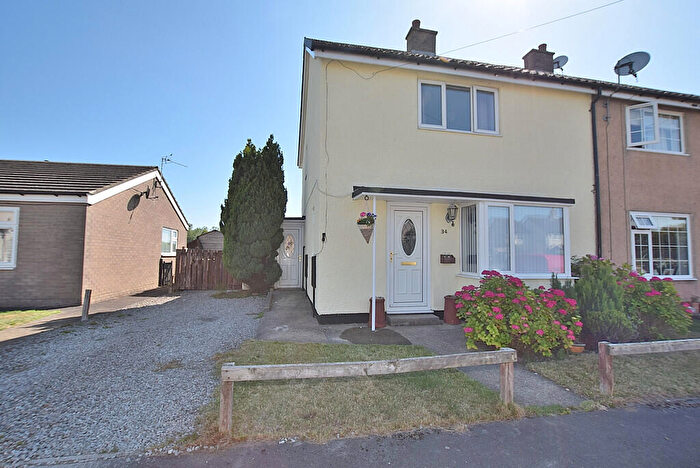
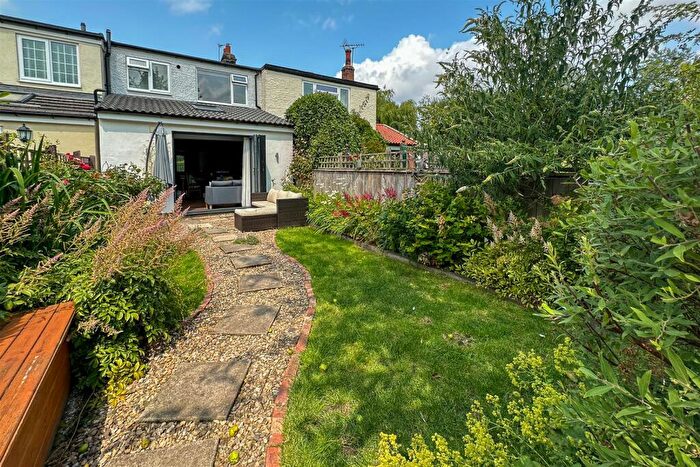
![]()
If you are looking to sell your house, let it out, or receive a property valuation, an expert can help you.
Click the button below to get started.
Roads and Postcodes in Barton
Navigate through our locations to find the location of your next house in Barton, Richmond for sale or to rent.
| Streets | Postcodes |
|---|---|
| Blind Lane | DL10 6LN DL10 6LW |
| Cedar Grove | DL10 6JP |
| Chapel Row | DL10 6JU |
| Church Lane | DL10 6JF |
| Church Meadows | DL10 6NQ |
| East View | DL10 6LS |
| Glebe Close | DL10 6JZ |
| Jubilee Terrace | DL10 6JY |
| Kettle End | DL10 6LA DL10 6LB |
| Marygate | DL10 6LD DL10 6LE |
| Piper Hill Close | DL10 6JA |
| Silver Garth | DL10 6NG |
| Silver Meadows | DL10 6SL |
| Silver Street | DL10 6JW DL10 6JD DL10 6JH DL10 6JL DL10 6JN DL10 6LL DL10 6LX DL10 6LY |
| St Cuthberts Green | DL10 6LP DL10 6LR |
| St Marys Close | DL10 6JE |
| The Porch | DL10 6LG DL10 6LH DL10 6LQ |
| Waterfall Terrace | DL10 6LZ |
| Wells Green | DL10 6NH |
| DL10 6HN DL10 6HQ DL10 6NB |
Property price trends in Barton
According to the latest Land Registry data, the average home in Barton sold for £310,750 in 2026. That figure comes from 371 sales logged over the past 31 years.
Prices have continued to climb over the last three years. Compared with 2023, when the typical sale came in around £224,219, that's a rise of roughly 38.6%.
Looking back five years, average prices are down about 4.5% since 2021, a drop of around £14,595 in cash terms.
Zoom out to the past decade for the fuller picture. Back in 2016, homes here averaged £195,650, so the typical sold price has climbed about 58.8% since then, roughly 4.7% a year. Stretch the view to fifteen years and that annual pace eases back to about 3.4%.
Frequently asked questions about Barton
What is the average price for a property for sale in Barton?
The average price for a property for sale in Barton is £277,711. This amount is 9% lower than the average price in Richmond. There are 38 property listings for sale in Barton.
What streets have the most expensive properties for sale in Barton?
The streets with the most expensive properties for sale in Barton are Cedar Grove at an average of £498,333, Silver Garth at an average of £435,000 and Wells Green at an average of £332,500.
What streets have the most affordable properties for sale in Barton?
The streets with the most affordable properties for sale in Barton are Silver Meadows at an average of £158,500, St Cuthberts Green at an average of £160,000 and Marygate at an average of £213,877.
Which train stations are available in or near Barton?
Some of the train stations available in or near Barton are Darlington, North Road and Dinsdale.
Property Price Paid in Barton by Year
The average sold property price by year was:
| Year | Average Sold Price | Price Change |
Sold Properties
|
|---|---|---|---|
| 2026 | £310,750 | -1% |
2 Properties |
| 2025 | £314,458 | 17% |
12 Properties |
| 2024 | £261,890 | 14% |
5 Properties |
| 2023 | £224,219 | -24% |
8 Properties |
| 2022 | £277,200 | -17% |
10 Properties |
| 2021 | £325,345 | 11% |
10 Properties |
| 2020 | £289,433 | 24% |
15 Properties |
| 2019 | £219,777 | -39% |
9 Properties |
| 2018 | £304,450 | 13% |
10 Properties |
| 2017 | £264,250 | 26% |
8 Properties |
Property Price per Property Type in Barton
Here you can find historic sold price data in order to help with your property search.
The average Property Paid Price for specific property types in the last three years are:
| Property Type | Average Sold Price | Sold Properties |
|---|---|---|
| Semi Detached House | £173,400.00 | 5 Semi Detached Houses |
| Terraced House | £230,361.00 | 9 Terraced Houses |
| Detached House | £350,611.00 | 13 Detached Houses |
