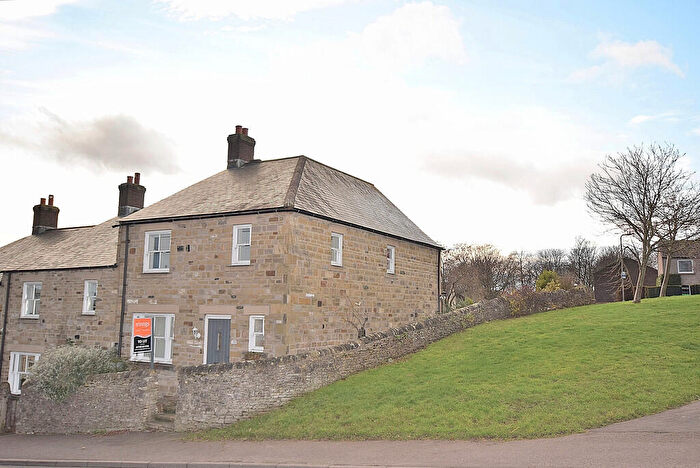
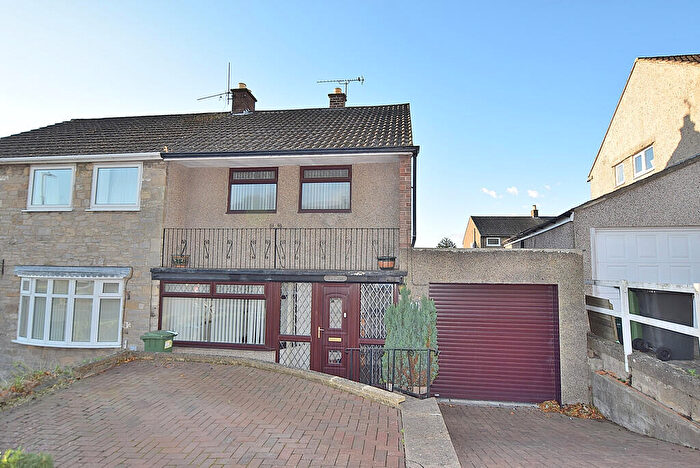
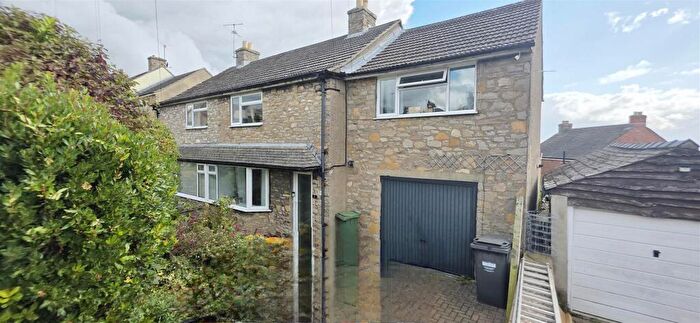
Houses for sale & to rent in Richmond East, Richmond
House Prices in Richmond East
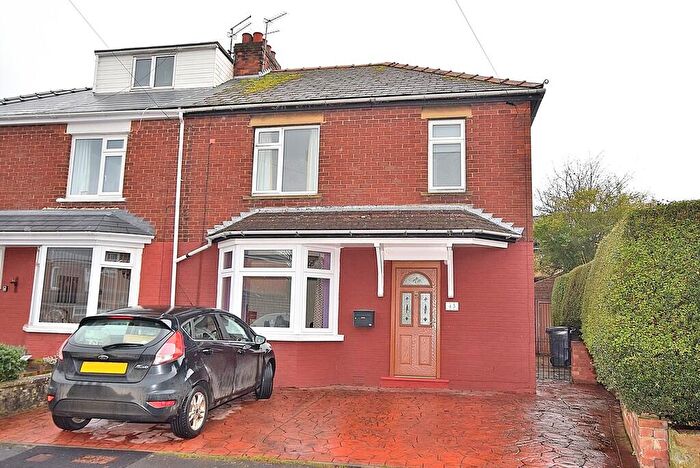
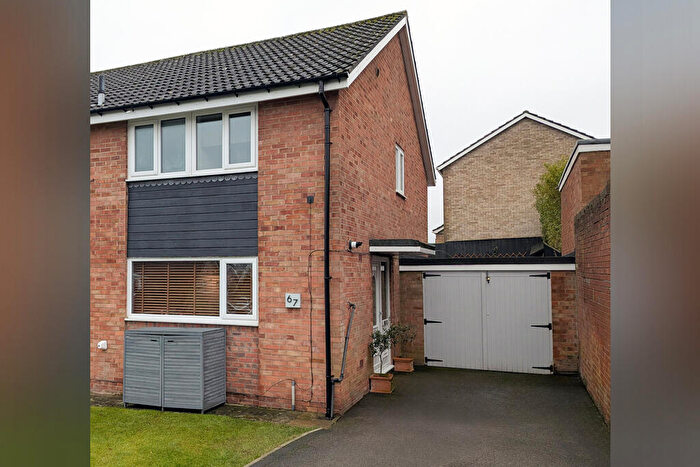
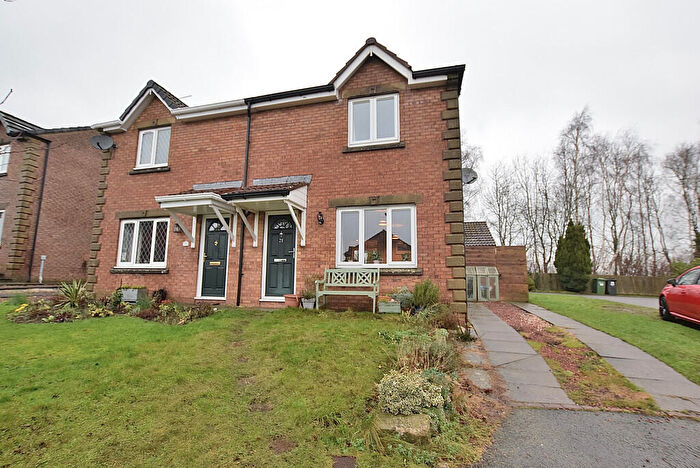
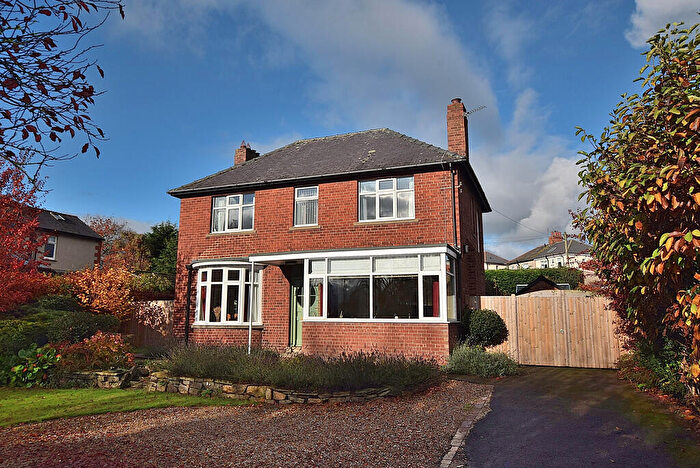
Properties in Richmond East have an average house price of £294,499.00 and had 120 Property Transactions within the last 3 years¹.
Richmond East is an area in Richmond, North Yorkshire with 1,114 households², where the most expensive property was sold for £900,000.00.
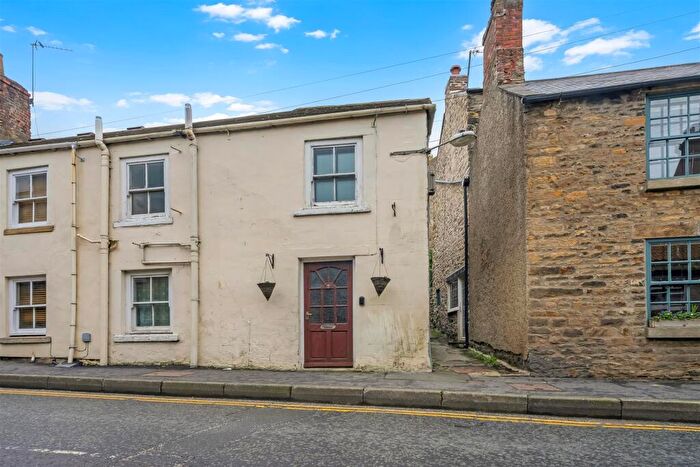
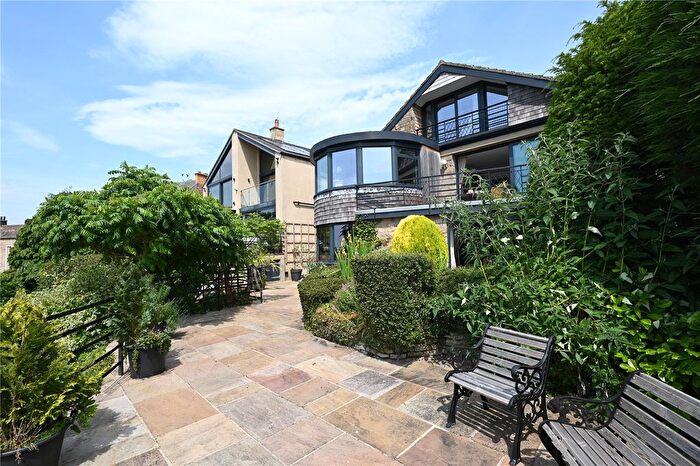
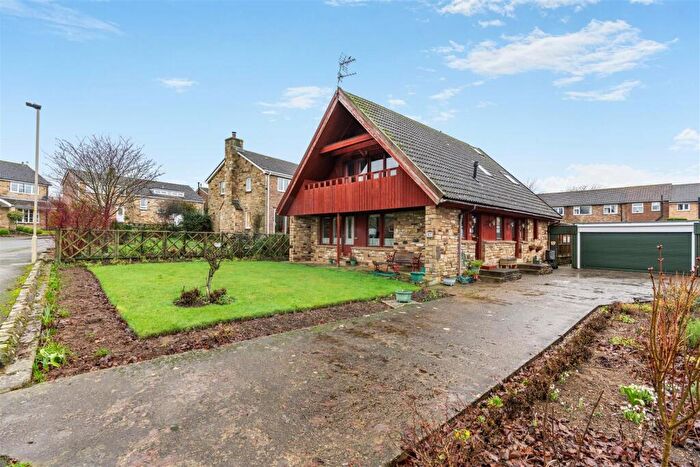
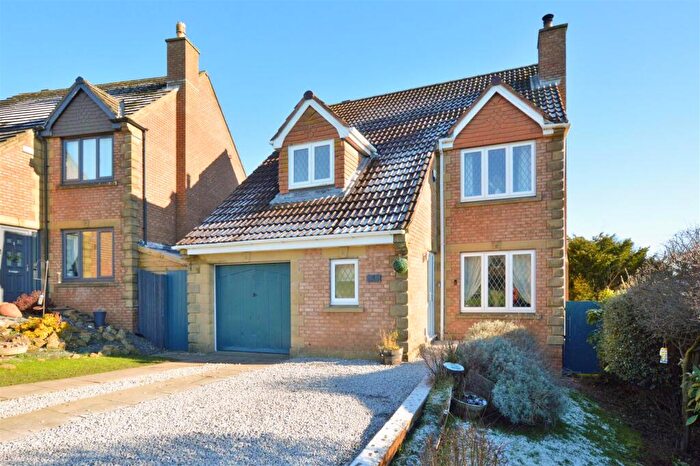
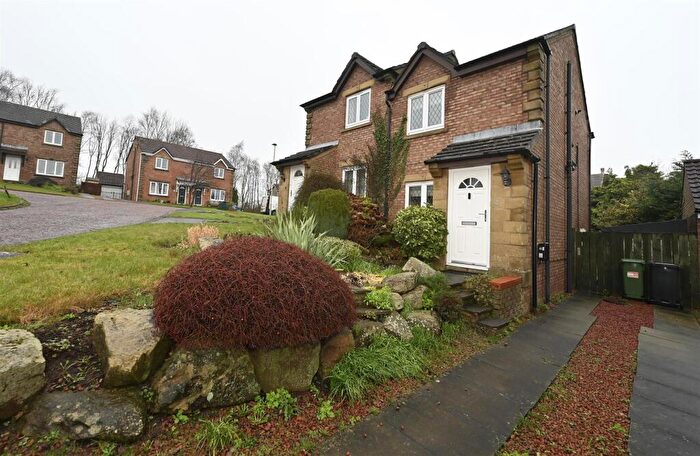
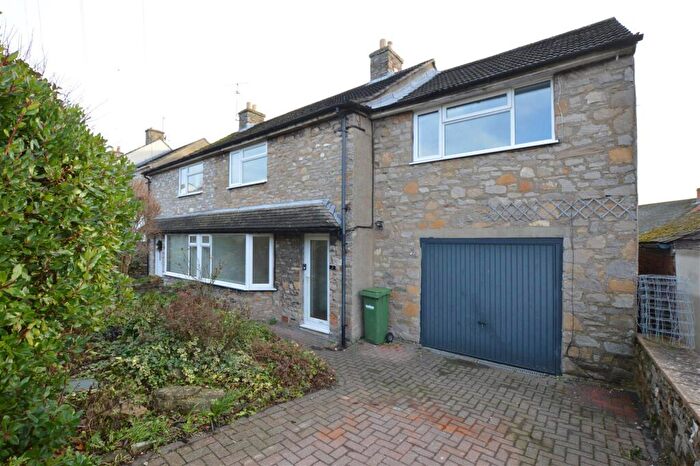
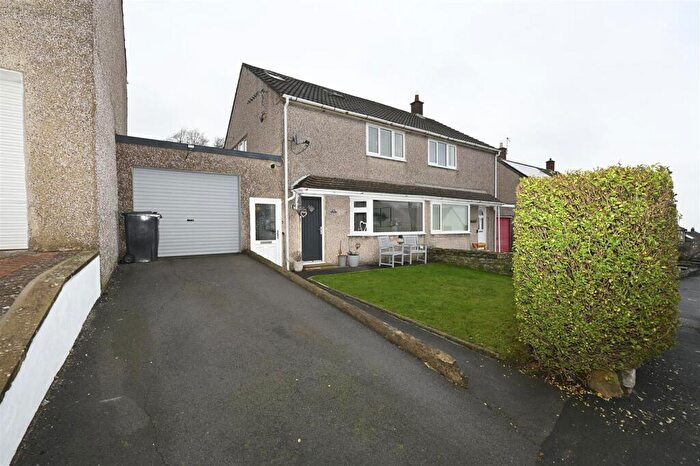
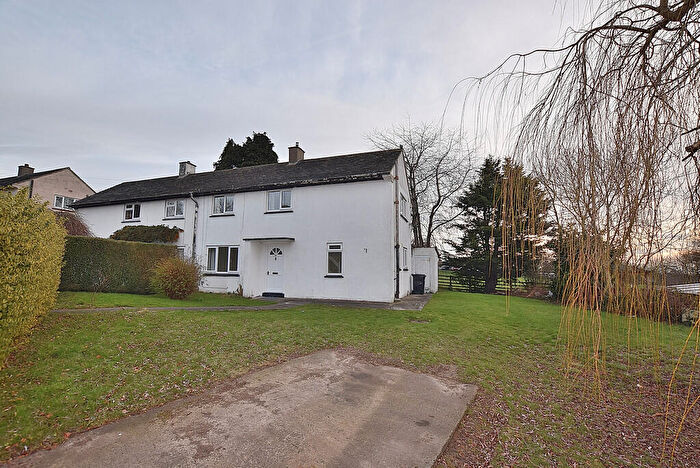
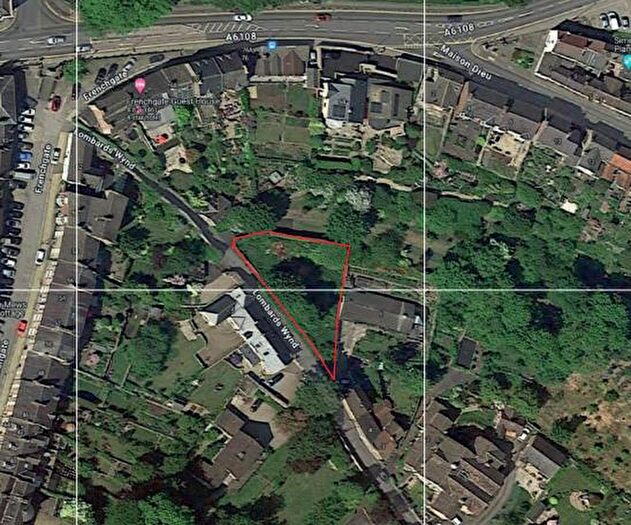
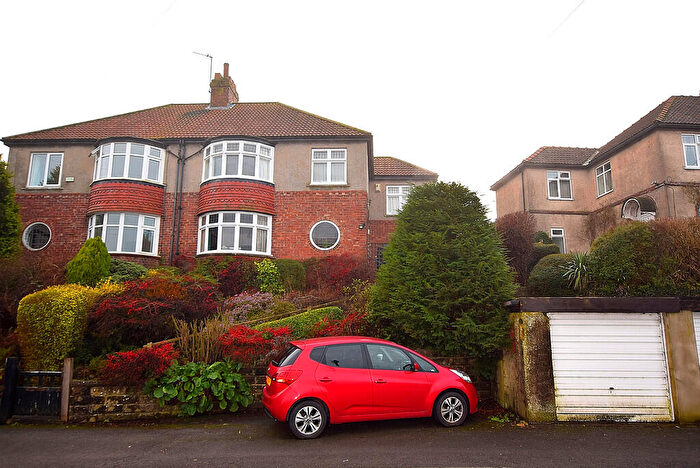
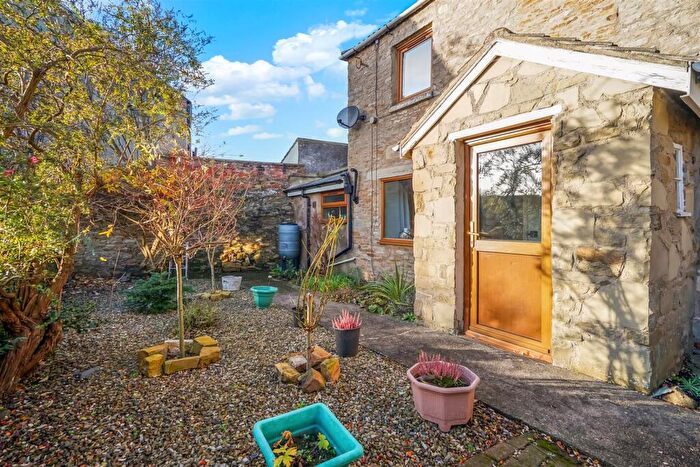
Properties for sale in Richmond East
Roads and Postcodes in Richmond East
Navigate through our locations to find the location of your next house in Richmond East, Richmond for sale or to rent.
| Streets | Postcodes |
|---|---|
| Anchorage Hill | DL10 7AT |
| Aske Avenue | DL10 5DA |
| Boundary Way | DL10 5QF |
| Chandler Close | DL10 5QQ |
| Charles Court | DL10 7BL |
| Cross Lanes | DL10 5BG DL10 5BH DL10 5BL DL10 5DH DL10 5DN DL10 7DZ |
| Darlington Road | DL10 7AW DL10 7BE DL10 7BG DL10 7BF DL10 7BH DL10 7BQ DL10 7DA DL10 7EB |
| Ducket Close | DL10 5QD |
| Earl Edwin Drive | DL10 5AJ DL10 5AL |
| Fontenay Road | DL10 5AE |
| Gilling Close | DL10 5AY |
| Gilling Road | DL10 5AA DL10 5AB DL10 5AD DL10 5AH DL10 5AN DL10 5AW |
| Gordon Crescent | DL10 5AQ |
| Henrietta Close | DL10 7TA |
| James Court | DL10 7BN |
| Jubilee Court | DL10 5FB |
| Lawrence Crescent | DL10 5QE |
| Lennox Avenue | DL10 5AF |
| Linden Gardens | DL10 7BD |
| Mile Planting | DL10 5DB |
| Monument Fields | DL10 7BB |
| Moorside Road | DL10 5DJ |
| Neville Walk | DL10 5AG |
| Olliver Road | DL10 5QA |
| Parsons Court | DL10 7DT |
| Pilmoor Close | DL10 5BQ |
| Pilmoor Drive | DL10 5BJ |
| Pinder Close | DL10 5QG |
| Ronaldshay Close | DL10 5DL |
| Ronaldshay Drive | DL10 5BN DL10 5BW |
| St Nicholas Close | DL10 7SP |
| St Nicholas Drive | DL10 7DY |
| St Trinians Close | DL10 7ST |
| St Trinians Drive | DL10 7SS |
| The Avenue | DL10 7AZ |
| The Crescent | DL10 7BA |
| The Meadows | DL10 7DU |
| Wathcote Close | DL10 7DX |
| Wathcote Place | DL10 7SR |
| White Canons Court | DL10 7DG |
| White Canons Walk | DL10 7DF |
| White Friars Close | DL10 7DN |
| White Friars Gardens | DL10 7DJ |
| White Friars Walk | DL10 7DH |
| White Lands | DL10 7DR |
| White Lilac Close | DL10 7DP |
| White Pastures | DL10 7DS |
| White Rose Crescent | DL10 7DW |
| Whitefields Drive | DL10 7DB DL10 7DL DL10 7DQ DL10 7EA |
| Whitefields Gate | DL10 7DD |
| Whitefields Walk | DL10 7DE |
| York View | DL10 5QB |
| Zetland Drive | DL10 5BP |
| DL10 4LA DL10 7EN |
Transport near Richmond East
-
Darlington Station
-
North Road Station
-
Northallerton Station
-
Dinsdale Station
-
Teesside Airport Station
-
Heighington Station
- FAQ
- Price Paid By Year
- Property Type Price
Frequently asked questions about Richmond East
What is the average price for a property for sale in Richmond East?
The average price for a property for sale in Richmond East is £294,499. This amount is 3% lower than the average price in Richmond. There are 235 property listings for sale in Richmond East.
What streets have the most expensive properties for sale in Richmond East?
The streets with the most expensive properties for sale in Richmond East are The Meadows at an average of £522,500, Chandler Close at an average of £472,500 and The Avenue at an average of £436,000.
What streets have the most affordable properties for sale in Richmond East?
The streets with the most affordable properties for sale in Richmond East are Anchorage Hill at an average of £145,000, Boundary Way at an average of £186,250 and Earl Edwin Drive at an average of £187,000.
Which train stations are available in or near Richmond East?
Some of the train stations available in or near Richmond East are Darlington, North Road and Northallerton.
Property Price Paid in Richmond East by Year
The average sold property price by year was:
| Year | Average Sold Price | Price Change |
Sold Properties
|
|---|---|---|---|
| 2025 | £284,908 | -3% |
34 Properties |
| 2024 | £293,522 | -3% |
45 Properties |
| 2023 | £303,524 | 9% |
41 Properties |
| 2022 | £275,458 | 2% |
35 Properties |
| 2021 | £270,731 | 10% |
49 Properties |
| 2020 | £243,748 | 1% |
38 Properties |
| 2019 | £240,874 | -5% |
49 Properties |
| 2018 | £252,010 | 15% |
53 Properties |
| 2017 | £213,693 | 1% |
55 Properties |
| 2016 | £212,463 | 1% |
44 Properties |
| 2015 | £211,041 | 7% |
36 Properties |
| 2014 | £196,608 | -2% |
45 Properties |
| 2013 | £201,141 | 5% |
39 Properties |
| 2012 | £190,583 | -1% |
24 Properties |
| 2011 | £191,815 | -12% |
40 Properties |
| 2010 | £215,644 | 15% |
37 Properties |
| 2009 | £182,627 | -19% |
38 Properties |
| 2008 | £217,690 | 11% |
26 Properties |
| 2007 | £192,816 | -1% |
42 Properties |
| 2006 | £195,414 | -6% |
43 Properties |
| 2005 | £206,347 | 16% |
52 Properties |
| 2004 | £173,420 | 15% |
51 Properties |
| 2003 | £147,871 | 25% |
58 Properties |
| 2002 | £110,595 | 13% |
63 Properties |
| 2001 | £96,305 | 9% |
62 Properties |
| 2000 | £87,506 | 17% |
57 Properties |
| 1999 | £72,379 | -5% |
62 Properties |
| 1998 | £76,151 | 3% |
62 Properties |
| 1997 | £74,007 | 7% |
52 Properties |
| 1996 | £68,561 | -2% |
70 Properties |
| 1995 | £69,729 | - |
44 Properties |
Property Price per Property Type in Richmond East
Here you can find historic sold price data in order to help with your property search.
The average Property Paid Price for specific property types in the last three years are:
| Property Type | Average Sold Price | Sold Properties |
|---|---|---|
| Semi Detached House | £242,343.00 | 61 Semi Detached Houses |
| Detached House | £406,785.00 | 42 Detached Houses |
| Terraced House | £219,107.00 | 14 Terraced Houses |
| Flat | £134,816.00 | 3 Flats |

