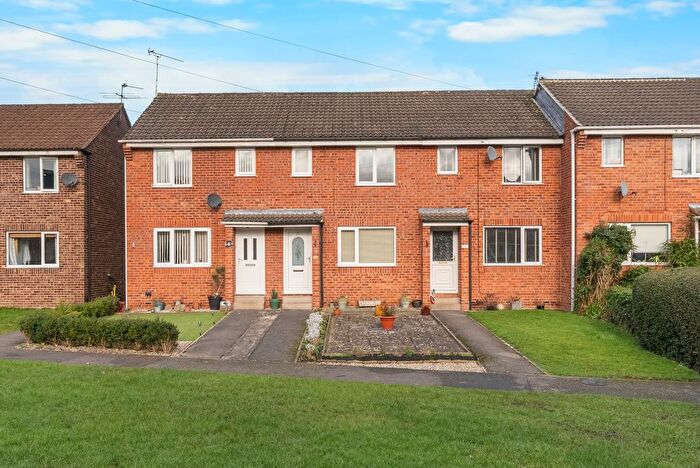
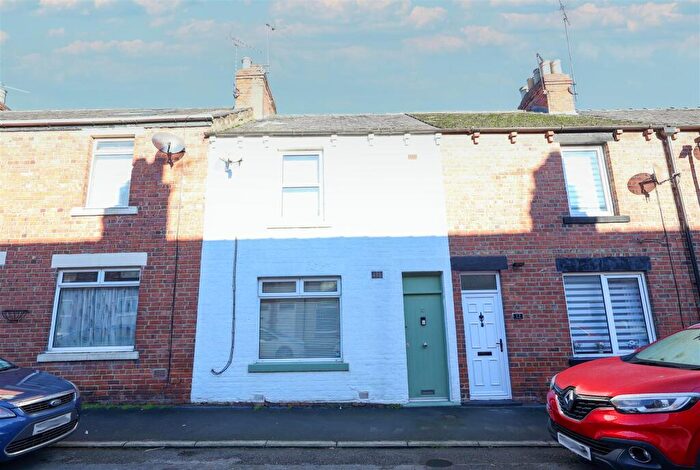
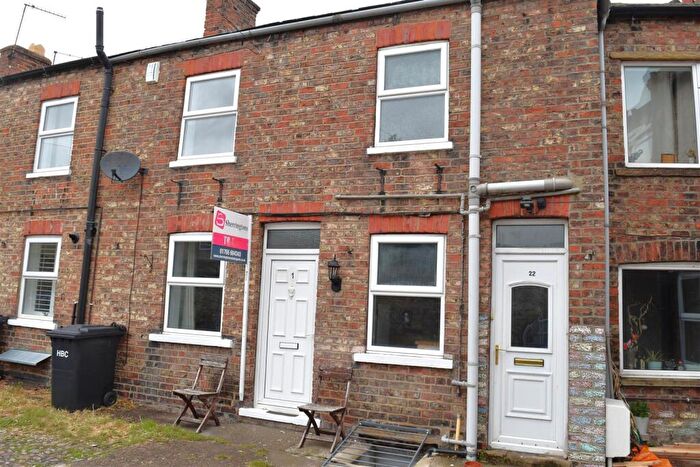
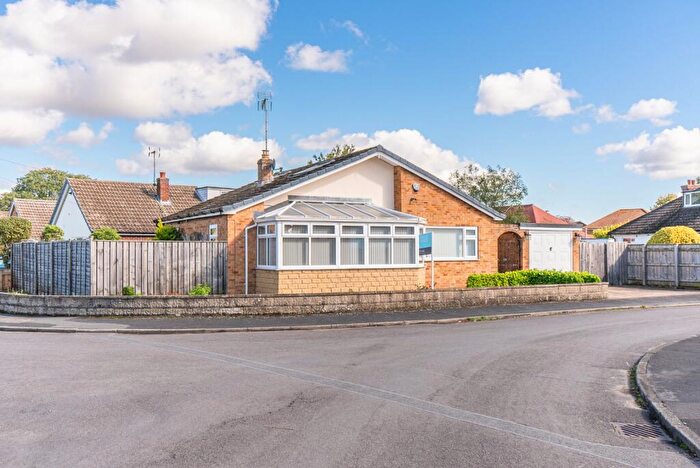
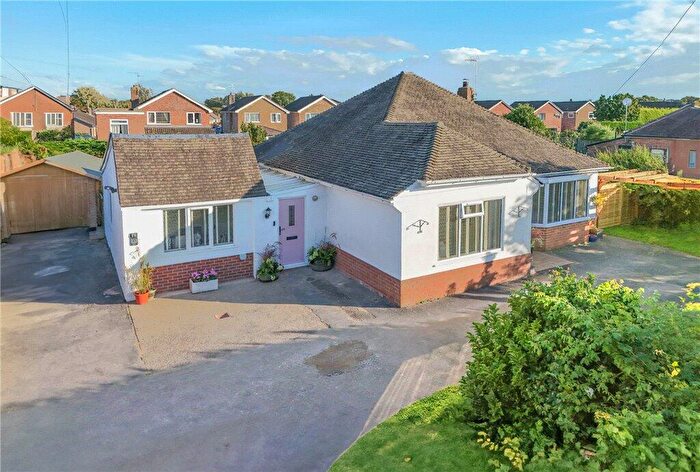
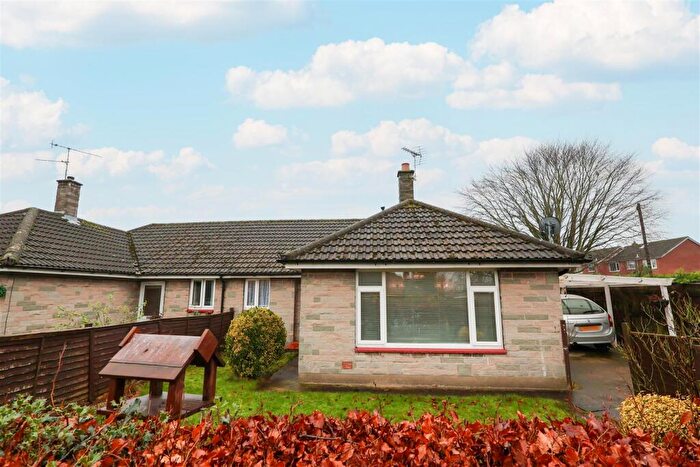
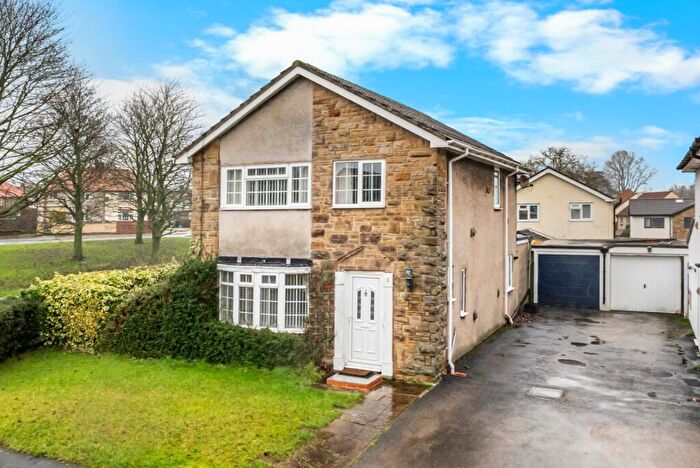
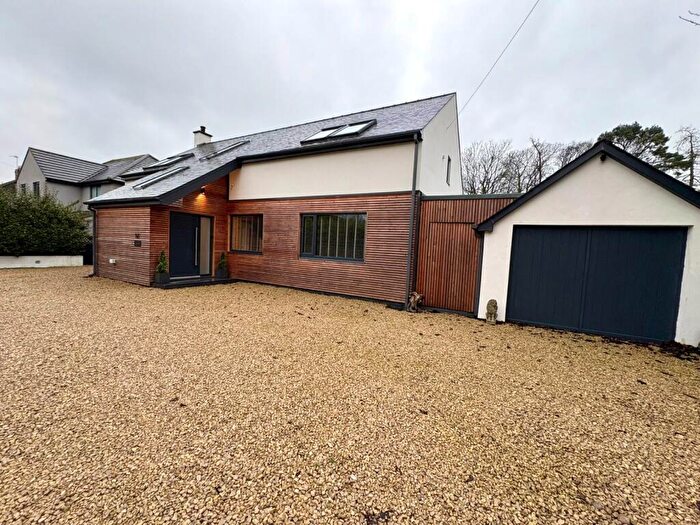
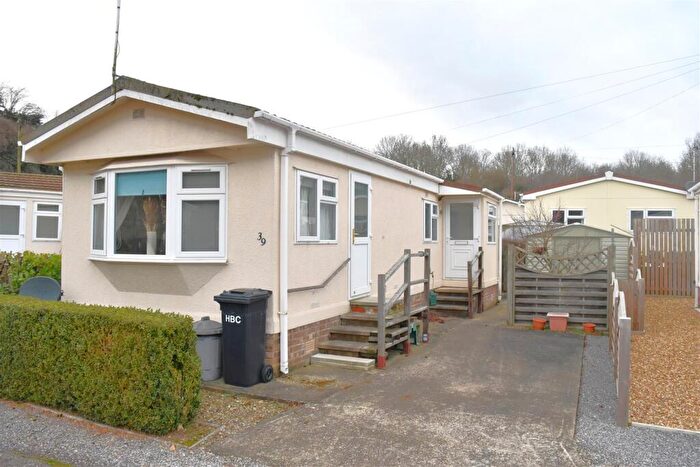
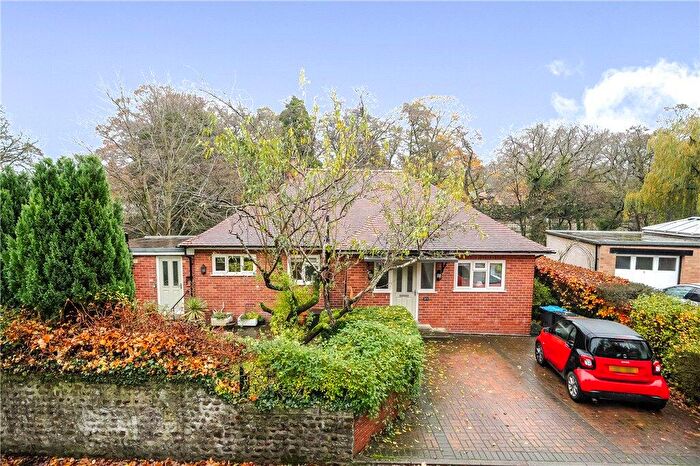
Houses for sale & to rent in Ripon Moorside, Ripon
House Prices in Ripon Moorside
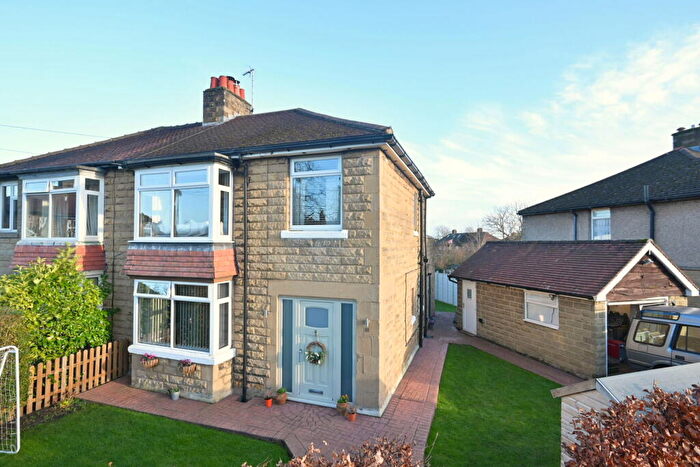
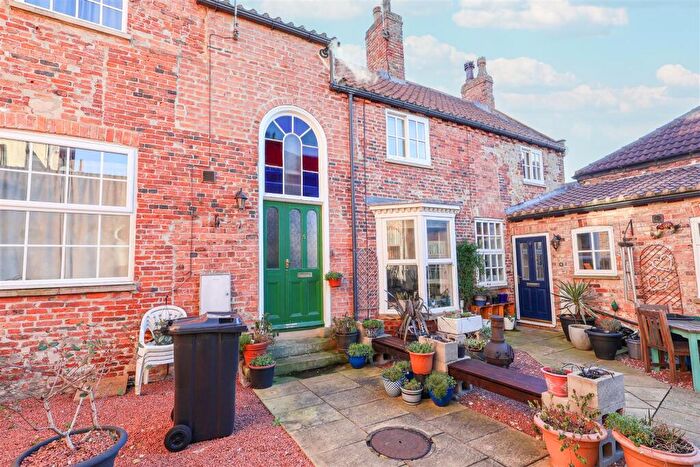
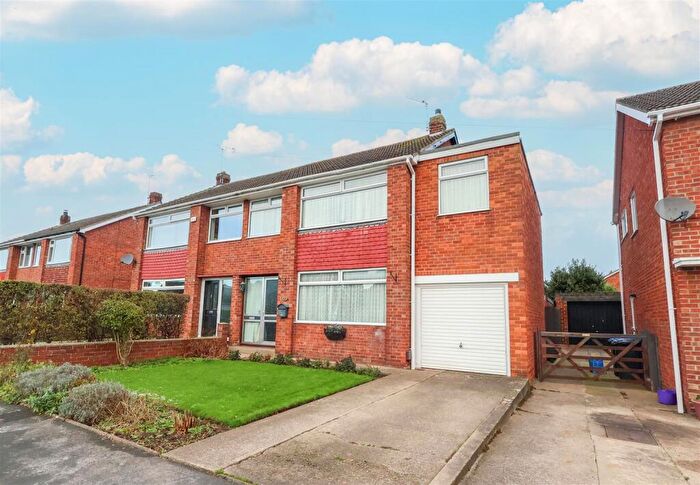
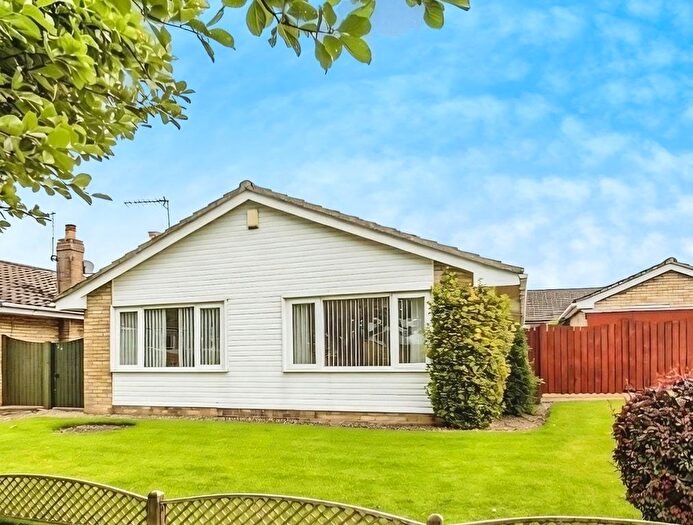
Properties in Ripon Moorside have an average house price of £287,570.00 and had 169 Property Transactions within the last 3 years¹.
Ripon Moorside is an area in Ripon, North Yorkshire with 2,061 households², where the most expensive property was sold for £730,000.00.
Properties for sale in Ripon Moorside
Roads and Postcodes in Ripon Moorside
Navigate through our locations to find the location of your next house in Ripon Moorside, Ripon for sale or to rent.
| Streets | Postcodes |
|---|---|
| Aismunderby Close | HG4 1NT |
| Aismunderby Road | HG4 1SD HG4 1SQ |
| Ambrose Road | HG4 1SH |
| Balmoral Road | HG4 1RP |
| Beech Road | HG4 2PH |
| Bluebell Close | HG4 1AW |
| Borrage Green Lane | HG4 2JH |
| Carr Close | HG4 2LU |
| Cedar Close | HG4 2PQ |
| Curfew Road | HG4 1SG |
| Cypress Gardens | HG4 2LT |
| Deep Ghyll Croft | HG4 1RN |
| Deep Ghyll Walk | HG4 1RL |
| Dudley Walk | HG4 2PJ |
| Edens Way | HG4 1RB |
| Elm Road | HG4 2PE |
| Gallows Hill Drive | HG4 1UP |
| Gallows Hill Park | HG4 1UL |
| Grange Park Road | HG4 2NJ |
| Greystone Close | HG4 1WD |
| Grove Close | HG4 1SY |
| Grove Lane | HG4 1TH |
| Harewood Road | HG4 1TG |
| Harrogate Road | HG4 1SR HG4 1ST HG4 1SU HG4 1SZ HG4 2SB HG4 2SD |
| Hell Wath Grove | HG4 2JT |
| Hell Wath Lane | HG4 2SE |
| Highfield Road | HG4 2JZ |
| Holmefield Crescent | HG4 1RX |
| Holmefield Road | HG4 1RU HG4 1RZ |
| Kent Close | HG4 2LL |
| King Edward Road | HG4 1RR HG4 1SB |
| King George Road | HG4 1RT |
| Kingston Avenue | HG4 1TJ |
| Kingstonia Gardens | HG4 1TE |
| Kingstonia Place | HG4 1TF |
| Lead Lane | HG4 2LN HG4 2NE HG4 2PF |
| Lime Walk | HG4 2NF |
| Lindrick Close | HG4 2PL |
| Locker Lane | HG4 1SS |
| Long Meadows | HG4 2LX |
| Maple Walk | HG4 2ND |
| Marina Way | HG4 2LJ |
| Meadow Avenue | HG4 2NL |
| Meadow Vale | HG4 2PN |
| Moorside Avenue | HG4 1TA |
| Moorside Dale | HG4 2RY HG4 2RZ |
| Moorside View | HG4 2RU |
| Newlands Drive | HG4 2JY |
| Oak Road | HG4 2LP HG4 2NA HG4 2NB |
| Peckfield | HG4 2SF |
| Pine Walk | HG4 2LW |
| Princess Royal Road | HG4 1TQ |
| Quarry Moor Lane | HG4 1RH HG4 1RJ HG4 2SA HG4 1RW |
| Quarry Road | HG4 2NN |
| Red Bank Close | HG4 2LG |
| Red Bank Drive | HG4 2LF |
| Red Bank Road | HG4 2LE |
| Ronway Avenue | HG4 2NW |
| Rowan Close | HG4 2NS |
| Sandringham Road | HG4 1SA |
| Sandy Lane | HG4 2PD |
| Shirley Avenue | HG4 1SP |
| Smithfield Close | HG4 2PG |
| Snowden Close | HG4 2PB |
| South Grange Road | HG4 2NH HG4 2PA |
| Southfield Avenue | HG4 2NR |
| Southfield Road | HG4 2NX |
| St Olaves Close | HG4 2JF |
| Sycamore Road | HG4 2LR |
| Wakeman Road | HG4 1SE |
| Wendy Avenue | HG4 1TD |
| West Lane | HG4 2LQ HG4 2NP |
| Westwood Road | HG4 2LH |
| Wheatsheaf Close | HG4 2SH |
| Whitcliffe Avenue | HG4 2JJ |
| Whitcliffe Crescent | HG4 2JP |
| Whitcliffe Drive | HG4 2JX |
| Whitcliffe Grove | HG4 2JW |
| Whitcliffe Lane | HG4 2JL HG4 2JN HG4 2LB HG4 2LD |
| Willow Walk | HG4 2LS |
| Windsor Road | HG4 1RS |
| HG4 2JR |
Transport near Ripon Moorside
- FAQ
- Price Paid By Year
- Property Type Price
Frequently asked questions about Ripon Moorside
What is the average price for a property for sale in Ripon Moorside?
The average price for a property for sale in Ripon Moorside is £287,570. This amount is 15% lower than the average price in Ripon. There are 609 property listings for sale in Ripon Moorside.
What streets have the most expensive properties for sale in Ripon Moorside?
The streets with the most expensive properties for sale in Ripon Moorside are Moorside Avenue at an average of £541,666, Shirley Avenue at an average of £537,500 and Greystone Close at an average of £520,000.
What streets have the most affordable properties for sale in Ripon Moorside?
The streets with the most affordable properties for sale in Ripon Moorside are Cypress Gardens at an average of £160,070, Newlands Drive at an average of £167,333 and Aismunderby Road at an average of £167,900.
Which train stations are available in or near Ripon Moorside?
Some of the train stations available in or near Ripon Moorside are Knaresborough, Starbeck and Harrogate.
Property Price Paid in Ripon Moorside by Year
The average sold property price by year was:
| Year | Average Sold Price | Price Change |
Sold Properties
|
|---|---|---|---|
| 2025 | £306,364 | 14% |
48 Properties |
| 2024 | £263,156 | -13% |
60 Properties |
| 2023 | £296,796 | 7% |
61 Properties |
| 2022 | £276,523 | 4% |
98 Properties |
| 2021 | £264,601 | 8% |
130 Properties |
| 2020 | £244,418 | 3% |
90 Properties |
| 2019 | £236,252 | -5% |
74 Properties |
| 2018 | £247,126 | 7% |
74 Properties |
| 2017 | £229,245 | 4% |
74 Properties |
| 2016 | £219,839 | 5% |
83 Properties |
| 2015 | £209,823 | 6% |
75 Properties |
| 2014 | £197,880 | 2% |
80 Properties |
| 2013 | £193,633 | -1% |
56 Properties |
| 2012 | £195,101 | 3% |
58 Properties |
| 2011 | £188,851 | 0,4% |
63 Properties |
| 2010 | £188,085 | -4% |
46 Properties |
| 2009 | £195,621 | 6% |
39 Properties |
| 2008 | £184,840 | -11% |
51 Properties |
| 2007 | £205,703 | 9% |
86 Properties |
| 2006 | £186,422 | 2% |
115 Properties |
| 2005 | £181,837 | 5% |
85 Properties |
| 2004 | £172,217 | 17% |
101 Properties |
| 2003 | £142,291 | 23% |
87 Properties |
| 2002 | £109,139 | 24% |
94 Properties |
| 2001 | £83,474 | 0,3% |
95 Properties |
| 2000 | £83,255 | 20% |
84 Properties |
| 1999 | £66,823 | -0,3% |
85 Properties |
| 1998 | £67,033 | 7% |
66 Properties |
| 1997 | £62,375 | 1% |
112 Properties |
| 1996 | £62,009 | -0,4% |
110 Properties |
| 1995 | £62,271 | - |
81 Properties |
Property Price per Property Type in Ripon Moorside
Here you can find historic sold price data in order to help with your property search.
The average Property Paid Price for specific property types in the last three years are:
| Property Type | Average Sold Price | Sold Properties |
|---|---|---|
| Semi Detached House | £263,986.00 | 69 Semi Detached Houses |
| Detached House | £387,546.00 | 56 Detached Houses |
| Terraced House | £196,503.00 | 41 Terraced Houses |
| Flat | £208,383.00 | 3 Flats |

