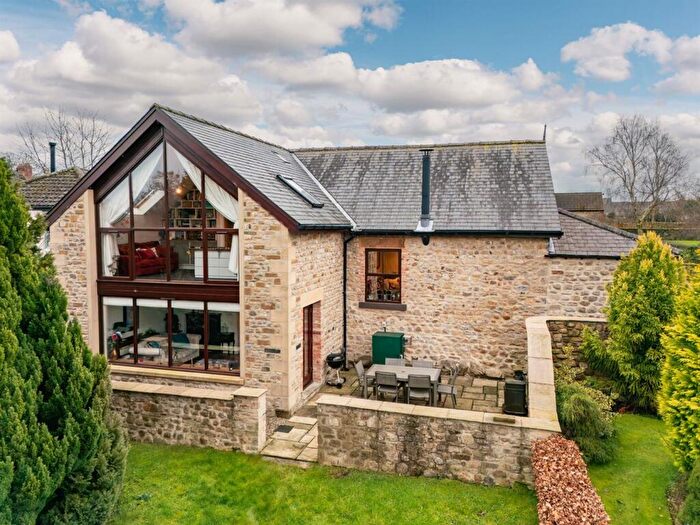
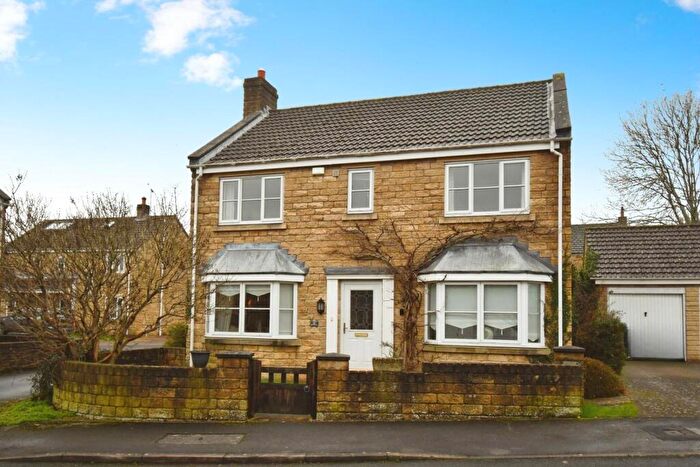
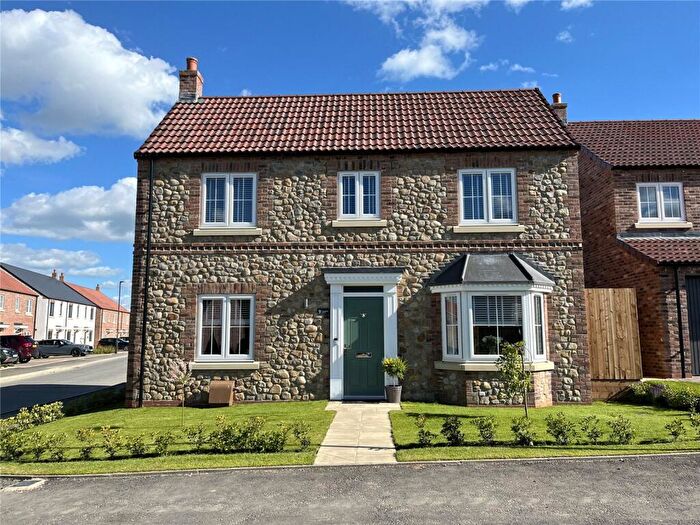
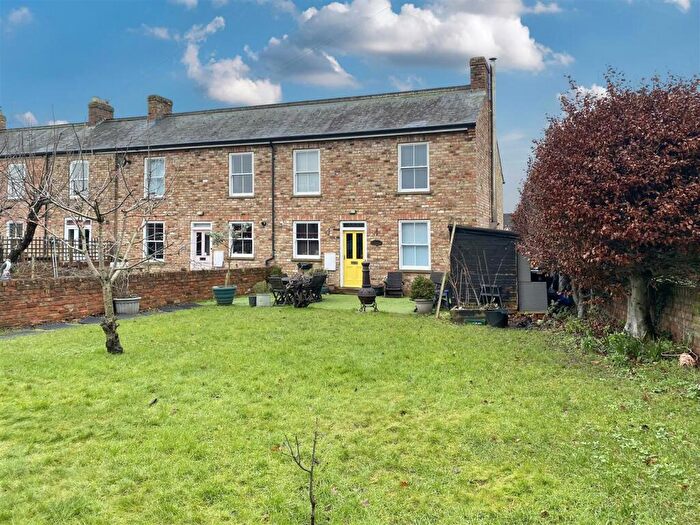
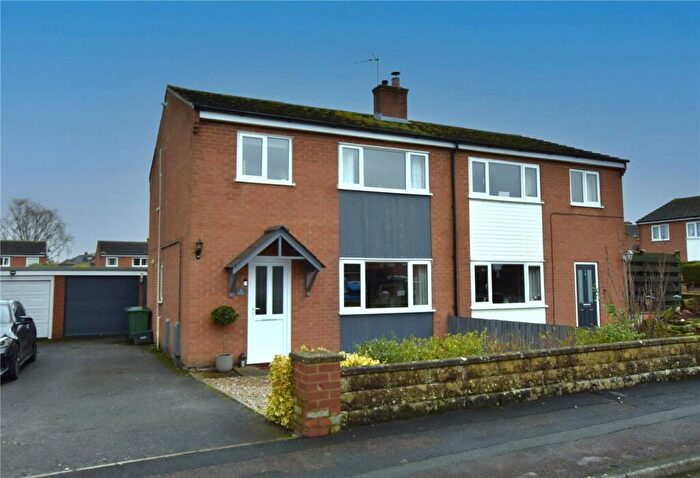
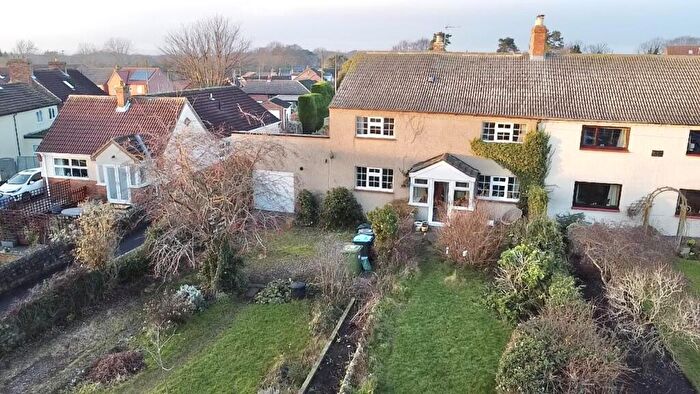
Houses for sale & to rent in Tanfield, Ripon
House Prices in Tanfield
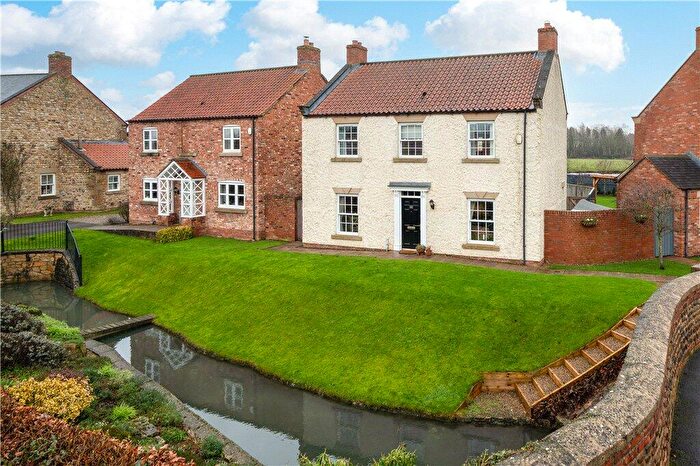
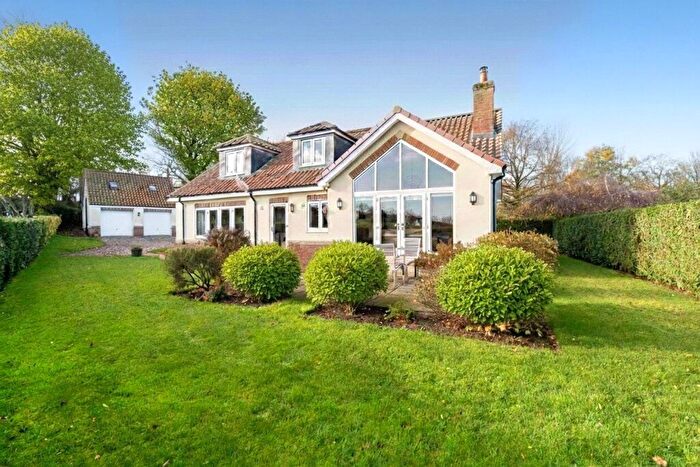
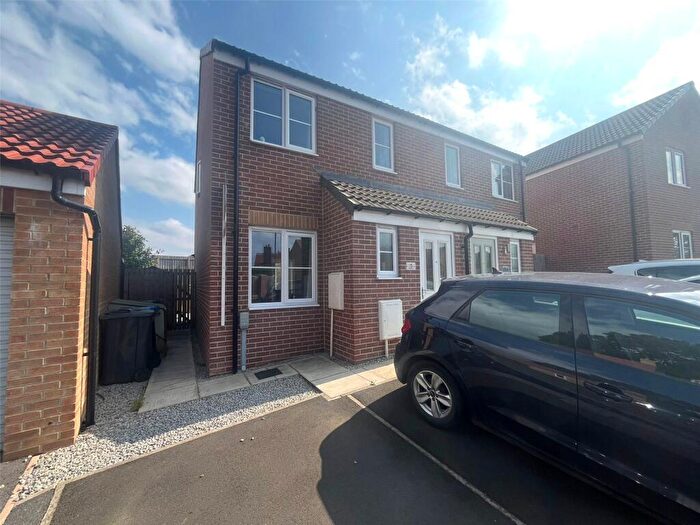
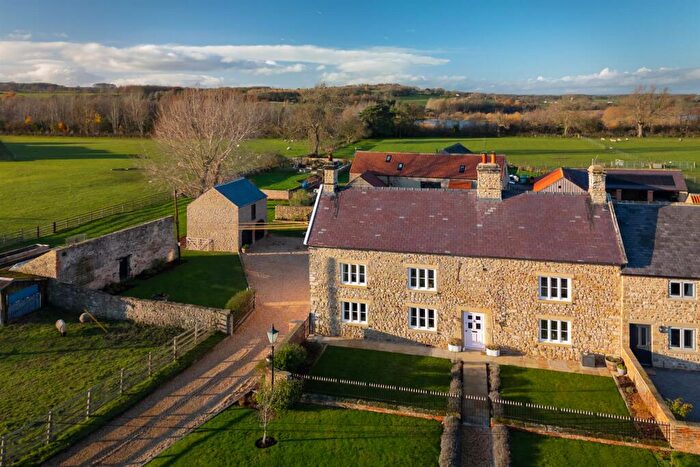
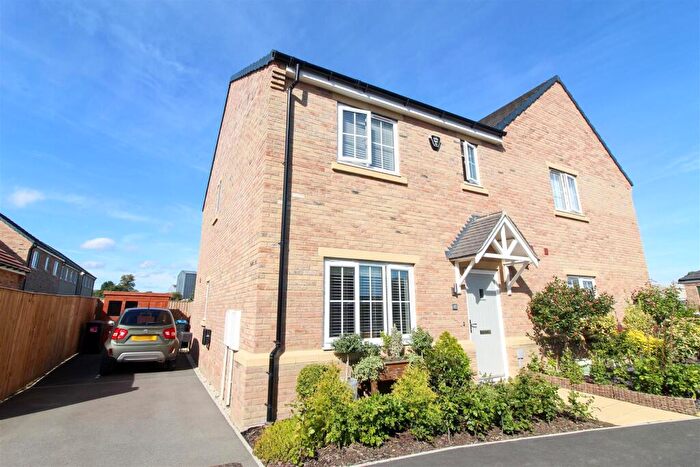
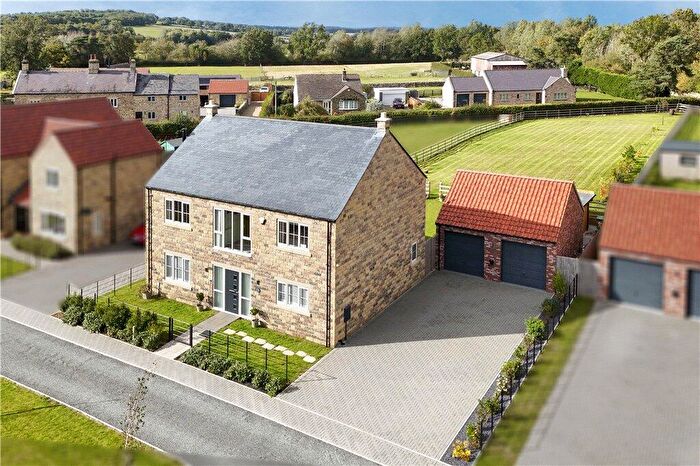
Properties in Tanfield have an average house price of £329,376.00 and had 17 Property Transactions within the last 3 years¹.
Tanfield is an area in Ripon, North Yorkshire with 220 households², where the most expensive property was sold for £940,000.00.
Properties for sale in Tanfield
Roads and Postcodes in Tanfield
Navigate through our locations to find the location of your next house in Tanfield, Ripon for sale or to rent.
| Streets | Postcodes |
|---|---|
| Big Yard | HG4 4AP |
| Bridge View | HG4 5JL |
| Church Street | HG4 5JQ |
| Fox Covert Bungalows | HG4 4AN |
| Long Row | HG4 5JX |
| Main Street | HG4 5JH HG4 5JJ |
| Marmion Close | HG4 5JF |
| Mowbray Court | HG4 5JD |
| Mowbray Terrace | HG4 5JN |
| Nosterfield Road | HG4 5JZ |
| Regency Place | HG4 5FD |
| Sleegill Cottages | HG4 5LA |
| Station Road | HG4 5JW |
| Watlass Moor Lane | HG4 4BF |
| HG4 4DW HG4 5JP HG4 5JR HG4 5JY HG4 5LN HG4 4AA HG4 4AB HG4 4AD HG4 4AE HG4 4AG HG4 4AJ HG4 4AQ HG4 4AS HG4 4AT HG4 4AY HG4 4BT HG4 4DP HG4 5JS HG4 5JT HG4 5JU HG4 5LB HG4 5LD HG4 5LE HG4 5LF HG4 5LG HG4 5LH HG4 5LL HG4 5LQ HG4 5LW |
Transport near Tanfield
-
Thirsk Station
-
Northallerton Station
-
Knaresborough Station
-
Starbeck Station
-
Harrogate Station
-
Hornbeam Park Station
-
Pannal Station
-
Cattal Station
- FAQ
- Price Paid By Year
- Property Type Price
Frequently asked questions about Tanfield
What is the average price for a property for sale in Tanfield?
The average price for a property for sale in Tanfield is £329,376. This amount is 3% lower than the average price in Ripon. There are 795 property listings for sale in Tanfield.
What streets have the most expensive properties for sale in Tanfield?
The streets with the most expensive properties for sale in Tanfield are Nosterfield Road at an average of £358,000 and Regency Place at an average of £269,723.
What streets have the most affordable properties for sale in Tanfield?
The street with the most affordable properties for sale in Tanfield is Mowbray Court at an average of £195,000.
Which train stations are available in or near Tanfield?
Some of the train stations available in or near Tanfield are Thirsk, Northallerton and Knaresborough.
Property Price Paid in Tanfield by Year
The average sold property price by year was:
| Year | Average Sold Price | Price Change |
Sold Properties
|
|---|---|---|---|
| 2025 | £388,250 | 24% |
4 Properties |
| 2024 | £294,500 | -11% |
6 Properties |
| 2023 | £325,628 | 8% |
7 Properties |
| 2022 | £298,968 | -17% |
20 Properties |
| 2021 | £348,786 | -6% |
19 Properties |
| 2020 | £369,218 | -48% |
9 Properties |
| 2019 | £545,415 | 23% |
6 Properties |
| 2018 | £419,000 | -7% |
3 Properties |
| 2017 | £447,590 | -34% |
5 Properties |
| 2016 | £599,750 | -19% |
4 Properties |
| 2015 | £711,950 | 38% |
2 Properties |
| 2014 | £441,166 | 24% |
3 Properties |
| 2013 | £333,333 | 21% |
3 Properties |
| 2012 | £262,500 | 67% |
3 Properties |
| 2011 | £86,750 | -330% |
1 Property |
| 2010 | £373,000 | 20% |
5 Properties |
| 2009 | £300,000 | -6% |
1 Property |
| 2008 | £318,000 | -2% |
2 Properties |
| 2007 | £325,000 | 23% |
1 Property |
| 2006 | £249,500 | 5% |
4 Properties |
| 2005 | £237,500 | -22% |
5 Properties |
| 2004 | £288,666 | 28% |
3 Properties |
| 2003 | £207,500 | 17% |
2 Properties |
| 2002 | £173,000 | 19% |
2 Properties |
| 2001 | £139,833 | 11% |
3 Properties |
| 2000 | £124,500 | 33% |
4 Properties |
| 1999 | £83,250 | -20% |
4 Properties |
| 1998 | £99,500 | -24% |
5 Properties |
| 1997 | £123,362 | 41% |
4 Properties |
| 1996 | £73,166 | -31% |
3 Properties |
| 1995 | £95,650 | - |
3 Properties |
Property Price per Property Type in Tanfield
Here you can find historic sold price data in order to help with your property search.
The average Property Paid Price for specific property types in the last three years are:
| Property Type | Average Sold Price | Sold Properties |
|---|---|---|
| Semi Detached House | £315,625.00 | 4 Semi Detached Houses |
| Detached House | £455,623.00 | 8 Detached Houses |
| Terraced House | £138,382.00 | 5 Terraced Houses |

