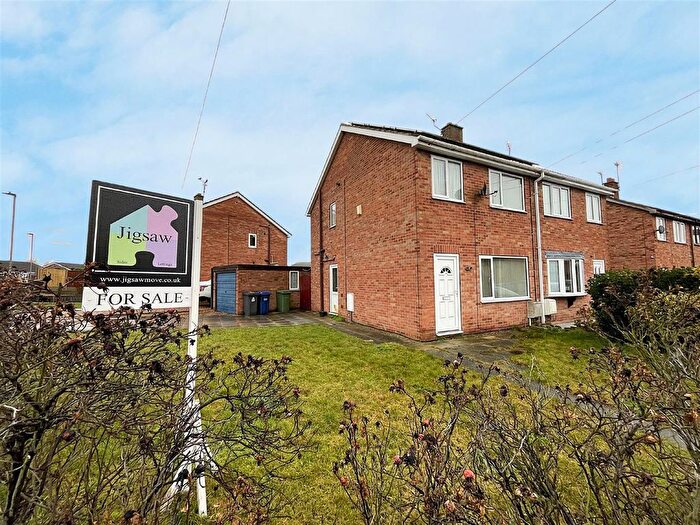
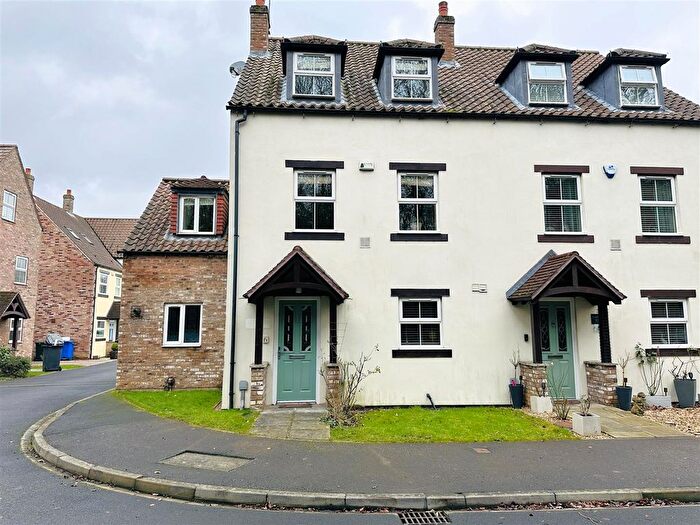
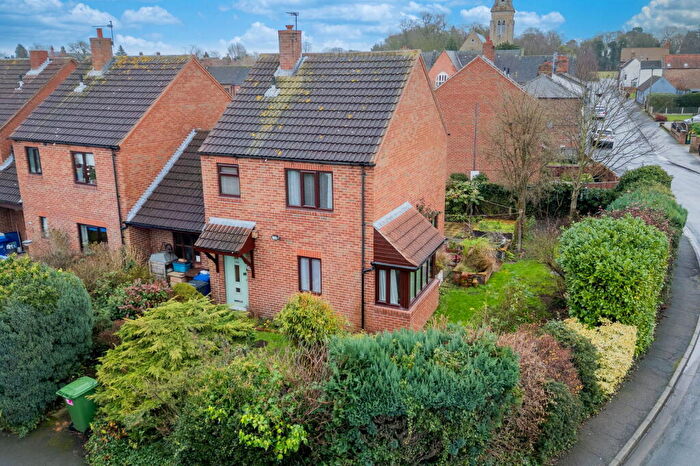
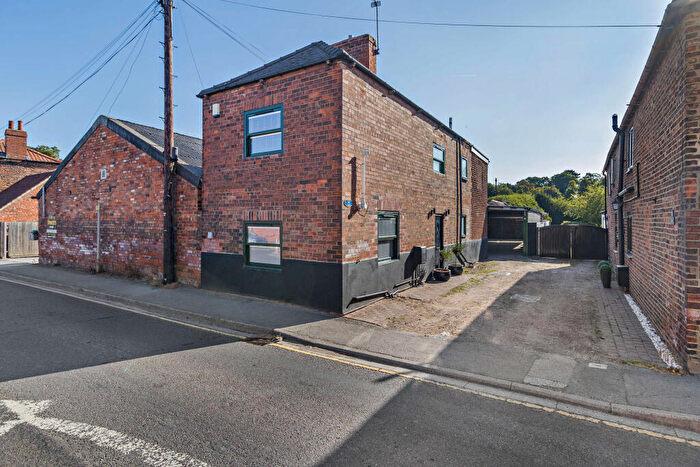
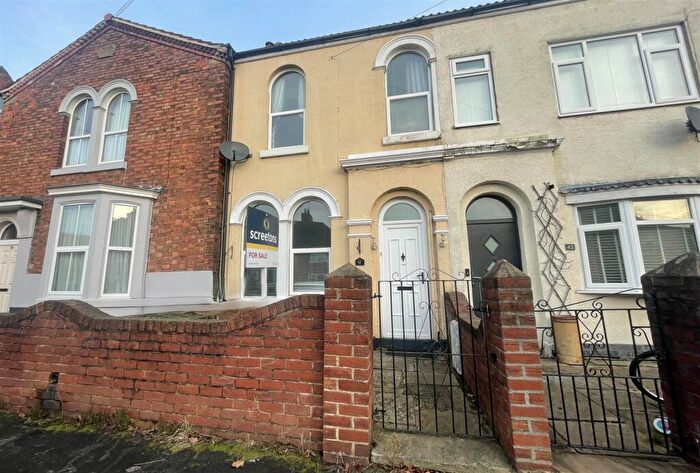
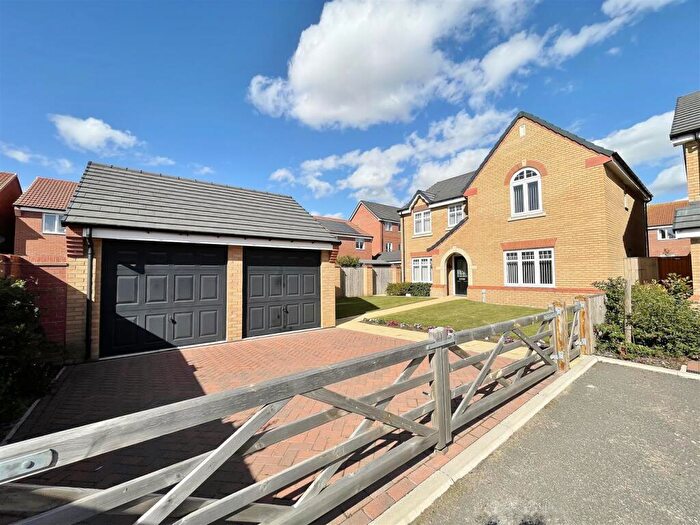
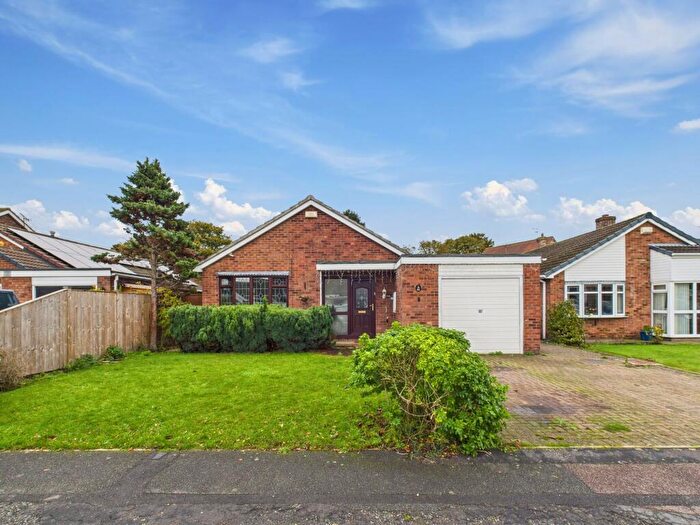
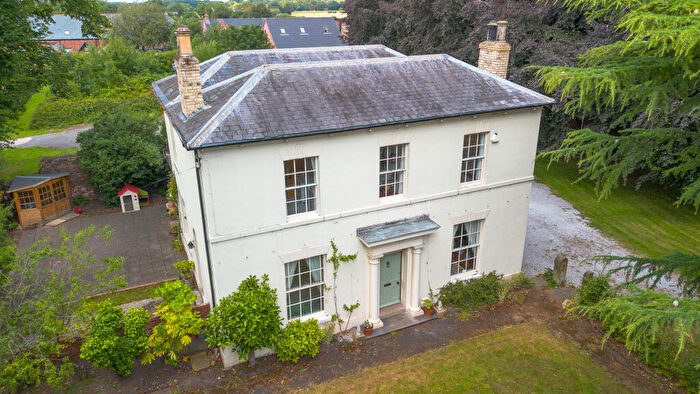
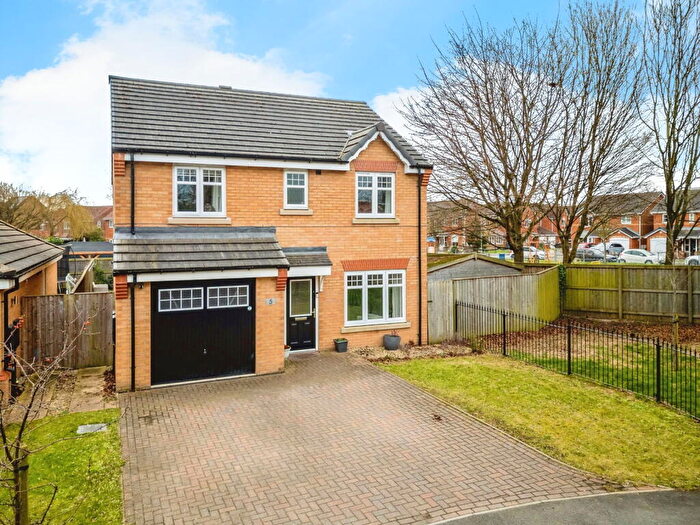
Houses for sale & to rent in Camblesforth, Selby
House Prices in Camblesforth
Properties in Camblesforth have an average house price of £238,463.00 and had 97 Property Transactions within the last 3 years¹.
Camblesforth is an area in Selby, North Yorkshire with 896 households², where the most expensive property was sold for £900,000.00.
Properties for sale in Camblesforth
Roads and Postcodes in Camblesforth
Navigate through our locations to find the location of your next house in Camblesforth, Selby for sale or to rent.
| Streets | Postcodes |
|---|---|
| Barn Elms | YO8 8GY |
| Beech Grove | YO8 8HU |
| Beech Tree Lane | YO8 8HT |
| Brier Lane | YO8 8PR |
| Brigg Farm Court | YO8 8JR |
| Brigg Lane | YO8 8HD YO8 8HE YO8 8HJ YO8 8HL YO8 8HS |
| Camela Lane | YO8 8HA YO8 8HB |
| Castle Hill Lane | YO8 8NP |
| Chapel Court | YO8 8RF |
| Chester Court | YO8 8JD |
| Chestercourt Cottages | YO8 8HZ |
| Church Dike Lane | YO8 8NZ |
| Council Houses | YO8 8HY |
| Croft Road | YO8 8JL YO8 8JS |
| Croft Way | YO8 8JJ |
| Daisy Hill | YO8 8NR |
| Grange Road | YO8 8HF |
| Hales Lane | YO8 8PL |
| Halfway Cottages | YO8 8PP |
| Hardenshaw Lane | YO8 8JA |
| Lingcroft Close | YO8 8JT |
| Long Acre | YO8 8GN |
| Main Road | YO8 8NJ YO8 8NN YO8 8NT YO8 8NX YO8 8PA |
| Manor Close | YO8 8HP |
| Manor Drive | YO8 8RA |
| Mill Lane | YO8 8HW YO8 8NU |
| Millfield Drive | YO8 8JY |
| Newland | YO8 8PS |
| Oaklands | YO8 8HH |
| Pear Tree Avenue | YO8 8NQ |
| Pinewood Drive | YO8 8JU |
| Poplar Court | YO8 8LU |
| Poplar Gardens | YO8 8NF |
| Prospect Close | YO8 8HG |
| Prospect Walk | YO8 8HQ |
| Providence Place | YO8 8NW |
| Sandway Drive | YO8 8JX |
| Selby Road | YO8 8HR YO8 8HX YO8 8JE YO8 8NE |
| The Manor Stables | YO8 8RB |
| Underwit Road | YO8 8JN |
| Wadehouse Lane | YO8 8PN |
| Wentworth Close | YO8 8JZ |
| Wetherall Close | YO8 8PE |
| YO8 8NH YO8 8PW |
Transport near Camblesforth
- FAQ
- Price Paid By Year
- Property Type Price
Frequently asked questions about Camblesforth
What is the average price for a property for sale in Camblesforth?
The average price for a property for sale in Camblesforth is £238,463. This amount is 2% lower than the average price in Selby. There are 590 property listings for sale in Camblesforth.
What streets have the most expensive properties for sale in Camblesforth?
The streets with the most expensive properties for sale in Camblesforth are Newland at an average of £417,500, Selby Road at an average of £359,000 and Brier Lane at an average of £354,000.
What streets have the most affordable properties for sale in Camblesforth?
The streets with the most affordable properties for sale in Camblesforth are Prospect Walk at an average of £110,000, Prospect Close at an average of £135,250 and Grange Road at an average of £154,250.
Which train stations are available in or near Camblesforth?
Some of the train stations available in or near Camblesforth are Snaith, Rawcliffe and Selby.
Property Price Paid in Camblesforth by Year
The average sold property price by year was:
| Year | Average Sold Price | Price Change |
Sold Properties
|
|---|---|---|---|
| 2025 | £230,272 | -4% |
31 Properties |
| 2024 | £240,542 | -2% |
35 Properties |
| 2023 | £244,306 | 0,3% |
31 Properties |
| 2022 | £243,645 | 10% |
31 Properties |
| 2021 | £218,375 | 9% |
61 Properties |
| 2020 | £197,835 | 13% |
39 Properties |
| 2019 | £171,838 | -8% |
45 Properties |
| 2018 | £185,984 | 4% |
55 Properties |
| 2017 | £179,343 | -5% |
50 Properties |
| 2016 | £187,711 | 20% |
47 Properties |
| 2015 | £150,536 | -11% |
57 Properties |
| 2014 | £166,971 | 4% |
52 Properties |
| 2013 | £159,782 | 2% |
37 Properties |
| 2012 | £157,286 | 7% |
29 Properties |
| 2011 | £146,111 | -14% |
22 Properties |
| 2010 | £167,161 | -1% |
27 Properties |
| 2009 | £168,568 | -2% |
17 Properties |
| 2008 | £172,329 | 8% |
24 Properties |
| 2007 | £158,257 | 0,2% |
63 Properties |
| 2006 | £157,948 | 4% |
58 Properties |
| 2005 | £152,298 | 7% |
40 Properties |
| 2004 | £140,976 | 23% |
50 Properties |
| 2003 | £109,167 | 23% |
68 Properties |
| 2002 | £83,552 | 1% |
73 Properties |
| 2001 | £82,759 | 28% |
73 Properties |
| 2000 | £59,683 | 14% |
55 Properties |
| 1999 | £51,119 | -2% |
56 Properties |
| 1998 | £52,004 | 5% |
34 Properties |
| 1997 | £49,197 | 8% |
52 Properties |
| 1996 | £45,216 | -4% |
57 Properties |
| 1995 | £47,066 | - |
41 Properties |
Property Price per Property Type in Camblesforth
Here you can find historic sold price data in order to help with your property search.
The average Property Paid Price for specific property types in the last three years are:
| Property Type | Average Sold Price | Sold Properties |
|---|---|---|
| Semi Detached House | £190,454.00 | 45 Semi Detached Houses |
| Detached House | £371,016.00 | 30 Detached Houses |
| Terraced House | £154,523.00 | 21 Terraced Houses |
| Flat | £185,000.00 | 1 Flat |


