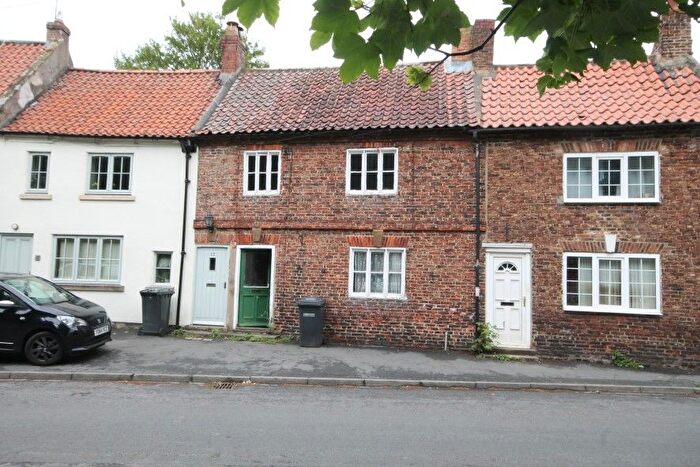
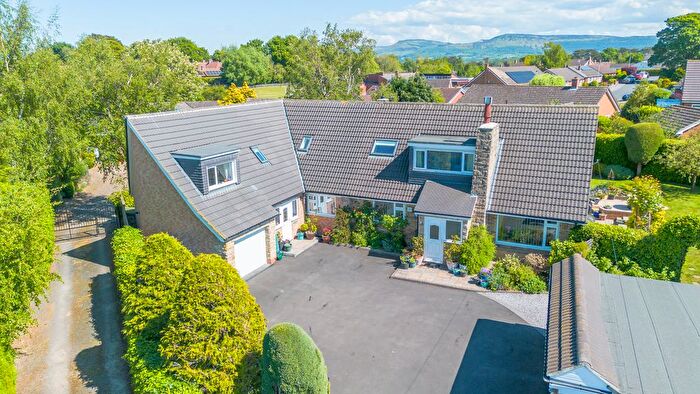
Houses for sale & to rent in Rudby, Yarm
House Prices in Rudby
Properties in Rudby have an average house price of £469,761.00 and had 80 Property Transactions within the last 3 years¹.
Rudby is an area in Yarm, North Yorkshire with 968 households², where the most expensive property was sold for £1,850,000.00.
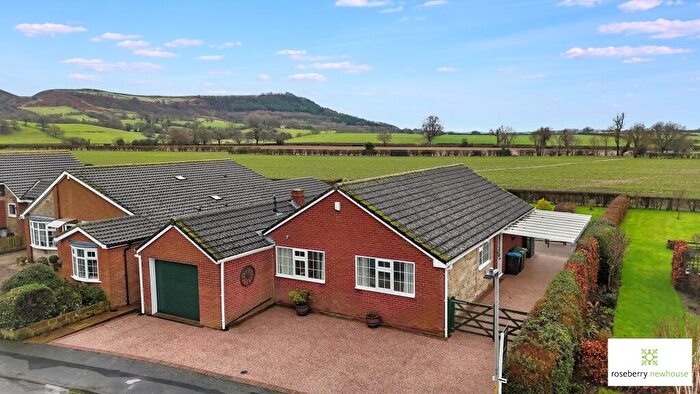
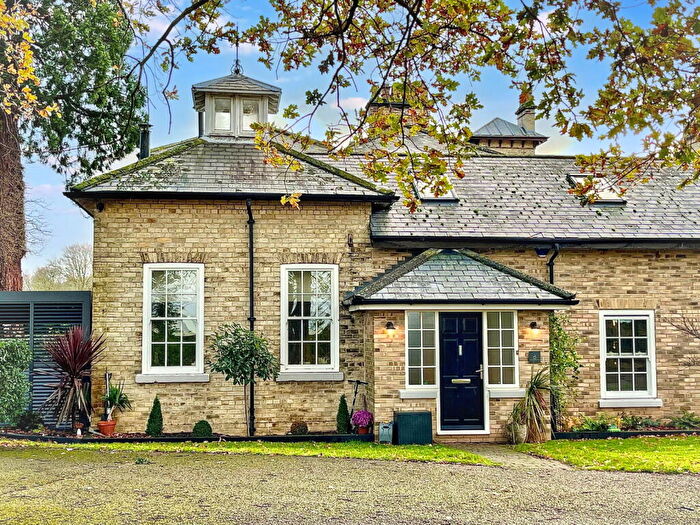
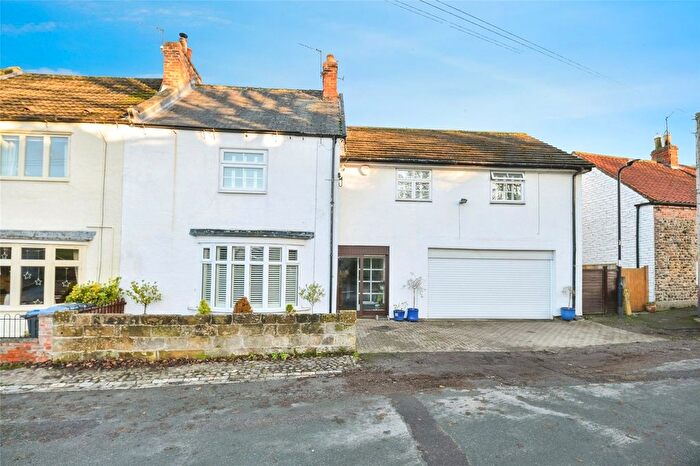
Properties for sale in Rudby
Previously listed properties in Rudby
Roads and Postcodes in Rudby
Navigate through our locations to find the location of your next house in Rudby, Yarm for sale or to rent.
| Streets | Postcodes |
|---|---|
| Agricola Cottages | TS15 0HA |
| Albion Terrace | TS15 0EG |
| Belbrough Close | TS15 0EH |
| Belbrough Lane | TS15 0HP TS15 0HR TS15 0HY TS15 0JA |
| Blue Barn Lane | TS15 0JG |
| Campion Lane | TS15 0DX |
| Codlin Road | TS15 0LB |
| Deepdale | TS15 0DS |
| Doctors Lane | TS15 0EQ |
| East Side | TS15 0DB |
| Eden Close | TS15 0HT |
| Eden Park Road | TS15 0HS |
| Elwick Terrace | TS15 0DH |
| Enterpen | TS15 0AL TS15 0EJ TS15 0EL |
| Garbutts Lane | TS15 0DL TS15 0DN TS15 0DT TS15 0DU |
| Glendale | TS15 0DP |
| Green Lane | TS15 0DY |
| Greenbank Terrace | TS15 0DQ |
| Greenlands | TS15 0JQ |
| Hundale | TS15 0DR |
| Hutton Bank | TS15 0EU |
| Langbaurgh Road | TS15 0HL |
| Levendale | TS15 0DW |
| Levenside | TS15 0EX |
| Linden Close | TS15 0HX |
| Linden Crescent | TS15 0HU |
| Middleton Road | TS15 0JT |
| North End | TS15 0DG |
| North Meadow | TS15 0LD |
| North Side | TS15 0DA |
| Northfields | TS15 0LA |
| Poplar Avenue | TS15 0EW |
| Rudby Lea | TS15 0JZ |
| School Close | TS15 0EP |
| Sexhow Lane | TS15 0EF |
| South Side | TS15 0DD TS15 0DF |
| South View | TS15 0HE |
| Stokesley Road | TS15 0JJ |
| The Close | TS15 0EB |
| The Grove | TS15 0HD |
| The Old Orchard | TS15 0BZ |
| The Wynd | TS15 0ES |
| Village | TS15 0JX |
| West End | TS15 0DJ |
| Westholme | TS15 0EA |
| Willins Close | TS15 0HJ |
| Willowgarth | TS15 0LE |
| Woodside | TS15 0JF |
| Wynd Close | TS15 0ET |
| TS15 0AE TS15 0AG TS15 0AR TS15 0BA TS15 0BB TS15 0EN TS15 0ER TS15 0EY TS15 0HB TS15 0JB TS15 0JE TS15 0JN TS15 0JP TS15 0JR TS15 0JU TS15 0JY |
Transport near Rudby
-
Yarm Station
-
Allen's West Station
-
Eaglescliffe Station
-
Nunthorpe Station
-
Gypsy Lane Station
-
Marton Station
-
Great Ayton Station
-
Teesside Airport Station
-
Thornaby Station
-
James Cook University Hospital Station
- FAQ
- Price Paid By Year
- Property Type Price
Frequently asked questions about Rudby
What is the average price for a property for sale in Rudby?
The average price for a property for sale in Rudby is £469,761. This amount is 4% lower than the average price in Yarm. There are 347 property listings for sale in Rudby.
What streets have the most expensive properties for sale in Rudby?
The streets with the most expensive properties for sale in Rudby are Belbrough Lane at an average of £843,000, Blue Barn Lane at an average of £778,833 and Levenside at an average of £643,440.
What streets have the most affordable properties for sale in Rudby?
The streets with the most affordable properties for sale in Rudby are The Wynd at an average of £228,000, Levendale at an average of £234,000 and Wynd Close at an average of £260,000.
Which train stations are available in or near Rudby?
Some of the train stations available in or near Rudby are Yarm, Allen's West and Eaglescliffe.
Property Price Paid in Rudby by Year
The average sold property price by year was:
| Year | Average Sold Price | Price Change |
Sold Properties
|
|---|---|---|---|
| 2025 | £461,756 | -5% |
20 Properties |
| 2024 | £486,951 | 6% |
31 Properties |
| 2023 | £456,907 | 18% |
29 Properties |
| 2022 | £373,967 | -0,1% |
34 Properties |
| 2021 | £374,477 | 18% |
58 Properties |
| 2020 | £308,627 | 0,2% |
31 Properties |
| 2019 | £308,007 | -5% |
35 Properties |
| 2018 | £323,623 | 16% |
45 Properties |
| 2017 | £273,177 | -25% |
38 Properties |
| 2016 | £342,020 | -4% |
25 Properties |
| 2015 | £355,220 | 19% |
30 Properties |
| 2014 | £286,591 | -4% |
30 Properties |
| 2013 | £298,965 | -9% |
29 Properties |
| 2012 | £327,185 | 12% |
32 Properties |
| 2011 | £286,319 | -6% |
28 Properties |
| 2010 | £303,500 | -12% |
29 Properties |
| 2009 | £338,633 | -13% |
28 Properties |
| 2008 | £383,547 | 14% |
29 Properties |
| 2007 | £331,756 | 1% |
31 Properties |
| 2006 | £329,295 | 13% |
32 Properties |
| 2005 | £287,127 | -10% |
51 Properties |
| 2004 | £316,828 | 28% |
23 Properties |
| 2003 | £229,507 | 11% |
46 Properties |
| 2002 | £203,134 | 18% |
42 Properties |
| 2001 | £167,495 | 23% |
34 Properties |
| 2000 | £129,359 | -15% |
37 Properties |
| 1999 | £149,354 | 27% |
31 Properties |
| 1998 | £109,757 | -9% |
38 Properties |
| 1997 | £119,594 | 1% |
34 Properties |
| 1996 | £118,655 | 3% |
45 Properties |
| 1995 | £114,784 | - |
42 Properties |
Property Price per Property Type in Rudby
Here you can find historic sold price data in order to help with your property search.
The average Property Paid Price for specific property types in the last three years are:
| Property Type | Average Sold Price | Sold Properties |
|---|---|---|
| Semi Detached House | £286,888.00 | 9 Semi Detached Houses |
| Detached House | £555,935.00 | 55 Detached Houses |
| Terraced House | £286,923.00 | 13 Terraced Houses |
| Flat | £230,833.00 | 3 Flats |

