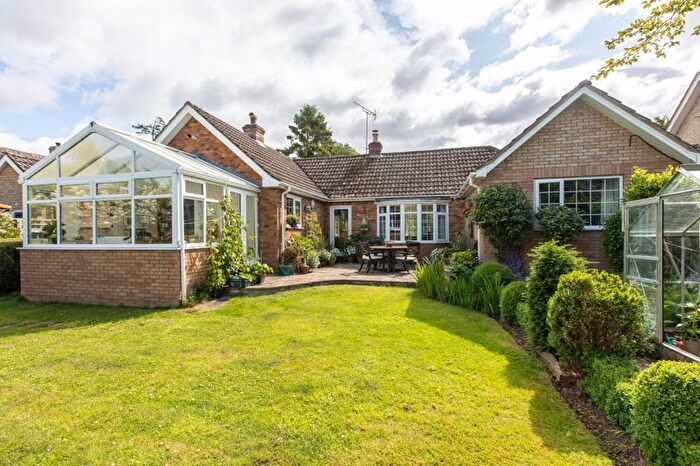
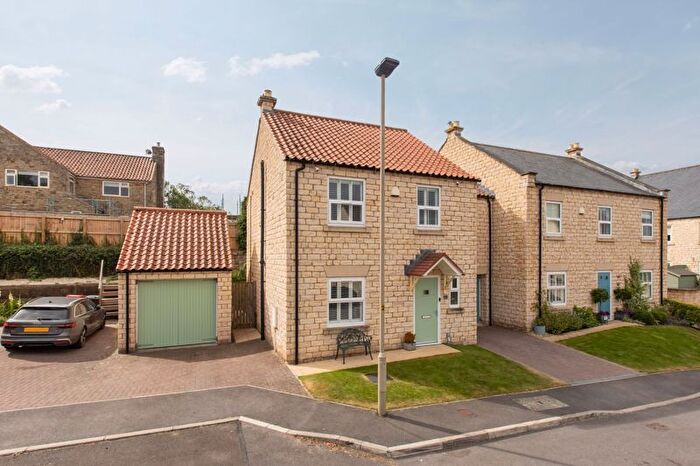
Houses for sale & to rent in Sinnington, York
House Prices in Sinnington
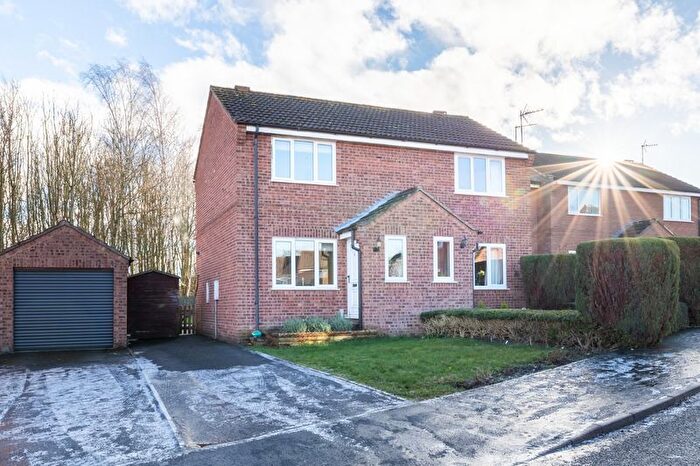
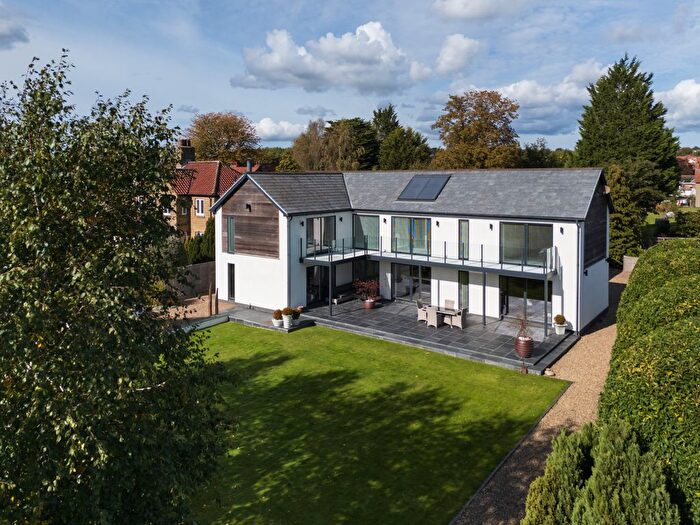
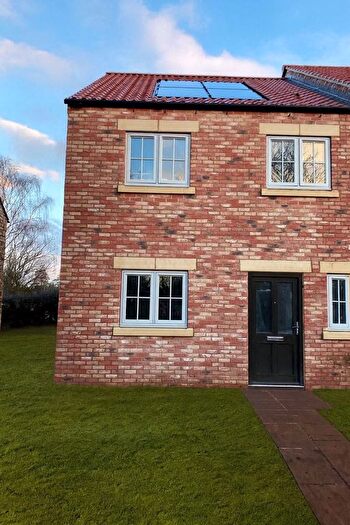
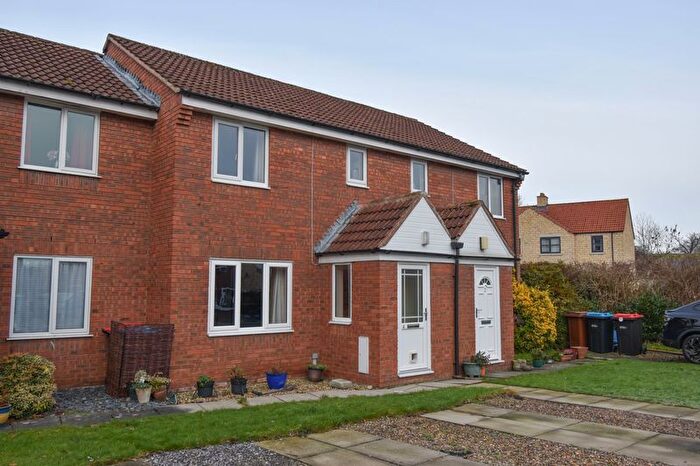
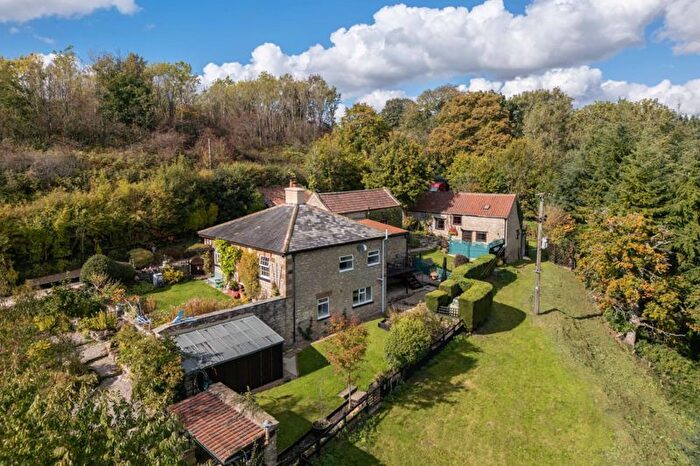
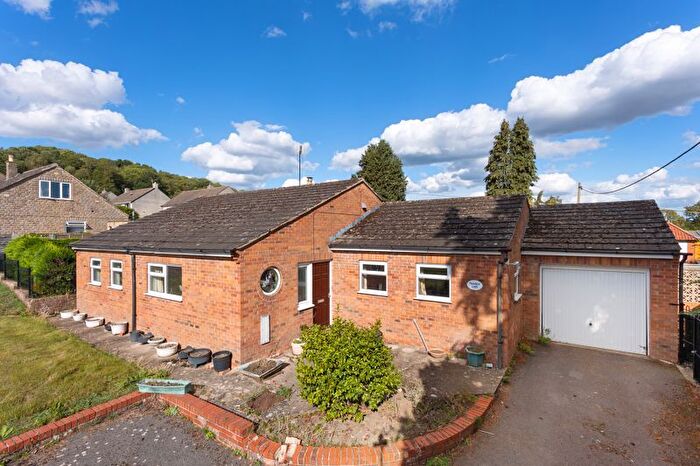
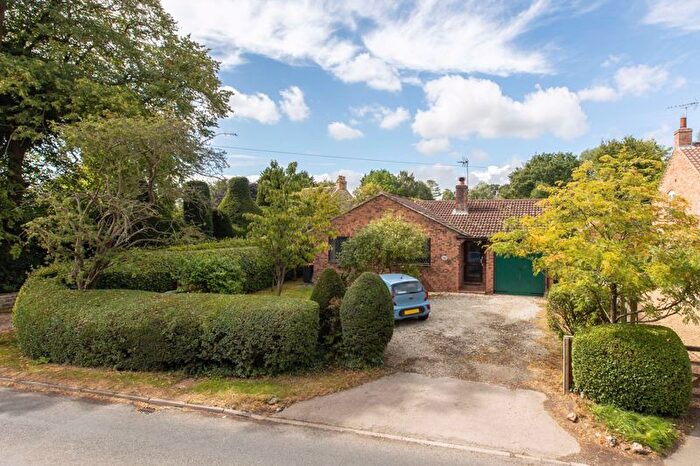
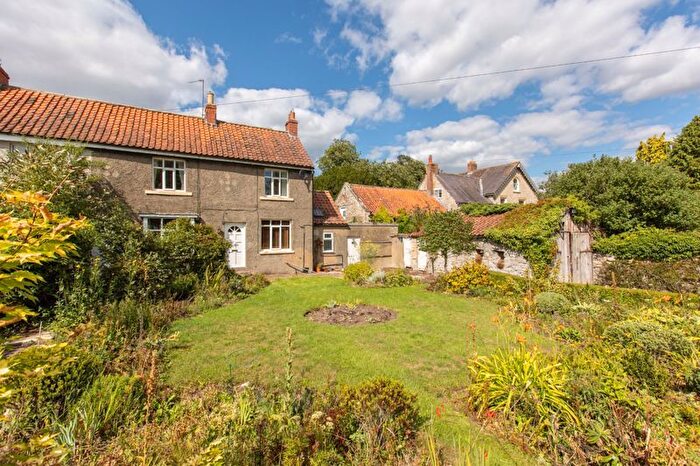
Properties in Sinnington have an average house price of £455,687.00 and had 46 Property Transactions within the last 3 years¹.
Sinnington is an area in York, North Yorkshire with 589 households², where the most expensive property was sold for £1,400,000.00.
Properties for sale in Sinnington
Previously listed properties in Sinnington
Roads and Postcodes in Sinnington
Navigate through our locations to find the location of your next house in Sinnington, York for sale or to rent.
| Streets | Postcodes |
|---|---|
| Bank Top | YO62 5YB YO62 5YL |
| Cartoft | YO62 6NX |
| Catterbridge | YO62 6NF |
| Chapel Lane | YO62 5JL |
| Chapel Street | YO62 5UP |
| Cherry Tree Courtyard | YO62 6RR |
| Church Lane | YO62 6SF |
| Church Street | YO62 5US |
| Croft Green | YO62 6SJ |
| East Ness | YO62 5XD |
| Friars Hill | YO62 6SL |
| Gale Lane | YO62 7SD |
| Graham Hall Cottages | YO62 5UY |
| High Street | YO62 5JE |
| Jubilee Cottages | YO62 5YE |
| Knavesmire Close | YO62 5JD |
| Leysthorpe Cottages | YO62 5YD |
| Little Edstone | YO62 6NY |
| Low Street | YO62 5UR YO62 5UX |
| Main Street | YO62 5JF YO62 6PB YO62 6RN YO62 6SH YO62 6SQ |
| Manor View | YO62 5YJ |
| Marton Road | YO62 6RB |
| Mill Street | YO62 5JG |
| Moor Lane | YO62 6SE |
| Muscoates Lane | YO62 5XF YO62 5XG YO62 5XQ |
| Ness | YO62 5XE |
| Ness Lane | YO62 5UZ |
| Owmen Field Lane | YO62 5JP |
| Pond Cottages | YO62 6PA |
| Railway Cottages | YO62 5JQ |
| Rectory Lane | YO62 5UU |
| Riverside | YO62 6RY YO62 6SD |
| Salton Road | YO62 6PE |
| South Holme | YO62 4BA YO62 4BB YO62 4BE |
| Spring Hill | YO62 4LL |
| St Oswalds Close | YO62 5YH |
| Station Cottages | YO62 6RA |
| Station Road | YO62 4JW YO62 5XB |
| Sycamore Terrace | YO62 5JB |
| The Bank | YO62 5YA |
| The Croft | YO62 5UT |
| The Garth | YO62 6SG |
| The Green | YO62 6RZ |
| The Terrace | YO62 5XZ |
| Victoria Gardens | YO62 6SA |
| Wapping Lane | YO62 6PD |
| West View | YO62 4BD |
| York Road | YO62 5XY |
| YO62 4LJ YO62 5HZ YO62 5JA YO62 5XT YO62 5XX YO62 5YF YO62 5YG YO62 6NZ YO62 6RP YO62 6SN YO62 4LH YO62 5JH YO62 5JJ YO62 5JN YO62 5YQ YO62 6PF YO62 6RL YO62 6RW YO62 6SS |
Transport near Sinnington
-
Malton Station
-
Glaisdale Station
-
Egton Station
-
Castleton Moor Station
-
Thirsk Station
-
Danby Station
-
Battersby Station
-
Lealholm Station
-
Grosmont Station
-
Commondale Station
- FAQ
- Price Paid By Year
- Property Type Price
Frequently asked questions about Sinnington
What is the average price for a property for sale in Sinnington?
The average price for a property for sale in Sinnington is £455,687. This amount is 8% higher than the average price in York. There are 208 property listings for sale in Sinnington.
What streets have the most expensive properties for sale in Sinnington?
The streets with the most expensive properties for sale in Sinnington are Station Road at an average of £1,400,000, Mill Street at an average of £1,150,000 and Croft Green at an average of £550,000.
What streets have the most affordable properties for sale in Sinnington?
The streets with the most affordable properties for sale in Sinnington are Sycamore Terrace at an average of £194,450, The Terrace at an average of £254,333 and Riverside at an average of £377,250.
Which train stations are available in or near Sinnington?
Some of the train stations available in or near Sinnington are Malton, Glaisdale and Egton.
Property Price Paid in Sinnington by Year
The average sold property price by year was:
| Year | Average Sold Price | Price Change |
Sold Properties
|
|---|---|---|---|
| 2025 | £406,563 | -13% |
19 Properties |
| 2024 | £458,460 | -16% |
15 Properties |
| 2023 | £530,003 | 17% |
12 Properties |
| 2022 | £437,384 | 5% |
25 Properties |
| 2021 | £414,038 | 7% |
32 Properties |
| 2020 | £386,083 | 0,2% |
15 Properties |
| 2019 | £385,153 | 19% |
13 Properties |
| 2018 | £313,876 | 8% |
14 Properties |
| 2017 | £290,051 | -10% |
22 Properties |
| 2016 | £318,469 | 9% |
22 Properties |
| 2015 | £290,010 | -3% |
25 Properties |
| 2014 | £297,456 | -4% |
16 Properties |
| 2013 | £309,229 | 1% |
24 Properties |
| 2012 | £306,088 | -1% |
17 Properties |
| 2011 | £309,678 | -43% |
14 Properties |
| 2010 | £443,633 | 43% |
15 Properties |
| 2009 | £252,048 | -28% |
19 Properties |
| 2008 | £323,142 | -20% |
7 Properties |
| 2007 | £388,947 | 18% |
22 Properties |
| 2006 | £318,212 | -9% |
18 Properties |
| 2005 | £346,239 | 31% |
23 Properties |
| 2004 | £238,697 | -8% |
20 Properties |
| 2003 | £258,310 | 25% |
29 Properties |
| 2002 | £193,938 | 40% |
21 Properties |
| 2001 | £115,503 | -18% |
17 Properties |
| 2000 | £135,862 | 16% |
20 Properties |
| 1999 | £113,530 | 16% |
23 Properties |
| 1998 | £95,666 | -8% |
18 Properties |
| 1997 | £103,382 | 18% |
26 Properties |
| 1996 | £84,793 | -8% |
22 Properties |
| 1995 | £91,602 | - |
17 Properties |
Property Price per Property Type in Sinnington
Here you can find historic sold price data in order to help with your property search.
The average Property Paid Price for specific property types in the last three years are:
| Property Type | Average Sold Price | Sold Properties |
|---|---|---|
| Semi Detached House | £413,745.00 | 12 Semi Detached Houses |
| Detached House | £573,954.00 | 22 Detached Houses |
| Terraced House | £280,807.00 | 12 Terraced Houses |

