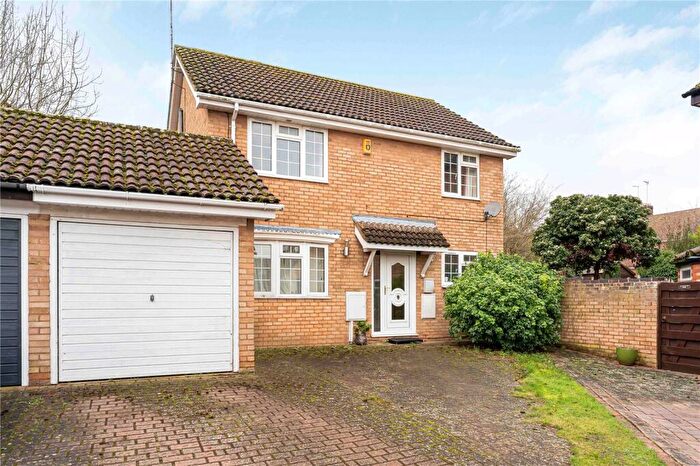
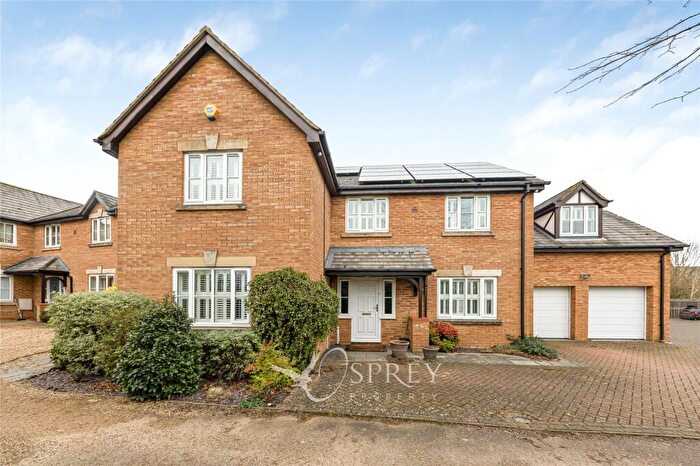
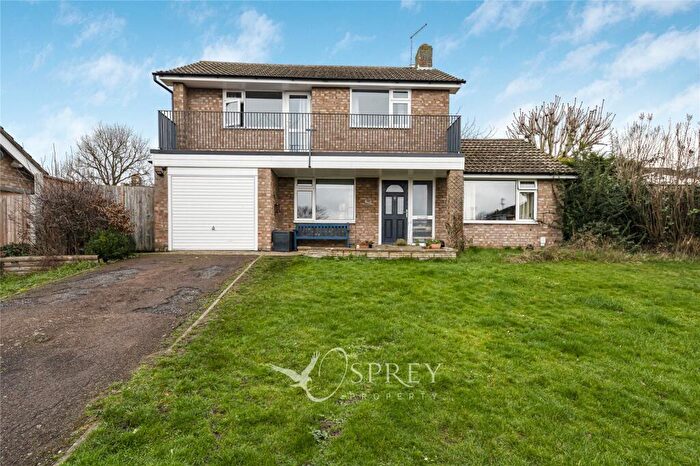
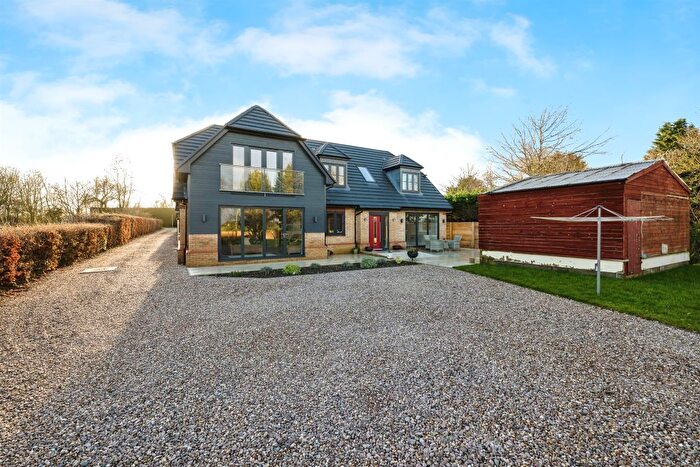
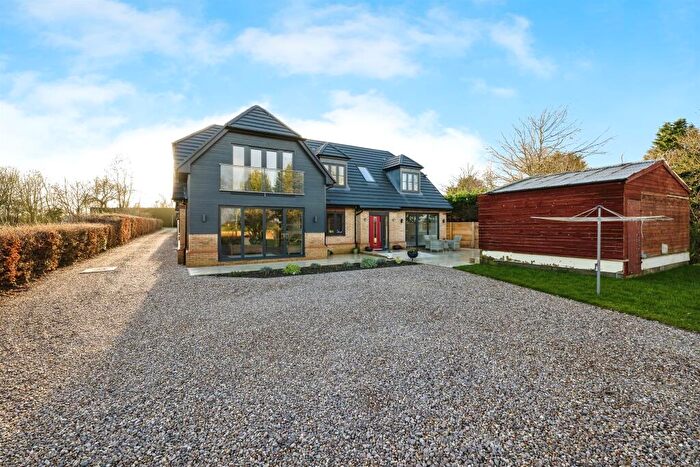
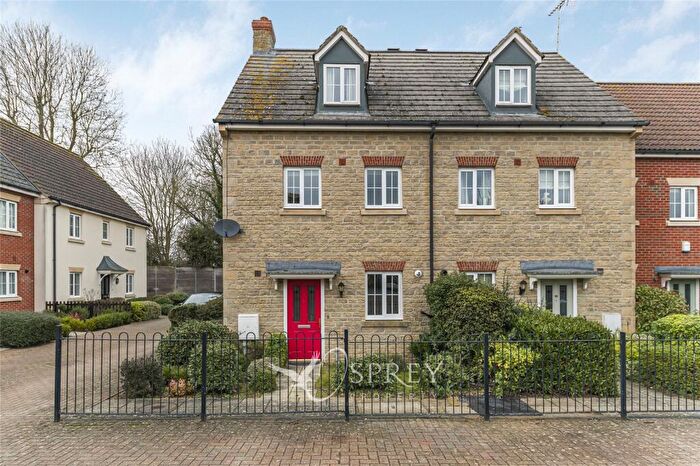
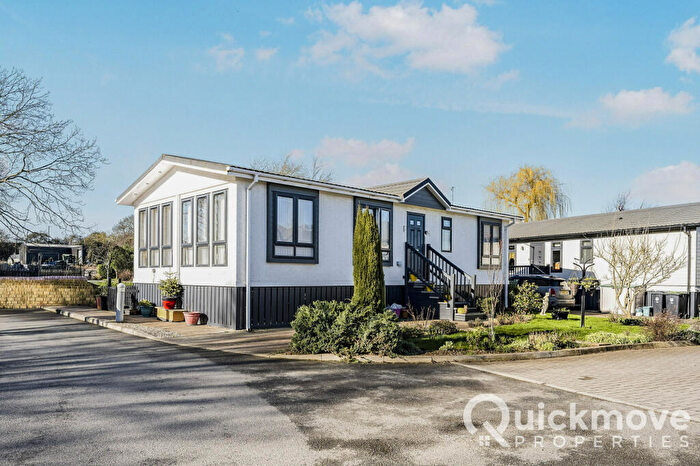
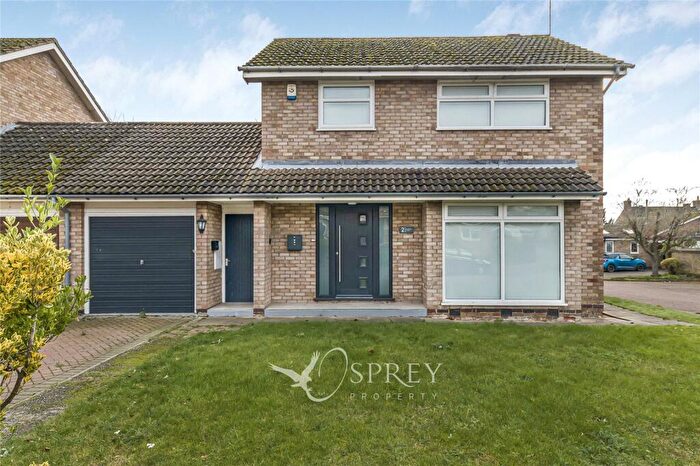
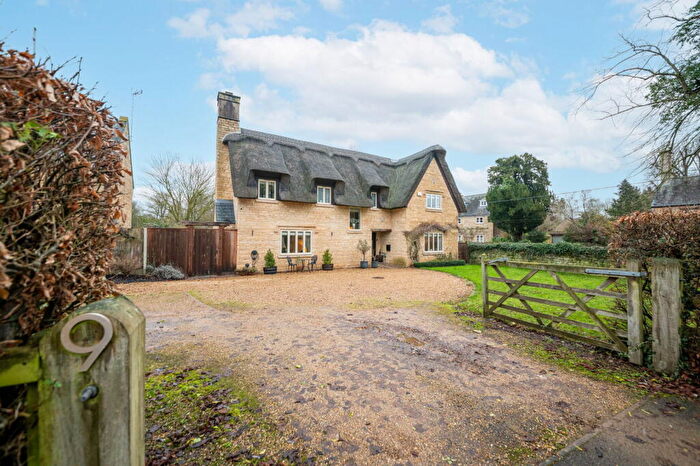
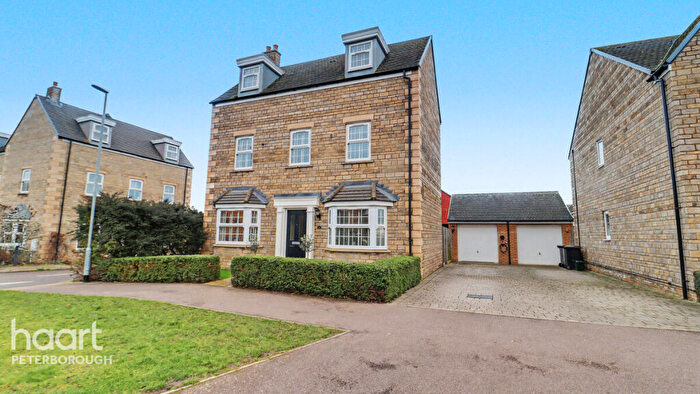
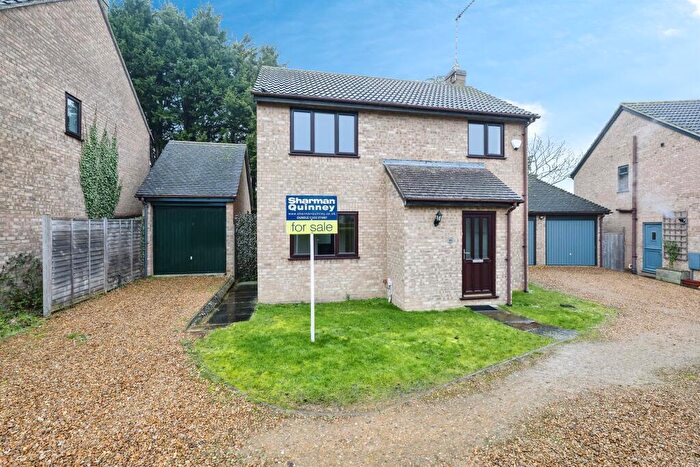
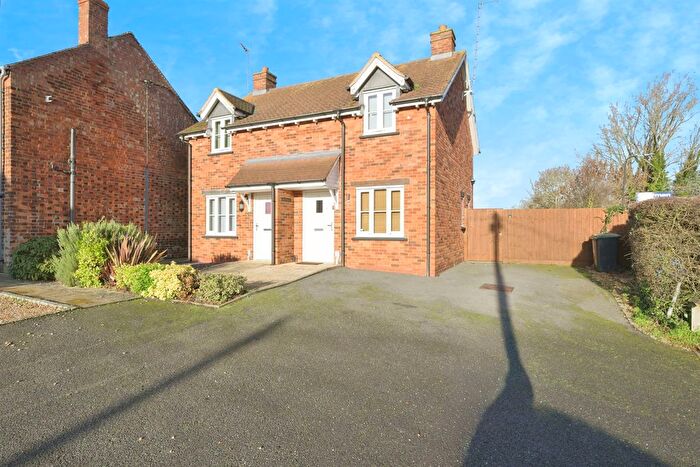
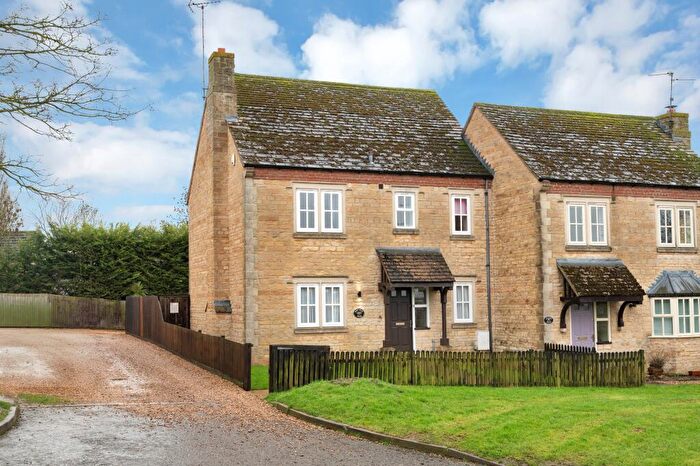
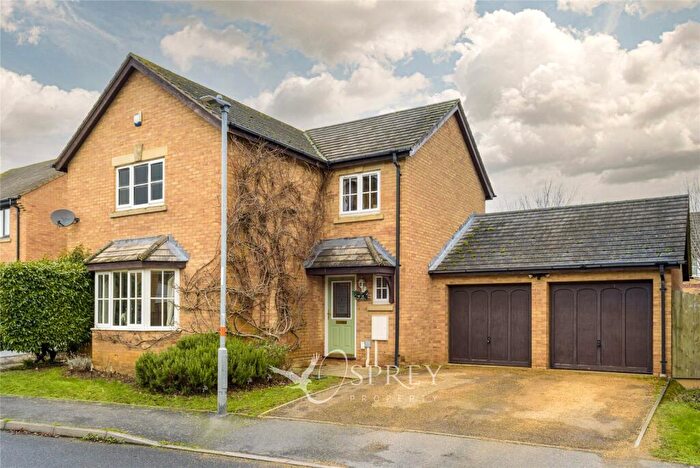
Houses for sale & to rent in Lower Nene, Peterborough
House Prices in Lower Nene
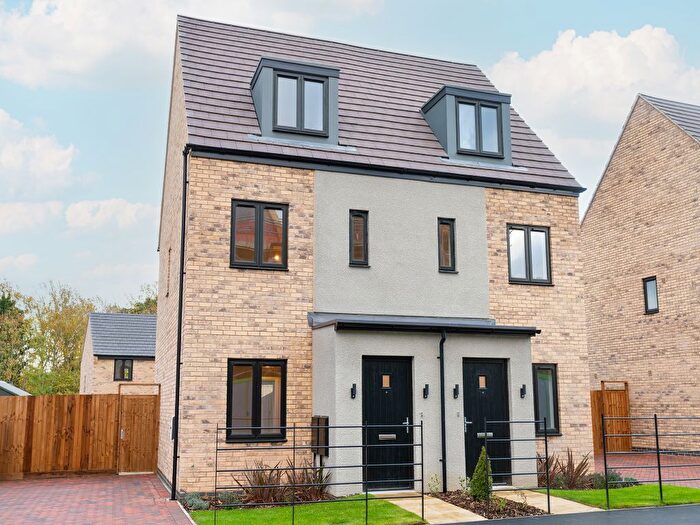
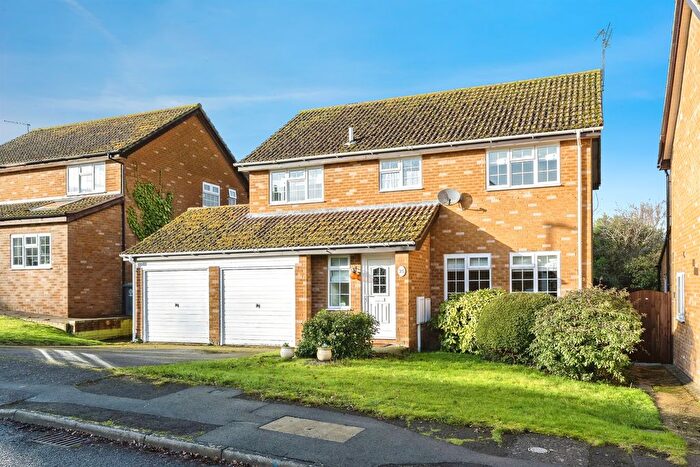
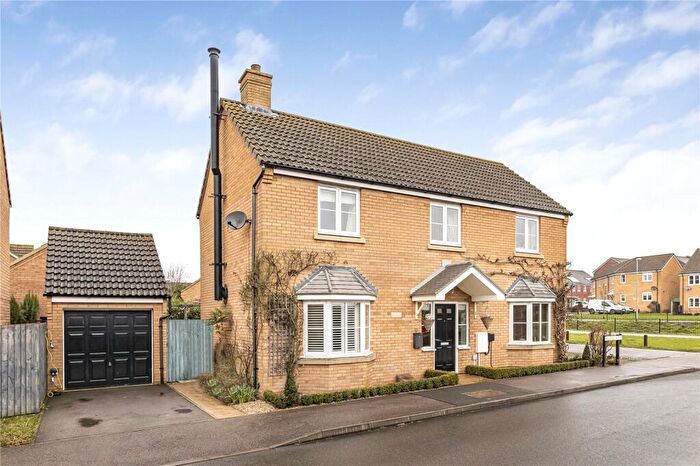
Properties in Lower Nene have an average house price of £625,167.00 and had 91 Property Transactions within the last 3 years¹.
Lower Nene is an area in Peterborough, Northamptonshire with 844 households², where the most expensive property was sold for £9,000,000.00.
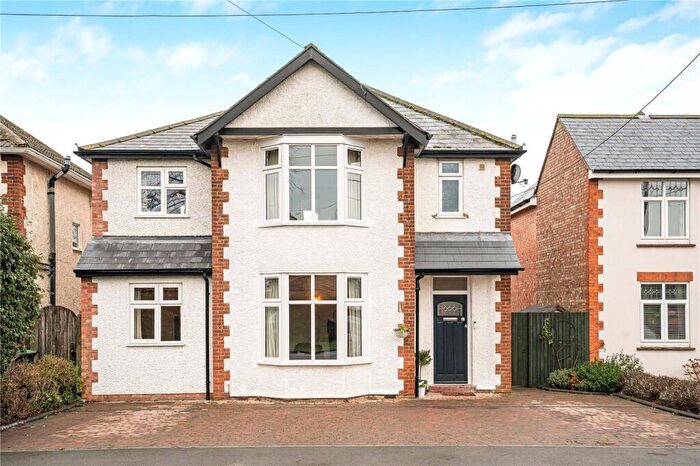
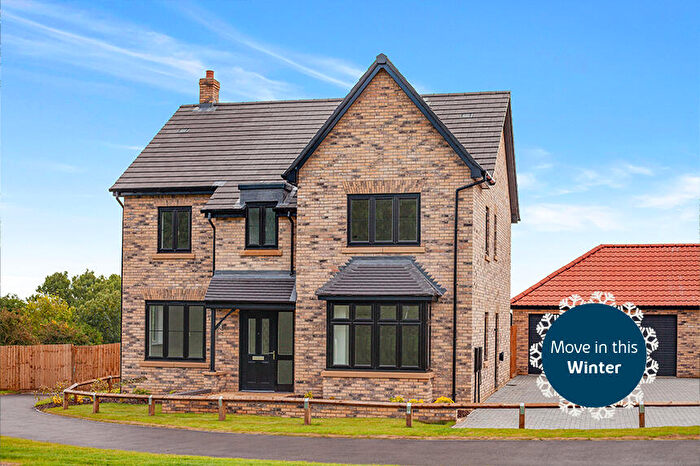
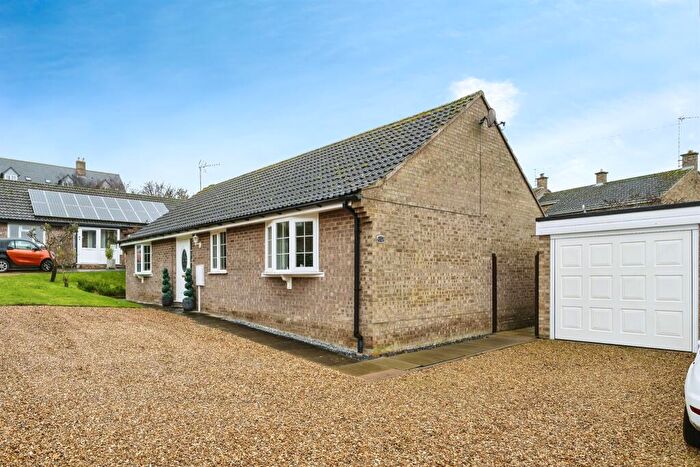
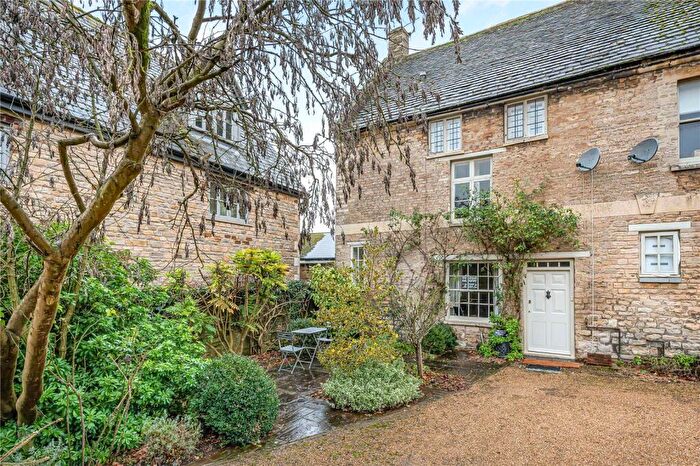
Properties for sale in Lower Nene
Roads and Postcodes in Lower Nene
Navigate through our locations to find the location of your next house in Lower Nene, Peterborough for sale or to rent.
| Streets | Postcodes |
|---|---|
| Acremead | PE8 6TP |
| Ashton Wold | PE8 5LZ |
| Bevan Close | PE8 6WJ |
| Big Green | PE8 6TU |
| Bosworth Close | PE8 6WF |
| Broadgate Way | PE8 6UH PE8 6UN PE8 6UW |
| Buntings Lane | PE8 6TT |
| Chapel Street | PE8 6TH PE8 6TR |
| Church Lane | PE8 6TB |
| Church Row | PE8 5LT |
| Church Street | PE8 5LR PE8 6TE |
| Circus Grove | PE8 5LE |
| Dexter Way | PE8 6WH |
| Drapers Close | PE8 6UQ |
| Duke Street | PE8 5LP |
| Eaglethorpe | PE8 6TJ |
| Fergusons Close | PE8 5LH |
| Fotheringhay Road | PE8 5HP PE8 6TY |
| Garden Row | PE8 5JU |
| Glatton Road | PE8 5NH |
| Hall Gardens | PE8 5LJ |
| Hautboy Lane | PE8 6TQ |
| Hemington Road | PE8 5LS |
| Kings Arms Lane | PE8 5LW |
| Laxton Drive | PE8 5TW |
| Little Green | PE8 6TS |
| Long Lane | PE8 6TD |
| Lutton Road | PE8 5LX PE8 5LY |
| Main Street | PE8 5HD PE8 5HS PE8 5LN |
| Mill Cottage | PE8 5LB |
| Mill Lane | PE8 5HH |
| Milton Terrace | PE8 5NF |
| Morgans Close | PE8 5LU |
| Oakwood Close | PE8 5HG |
| Orchard Close | PE8 6TX |
| Oundle Road | PE8 5LQ |
| Papley | PE8 6UU |
| Peterborough Road | PE8 6TL PE8 6TN |
| Pierce Crescent | PE8 6UG |
| Red Lodge Road | PE8 5LL |
| School Lane | PE8 6TA |
| Short Close | PE8 6WG |
| Spinney Close | PE8 6TF |
| St Marys Lane | PE8 6UA |
| Stamford Lane | PE8 6TW |
| Station Road | PE8 5LA |
| Taylors Green | PE8 6TG |
| The Green | PE8 5LD |
| Winchester Close | PE8 6UB |
| PE8 5HB PE8 5HN PE8 5HT PE8 5JY PE8 5JZ PE8 5ND PE8 5NE PE8 5PR PE8 6UP PE8 6UX PE8 6UY PE8 5HF PE8 5LF PE8 5QE PE8 6TZ PE8 6UT |
Transport near Lower Nene
-
Peterborough Station
-
Stamford Station
-
Corby Station
-
Whittlesea Station
-
Kettering Station
-
Huntingdon Station
- FAQ
- Price Paid By Year
- Property Type Price
Frequently asked questions about Lower Nene
What is the average price for a property for sale in Lower Nene?
The average price for a property for sale in Lower Nene is £625,167. This amount is 32% higher than the average price in Peterborough. There are 1,279 property listings for sale in Lower Nene.
What streets have the most expensive properties for sale in Lower Nene?
The streets with the most expensive properties for sale in Lower Nene are Lutton Road at an average of £3,269,000, Eaglethorpe at an average of £1,400,000 and Circus Grove at an average of £1,280,000.
What streets have the most affordable properties for sale in Lower Nene?
The streets with the most affordable properties for sale in Lower Nene are Church Street at an average of £269,500, Church Row at an average of £279,250 and Stamford Lane at an average of £280,000.
Which train stations are available in or near Lower Nene?
Some of the train stations available in or near Lower Nene are Peterborough, Stamford and Corby.
Property Price Paid in Lower Nene by Year
The average sold property price by year was:
| Year | Average Sold Price | Price Change |
Sold Properties
|
|---|---|---|---|
| 2025 | £745,500 | 22% |
34 Properties |
| 2024 | £584,156 | 11% |
30 Properties |
| 2023 | £519,203 | 5% |
27 Properties |
| 2022 | £492,920 | -4% |
25 Properties |
| 2021 | £512,351 | 19% |
40 Properties |
| 2020 | £414,652 | 11% |
36 Properties |
| 2019 | £368,388 | 1% |
27 Properties |
| 2018 | £365,500 | -8% |
29 Properties |
| 2017 | £394,430 | 15% |
36 Properties |
| 2016 | £333,338 | 11% |
38 Properties |
| 2015 | £297,218 | -29% |
41 Properties |
| 2014 | £382,022 | 11% |
56 Properties |
| 2013 | £341,503 | -18% |
33 Properties |
| 2012 | £402,250 | 18% |
20 Properties |
| 2011 | £328,393 | -10% |
24 Properties |
| 2010 | £360,825 | 12% |
20 Properties |
| 2009 | £316,833 | -6% |
18 Properties |
| 2008 | £336,770 | -11% |
20 Properties |
| 2007 | £374,403 | 26% |
27 Properties |
| 2006 | £275,910 | 1% |
31 Properties |
| 2005 | £273,122 | -7% |
36 Properties |
| 2004 | £291,396 | 7% |
42 Properties |
| 2003 | £271,211 | 23% |
59 Properties |
| 2002 | £209,333 | 10% |
40 Properties |
| 2001 | £188,218 | 19% |
50 Properties |
| 2000 | £151,523 | -15% |
77 Properties |
| 1999 | £173,846 | 17% |
70 Properties |
| 1998 | £143,823 | -1% |
38 Properties |
| 1997 | £145,272 | 27% |
31 Properties |
| 1996 | £106,410 | 17% |
28 Properties |
| 1995 | £88,785 | - |
32 Properties |
Property Price per Property Type in Lower Nene
Here you can find historic sold price data in order to help with your property search.
The average Property Paid Price for specific property types in the last three years are:
| Property Type | Average Sold Price | Sold Properties |
|---|---|---|
| Semi Detached House | £334,965.00 | 16 Semi Detached Houses |
| Detached House | £761,881.00 | 61 Detached Houses |
| Terraced House | £361,142.00 | 14 Terraced Houses |

