
Houses for sale in Northamptonshire, England
House Prices in Northamptonshire
Properties in Northamptonshire have
an average house price of
£291k
and had 29,786 Property Transactions
within the last 3 years.¹
Northamptonshire is a location in
England with
287,755 households², where the most expensive property was sold for £19.5M.
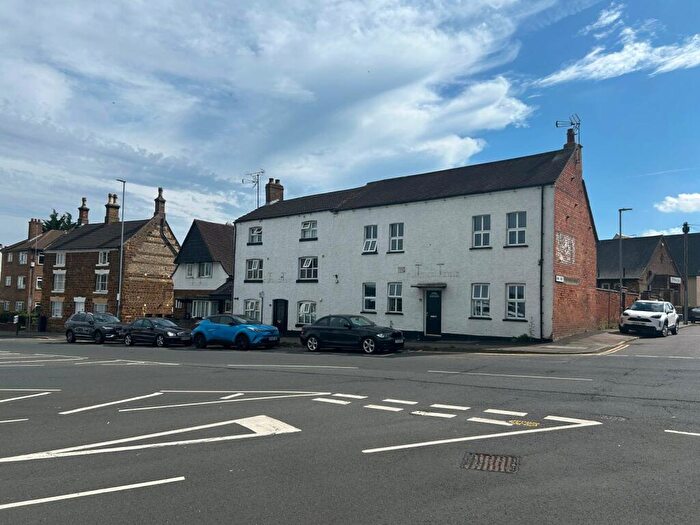
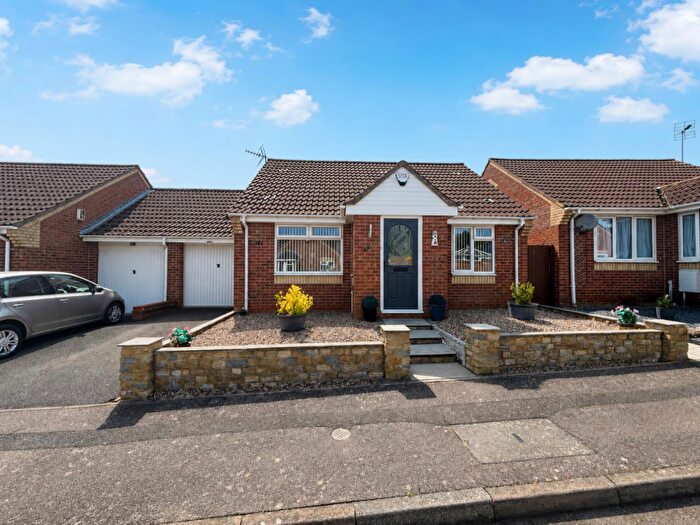
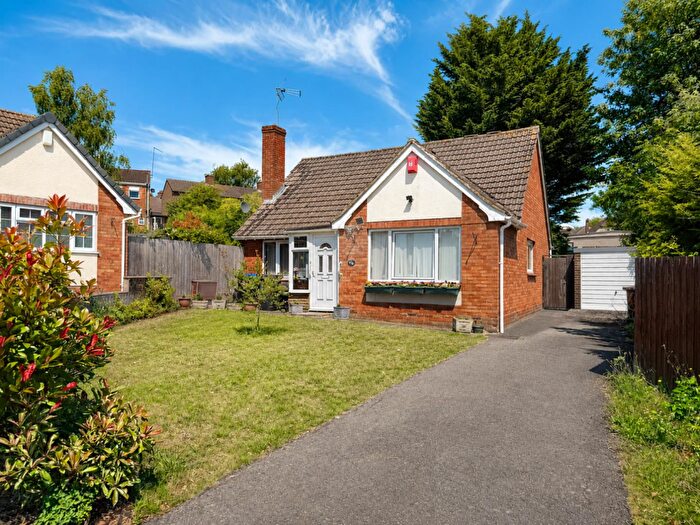
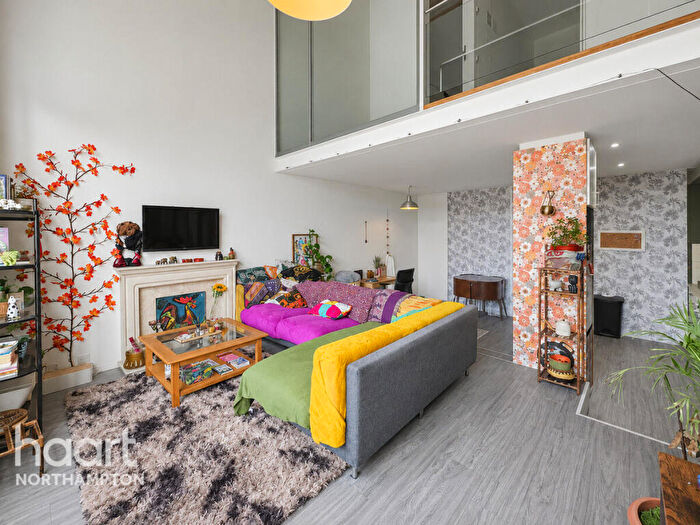
Properties for sale in Northamptonshire
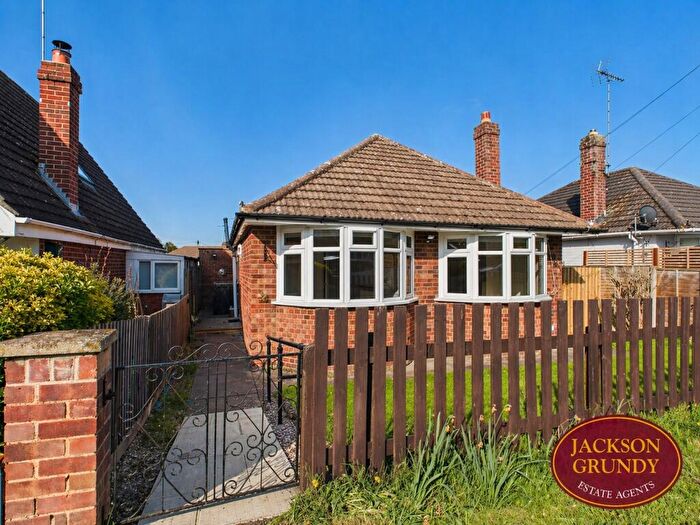
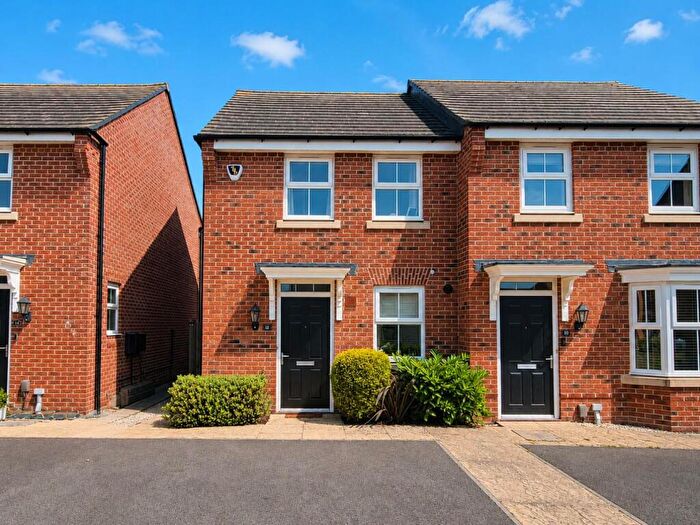
![]()
If you are looking to sell your house, let it out, or receive a property valuation, an expert can help you.
Click the button below to get started.

Towns in Northamptonshire
Navigate through our locations to find the location of your next house in Northamptonshire, England for sale or to rent.
Property price trends in Northamptonshire
According to the latest Land Registry data, the average home in Northamptonshire sold for £304,939 in 2026. That figure comes from a substantial record of 398,811 sales logged over the past 31 years.
Prices have continued to climb over the last three years. Compared with 2023, when the typical sale came in around £286,263, that's a rise of roughly 6.5%.
Looking back five years, average prices are up about 10.8% since 2021, a gain of around £29,771 in cash terms.
Zoom out to the past decade for the fuller picture. Back in 2016, homes here averaged £215,256, so the typical sold price has climbed about 41.7% since then, roughly 3.5% a year. Stretch the view to fifteen years and that annual pace edges up closer to 3.9%.
Frequently asked questions about Northamptonshire
What is the average price for a property for sale in Northamptonshire?
The average price for a property for sale in Northamptonshire is £291,047. This amount is 19% lower than the average price in England. There are more than 10,000 property listings for sale in Northamptonshire.
What locations have the most expensive properties for sale in Northamptonshire?
The locations with the most expensive properties for sale in Northamptonshire are Daventry at an average of £536,641, Peterborough at an average of £471,078 and Market Harborough at an average of £464,327.
What locations have the most affordable properties for sale in Northamptonshire?
The locations with the most affordable properties for sale in Northamptonshire are Corby at an average of £238,351, Rushden at an average of £257,873 and Wellingborough at an average of £260,163.
Which train stations are available in or near Northamptonshire?
Some of the train stations available in or near Northamptonshire are Wellingborough, Northampton and Kettering.
Property Price Paid in Northamptonshire by Year
The average sold property price by year was:
| Year | Average Sold Price | Price Change |
Sold Properties
|
|---|---|---|---|
| 2026 | £304,939 | 4% |
1,261 Properties |
| 2025 | £293,085 | 1% |
9,913 Properties |
| 2024 | £291,538 | 2% |
9,728 Properties |
| 2023 | £286,263 | -2% |
8,884 Properties |
| 2022 | £293,229 | 6% |
11,486 Properties |
| 2021 | £275,168 | 6% |
14,155 Properties |
| 2020 | £258,200 | 4% |
10,283 Properties |
| 2019 | £249,087 | 1% |
12,289 Properties |
| 2018 | £246,845 | 4% |
13,367 Properties |
| 2017 | £237,510 | 9% |
13,921 Properties |
Property Price per Property Type in Northamptonshire
Here you can find historic sold price data in order to help with your property search.
The average Property Paid Price for specific property types in the last three years are:
| Property Type | Average Sold Price | Sold Properties |
|---|---|---|
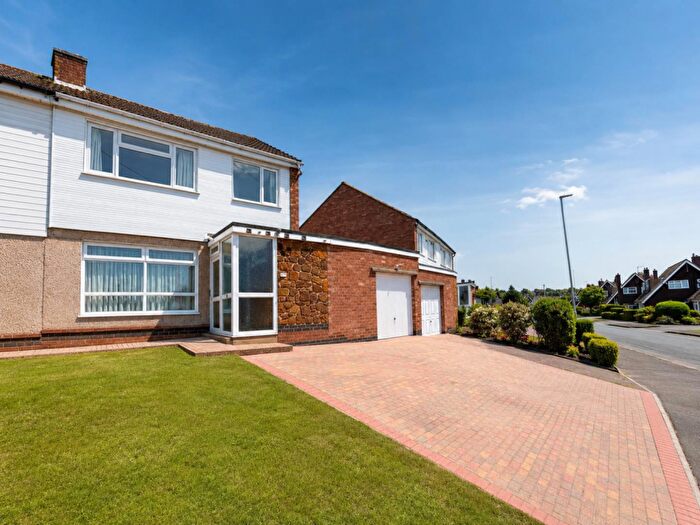
| Semi Detached House | £269,249.00 | 9,503 Semi Detached Houses |
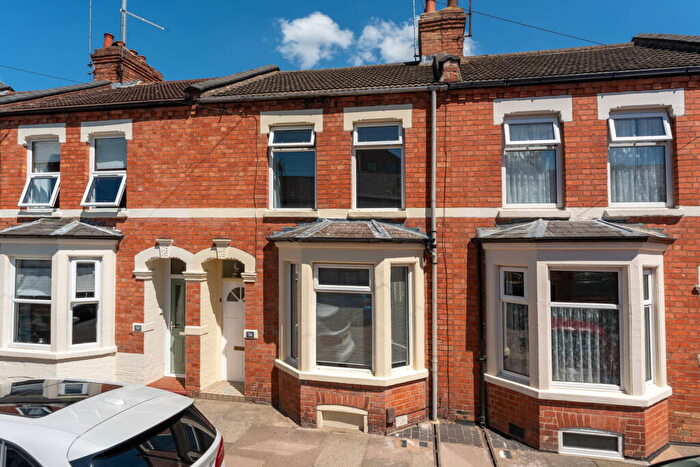
| Terraced House | £224,240.00 | 9,120 Terraced Houses |
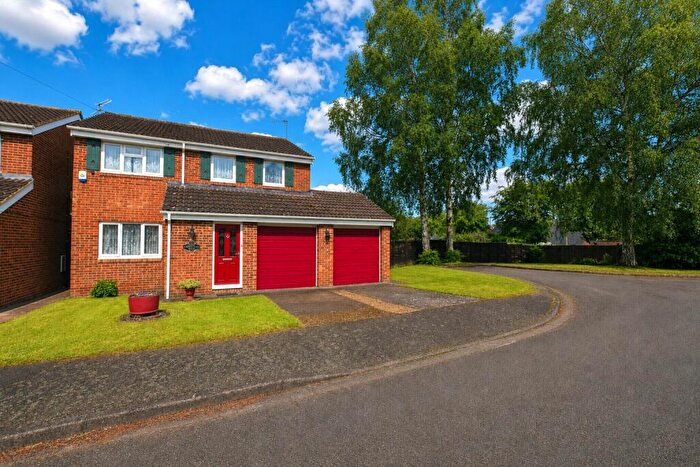
| Detached House | £433,606.00 | 8,434 Detached Houses |
| Flat | £149,635.00 | 2,729 Flats |
Transport in Northamptonshire
Please see below transportation links in this area:
