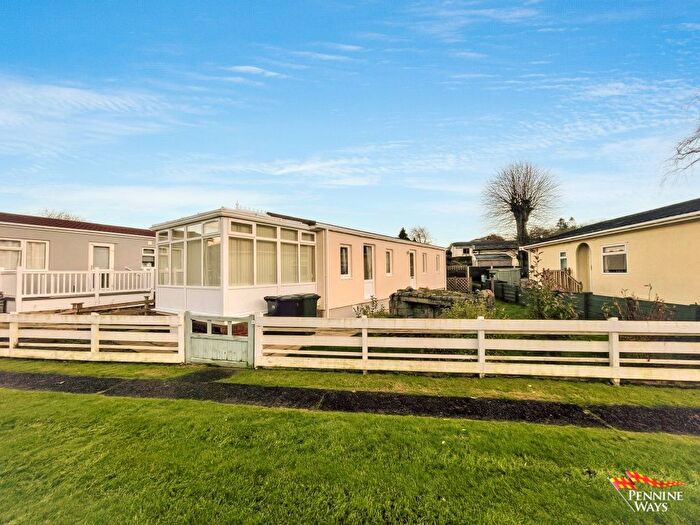
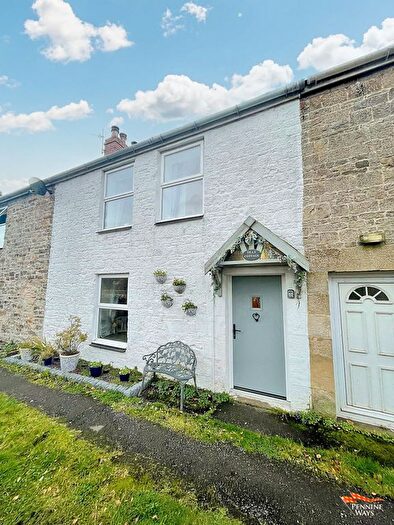
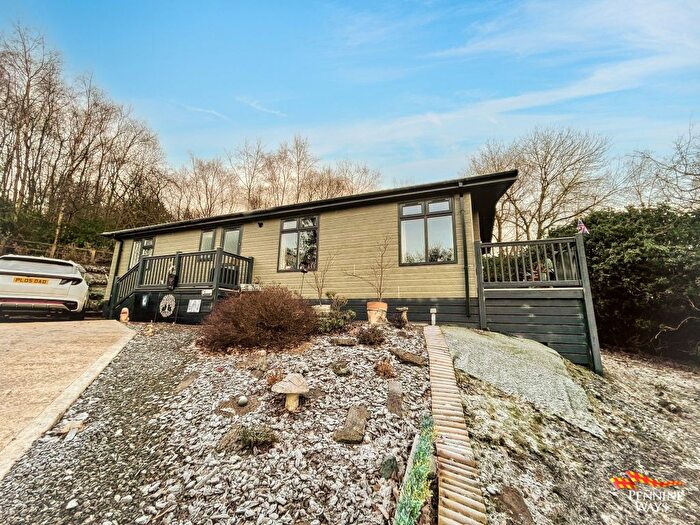
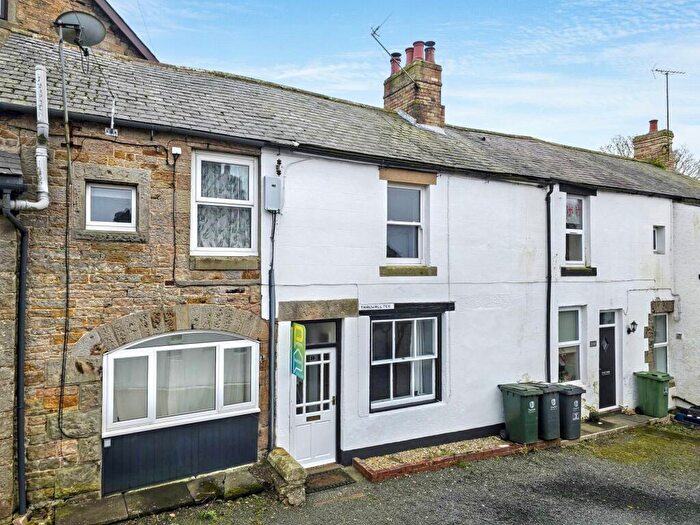
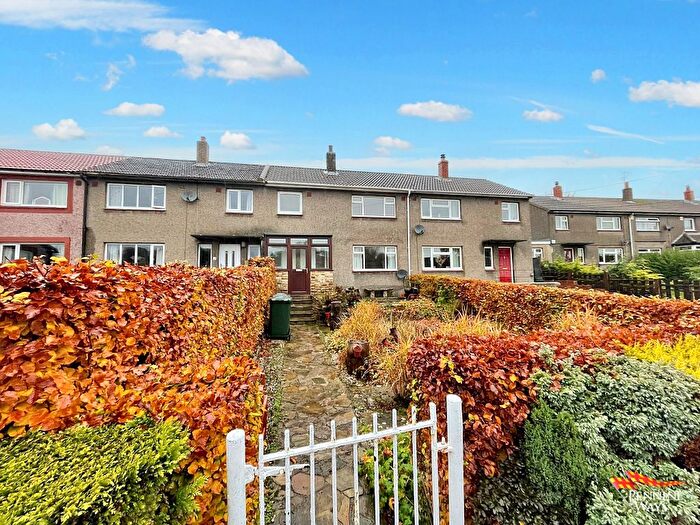
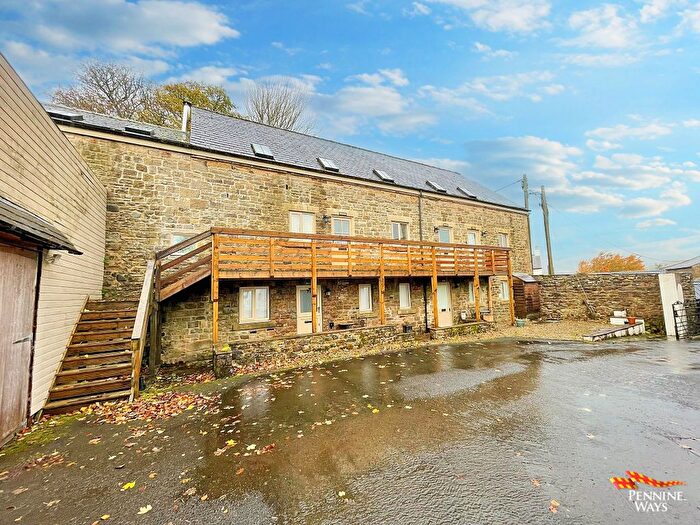
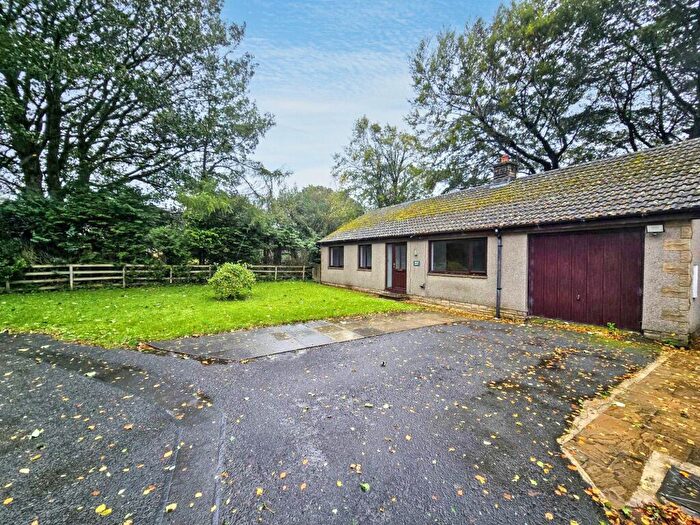
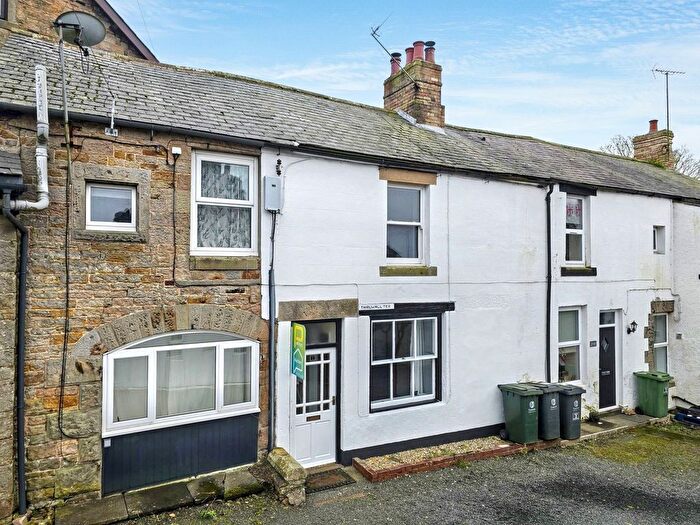
Houses for sale & to rent in Haydon And Hadrian, Brampton
House Prices in Haydon And Hadrian
Properties in Haydon And Hadrian have an average house price of £193,258.00 and had 29 Property Transactions within the last 3 years¹.
Haydon And Hadrian is an area in Brampton, Northumberland with 373 households², where the most expensive property was sold for £425,000.00.
Properties for sale in Haydon And Hadrian
Previously listed properties in Haydon And Hadrian
Roads and Postcodes in Haydon And Hadrian
Navigate through our locations to find the location of your next house in Haydon And Hadrian, Brampton for sale or to rent.
| Streets | Postcodes |
|---|---|
| Alpha Rise | CA8 7EE |
| Balmoral Cottage | CA8 7HR |
| Blenkinsopp Terrace | CA8 7JN |
| Byron Terrace | CA8 7JG |
| Carlton Trice | CA8 7BU |
| Coulson Court | CA8 7HP |
| Crossgates | CA8 7EJ |
| East View | CA8 7JL |
| Fountain Terrace | CA8 7HD |
| Gilsland | CA8 7BE CA8 7BG CA8 7BN CA8 7DR CA8 7DS CA8 7DW CA8 7DX CA8 7EA CA8 7EB CA8 7EH CA8 7EL CA8 7EP CA8 7EN CA8 7EW |
| High Castle Terrace | CA8 7HU |
| Holyrood Place | CA8 7HT |
| Irthing Park | CA8 7DL |
| Low Castle Terrace | CA8 7HS |
| Milburn Terrace | CA8 7HJ |
| Old Row | CA8 7JJ |
| Railway Terrace | CA8 7BL CA8 7DN |
| Riversdale | CA8 7BJ |
| Rosehill | CA8 7DP |
| Sefton Court | CA8 7DH |
| Stanley Crescent | CA8 7BH |
| Station Road | CA8 7HG |
| The Forge | CA8 7TF |
| Thirlwall Terrace | CA8 7BD |
| Thirlwall View | CA8 7HL |
| Thirlwall Villas | CA8 7BQ |
| CA8 7HA CA8 7HB CA8 7HE CA8 7HF CA8 7HN CA8 7HX CA8 7HY CA8 7JB CA8 7JD CA8 7JQ CA8 7JT CA8 2JF CA8 7HH CA8 7JA CA8 7JF CA8 7JH CA8 7JR CA8 7JS |
Transport near Haydon And Hadrian
- FAQ
- Price Paid By Year
- Property Type Price
Frequently asked questions about Haydon And Hadrian
What is the average price for a property for sale in Haydon And Hadrian?
The average price for a property for sale in Haydon And Hadrian is £193,258. This amount is 12% lower than the average price in Brampton. There are 106 property listings for sale in Haydon And Hadrian.
What streets have the most expensive properties for sale in Haydon And Hadrian?
The streets with the most expensive properties for sale in Haydon And Hadrian are Thirlwall Villas at an average of £220,000, Gilsland at an average of £172,928 and Carlton Trice at an average of £165,000.
What streets have the most affordable properties for sale in Haydon And Hadrian?
The streets with the most affordable properties for sale in Haydon And Hadrian are Old Row at an average of £97,000, Low Castle Terrace at an average of £110,250 and Stanley Crescent at an average of £130,000.
Which train stations are available in or near Haydon And Hadrian?
Some of the train stations available in or near Haydon And Hadrian are Haltwhistle, Brampton (Cumbria) and Bardon Mill.
Property Price Paid in Haydon And Hadrian by Year
The average sold property price by year was:
| Year | Average Sold Price | Price Change |
Sold Properties
|
|---|---|---|---|
| 2025 | £186,428 | 3% |
7 Properties |
| 2024 | £180,611 | -14% |
9 Properties |
| 2023 | £205,692 | 15% |
13 Properties |
| 2022 | £175,857 | -6% |
7 Properties |
| 2021 | £186,671 | 18% |
22 Properties |
| 2020 | £152,500 | 15% |
11 Properties |
| 2019 | £130,353 | -19% |
13 Properties |
| 2018 | £155,156 | -10% |
16 Properties |
| 2017 | £171,354 | 30% |
21 Properties |
| 2016 | £120,714 | -36% |
7 Properties |
| 2015 | £163,641 | 0,2% |
12 Properties |
| 2014 | £163,327 | 28% |
9 Properties |
| 2013 | £117,491 | -1% |
6 Properties |
| 2012 | £119,000 | -23% |
3 Properties |
| 2011 | £146,100 | -0,1% |
5 Properties |
| 2010 | £146,250 | -21% |
2 Properties |
| 2009 | £176,944 | 1% |
9 Properties |
| 2008 | £175,437 | -30% |
8 Properties |
| 2007 | £227,645 | 30% |
10 Properties |
| 2006 | £159,421 | 5% |
19 Properties |
| 2005 | £151,583 | -10% |
6 Properties |
| 2004 | £167,004 | 40% |
12 Properties |
| 2003 | £100,969 | 18% |
21 Properties |
| 2002 | £82,622 | 5% |
21 Properties |
| 2001 | £78,268 | 8% |
11 Properties |
| 2000 | £72,125 | 10% |
16 Properties |
| 1999 | £64,843 | 28% |
16 Properties |
| 1998 | £46,663 | -9% |
15 Properties |
| 1997 | £50,636 | -25% |
11 Properties |
| 1996 | £63,263 | 30% |
11 Properties |
| 1995 | £44,386 | - |
11 Properties |
Property Price per Property Type in Haydon And Hadrian
Here you can find historic sold price data in order to help with your property search.
The average Property Paid Price for specific property types in the last three years are:
| Property Type | Average Sold Price | Sold Properties |
|---|---|---|
| Semi Detached House | £192,000.00 | 5 Semi Detached Houses |
| Detached House | £274,636.00 | 11 Detached Houses |
| Terraced House | £133,772.00 | 11 Terraced Houses |
| Flat | £76,000.00 | 2 Flats |


