
Houses for sale in Northumberland, England
House Prices in Northumberland
Properties in Northumberland have
an average house price of
£236k
and had 15,636 Property Transactions
within the last 3 years.¹
Northumberland is a location in
England with
147,318 households², where the most expensive property was sold for £6M.
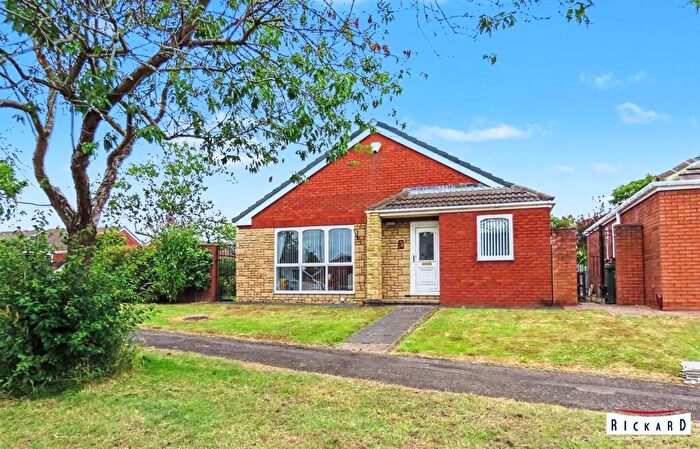
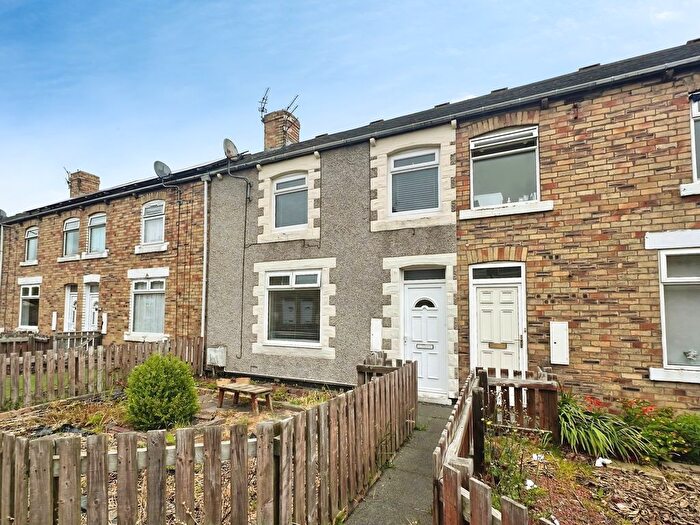
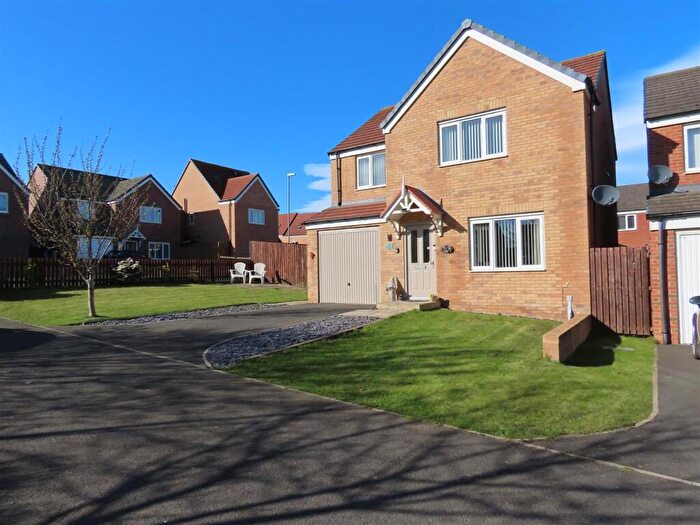
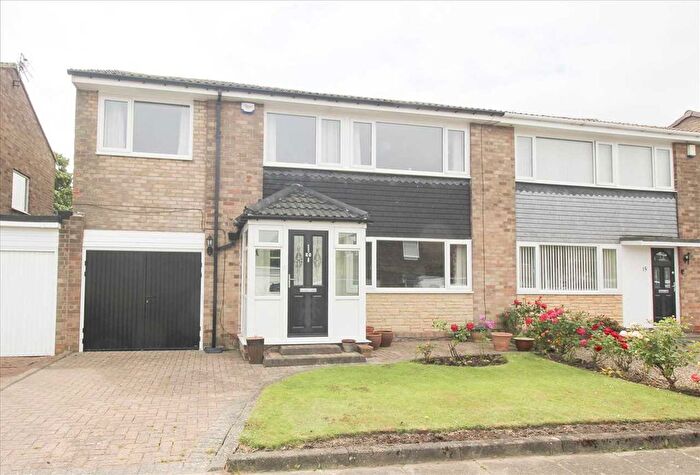
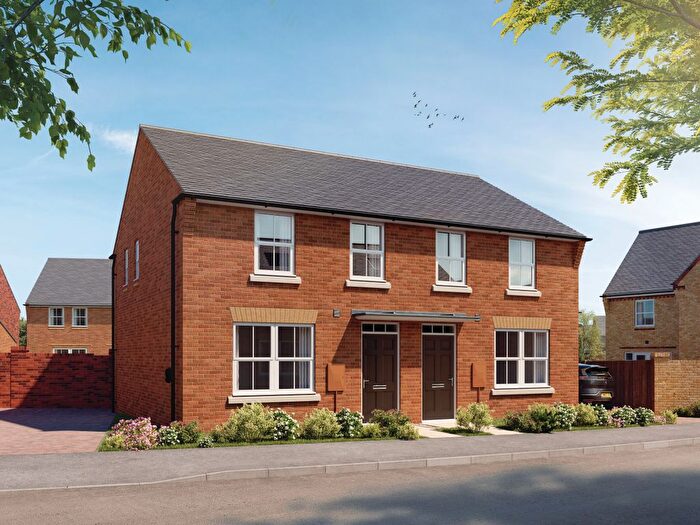
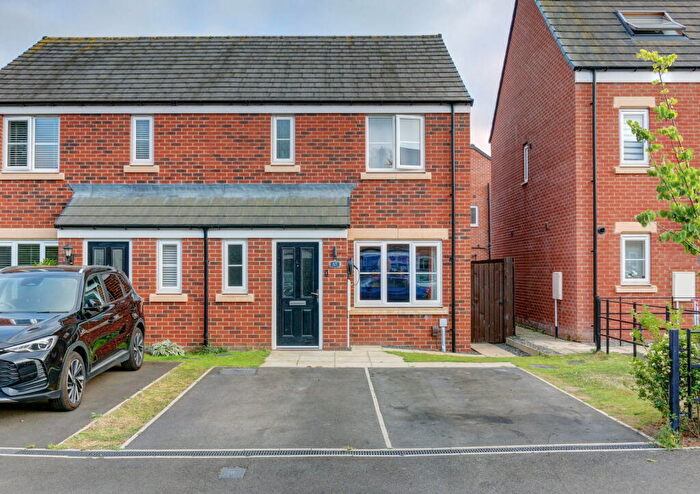
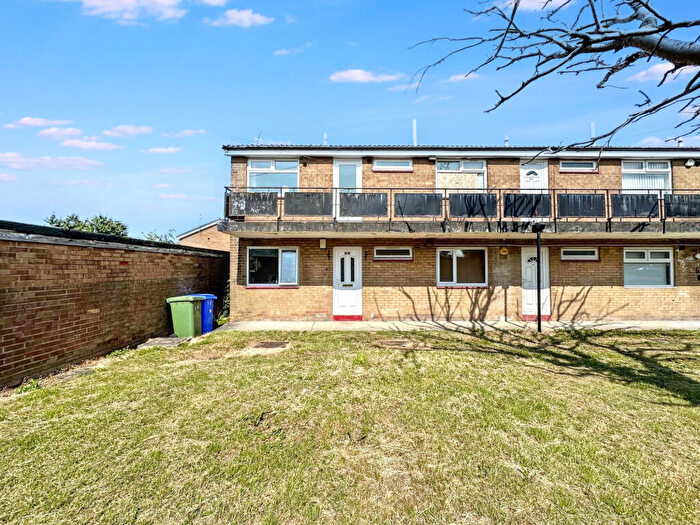
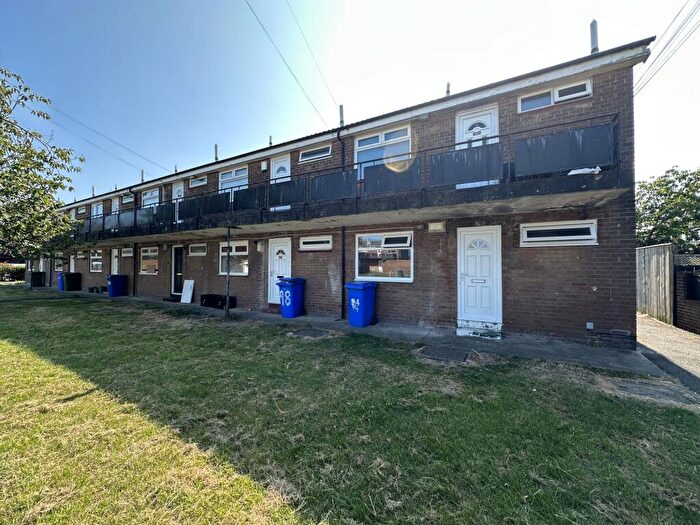
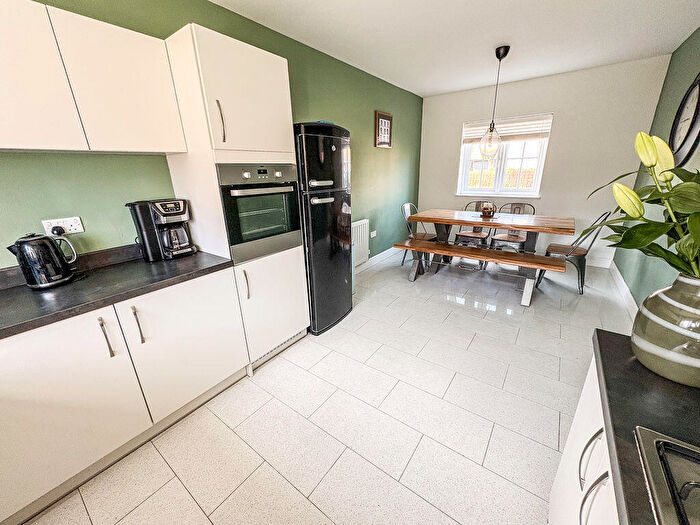
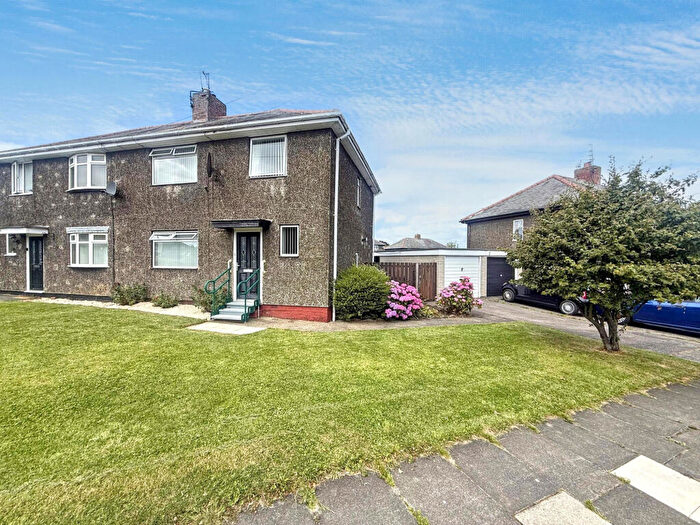
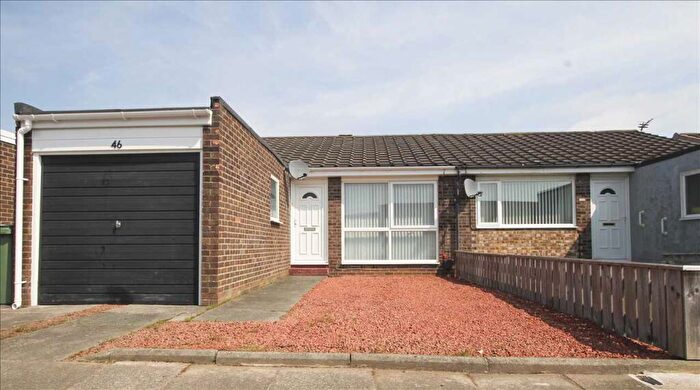
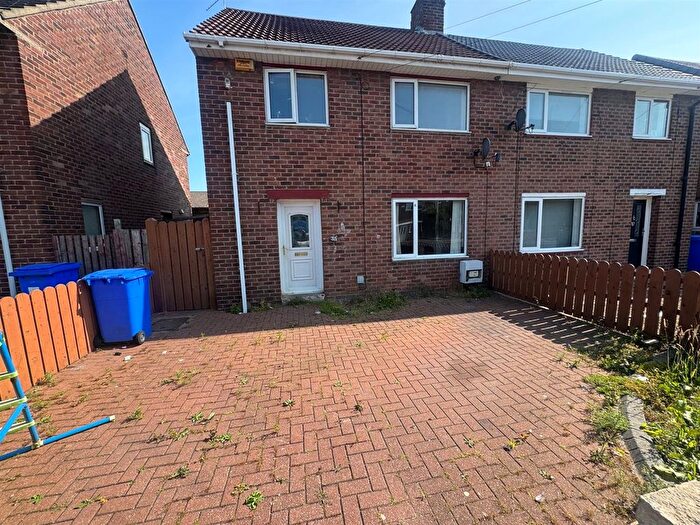
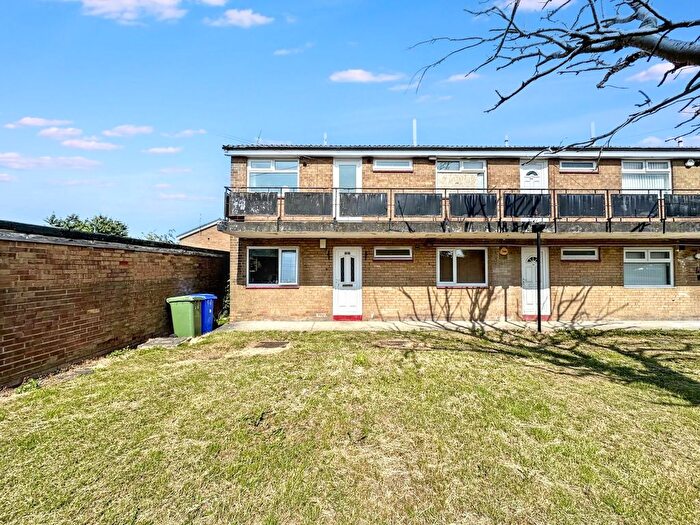
Properties for sale in Northumberland
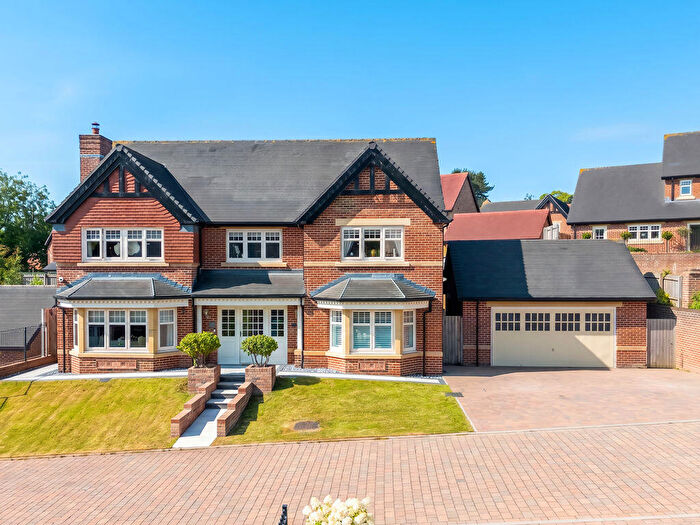
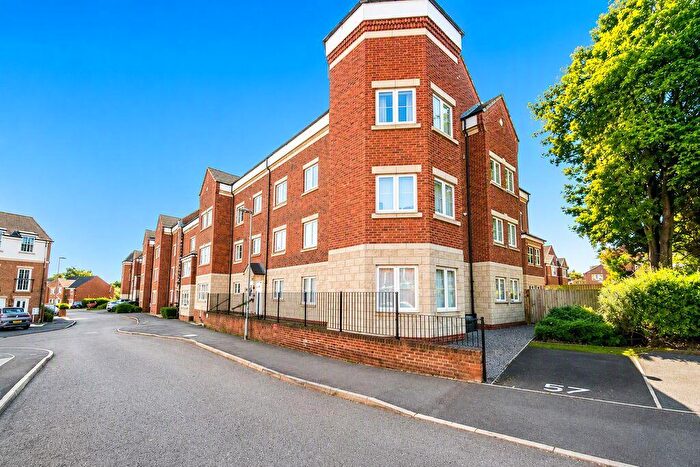
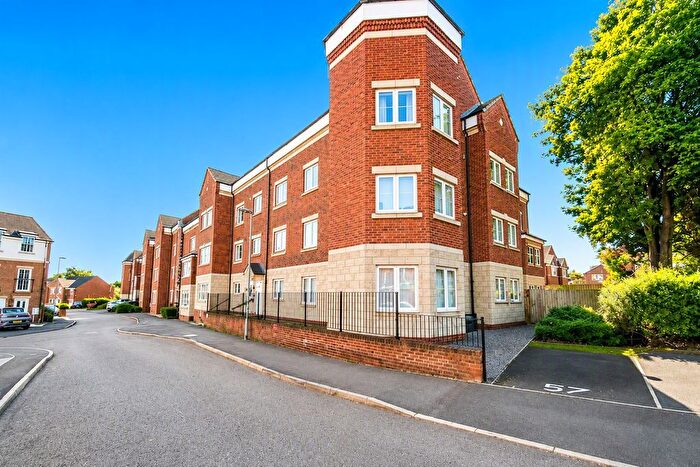
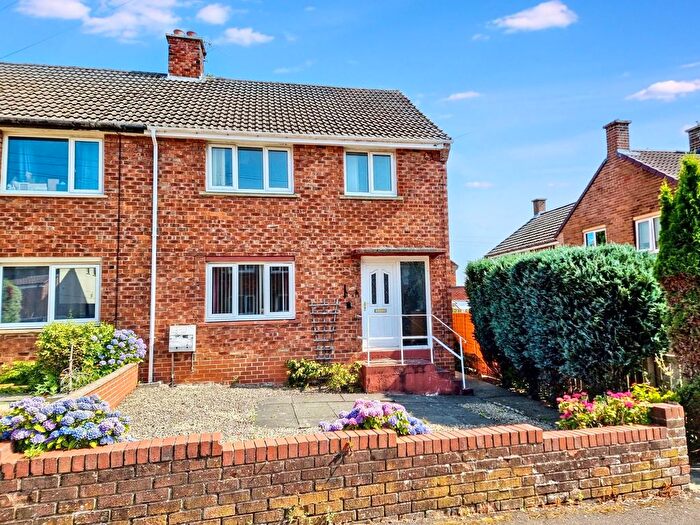
![]()
If you are looking to sell your house, let it out, or receive a property valuation, an expert can help you.
Click the button below to get started.

Towns in Northumberland
Navigate through our locations to find the location of your next house in Northumberland, England for sale or to rent.
- Brampton
- Berwick-upon-tweed
- Blyth
- Bedlington
- Malmesbury
- Cornhill-on-tweed
- Coldstream
- Stocksfield
- Prudhoe
- Chathill
- Corbridge
- Choppington
- Riding Mill
- Newcastle Upon Tyne
- Wylam
- Wooler
- Mindrum
- Consett
- Ashington
- Morpeth
- Bamburgh
- Cramlington
- Hexham
- Alston
- Haltwhistle
- Whitley Bay
- Alnwick
- Newbiggin-by-the-sea
- Seahouses
- Belford
Property price trends in Northumberland
According to the latest Land Registry data, the average home in Northumberland sold for £237,548 in 2026. That figure comes from a substantial record of 170,461 sales logged over the past 31 years.
Prices have moved up over the last three years. Compared with 2023, when the typical sale came in around £231,203, that's a rise of roughly 2.7%.
Looking back five years, average prices are up about 5.5% since 2021, a gain of around £12,464 in cash terms.
Zoom out to the past decade for the fuller picture. Back in 2016, homes here averaged £187,310, so the typical sold price has climbed about 26.8% since then, roughly 2.4% a year. Stretch the view to fifteen years and that annual pace holds at about 2.3%.
Frequently asked questions about Northumberland
What is the average price for a property for sale in Northumberland?
The average price for a property for sale in Northumberland is £236,253. This amount is 34% lower than the average price in England. There are more than 10,000 property listings for sale in Northumberland.
What locations have the most expensive properties for sale in Northumberland?
The locations with the most expensive properties for sale in Northumberland are Bamburgh at an average of £547,380, Riding Mill at an average of £533,440 and Newcastle Upon Tyne at an average of £503,589.
What locations have the most affordable properties for sale in Northumberland?
The locations with the most affordable properties for sale in Northumberland are Ashington at an average of £122,471, Choppington at an average of £134,737 and Newbiggin-by-the-sea at an average of £134,757.
Which train stations are available in or near Northumberland?
Some of the train stations available in or near Northumberland are Morpeth, Pegswood and Widdrington.
Property Price Paid in Northumberland by Year
The average sold property price by year was:
| Year | Average Sold Price | Price Change |
Sold Properties
|
|---|---|---|---|
| 2026 | £237,548 | -2% |
841 Properties |
| 2025 | £242,834 | 4% |
5,012 Properties |
| 2024 | £234,201 | 1% |
5,111 Properties |
| 2023 | £231,203 | 0,3% |
4,672 Properties |
| 2022 | £230,566 | 2% |
5,719 Properties |
| 2021 | £225,084 | 5% |
6,733 Properties |
| 2020 | £213,760 | 10% |
5,440 Properties |
| 2019 | £193,175 | -1% |
6,019 Properties |
| 2018 | £195,228 | 3% |
6,060 Properties |
| 2017 | £190,050 | 1% |
6,022 Properties |
Property Price per Property Type in Northumberland
Here you can find historic sold price data in order to help with your property search.
The average Property Paid Price for specific property types in the last three years are:
| Property Type | Average Sold Price | Sold Properties |
|---|---|---|
| Semi Detached House | £201,404.00 | 4,633 Semi Detached Houses |
| Terraced House | £160,953.00 | 5,238 Terraced Houses |
| Detached House | £410,964.00 | 4,225 Detached Houses |
| Flat | £117,886.00 | 1,540 Flats |
Transport in Northumberland
Please see below transportation links in this area:
