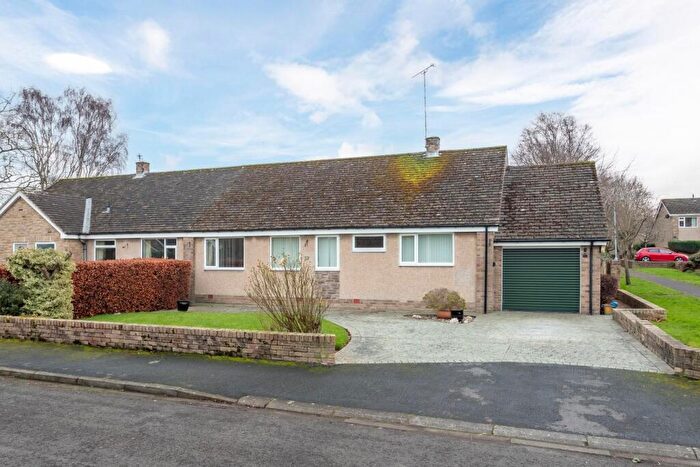
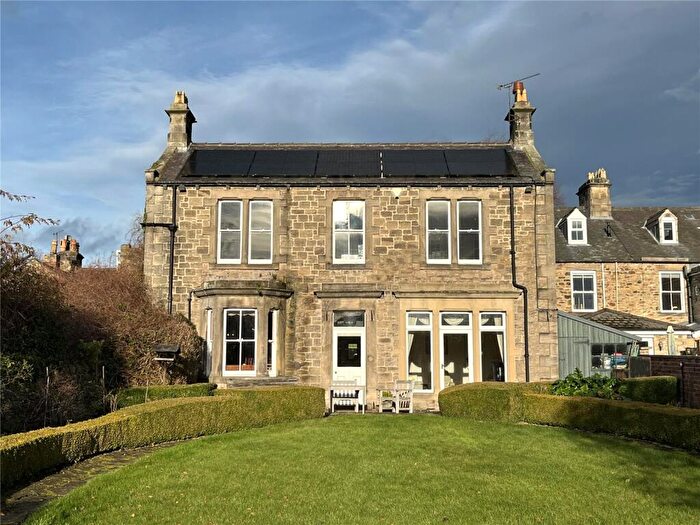
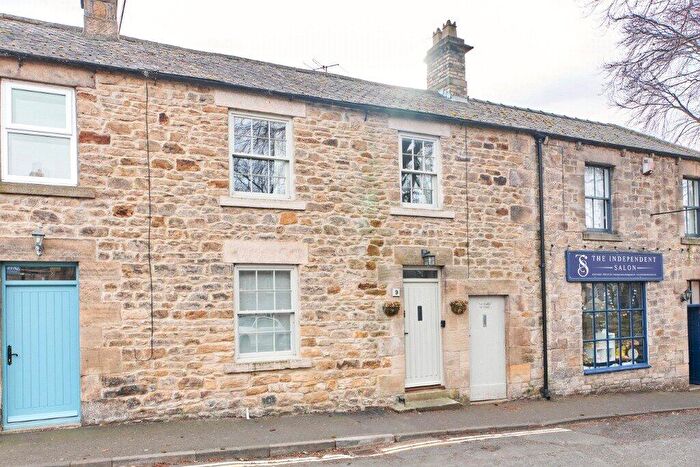
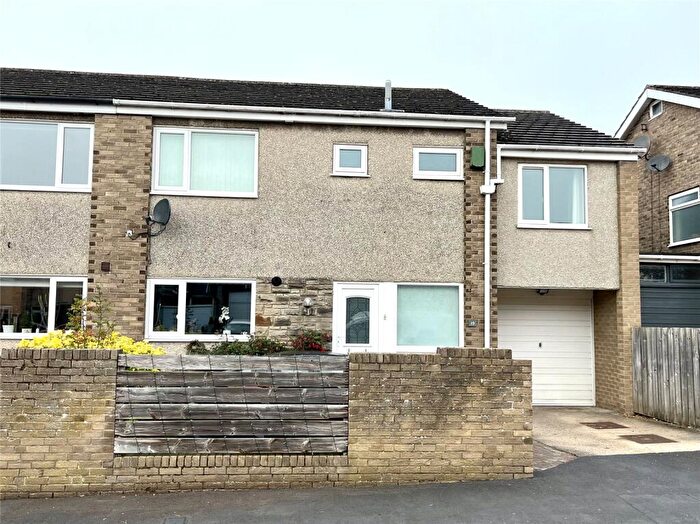
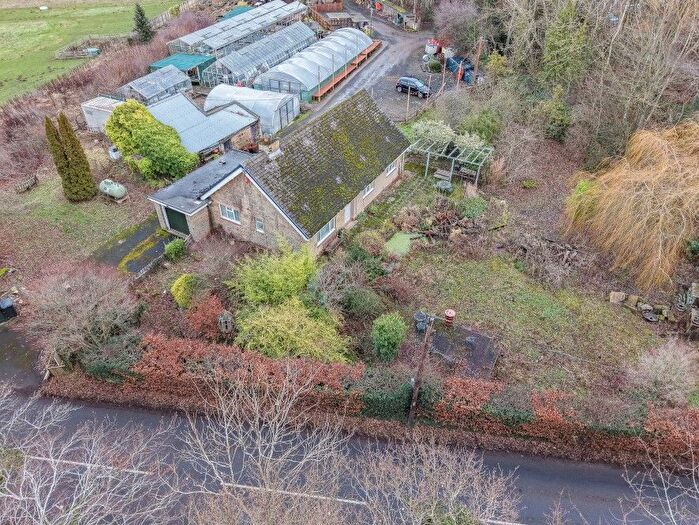
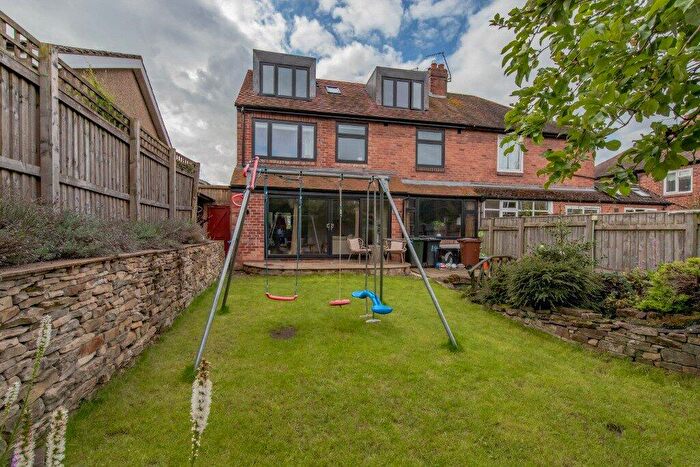
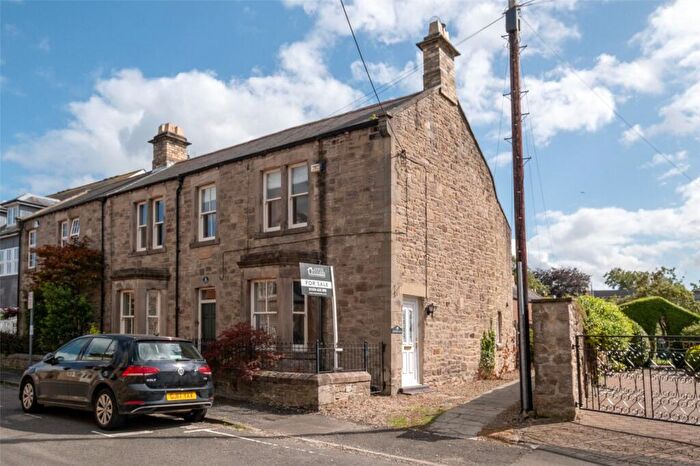
Houses for sale & to rent in Corbridge, Corbridge
House Prices in Corbridge
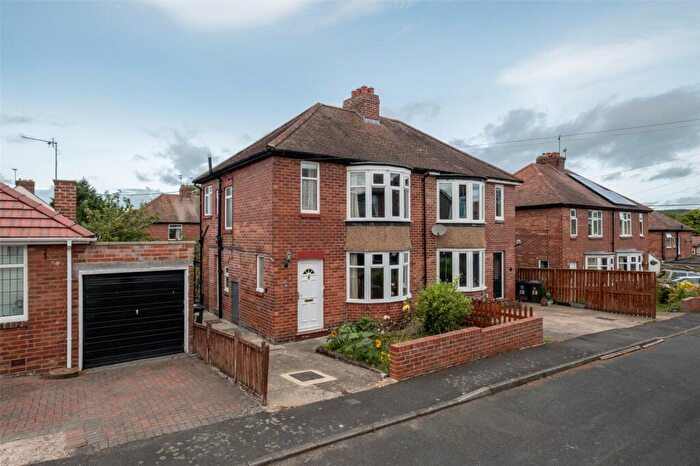
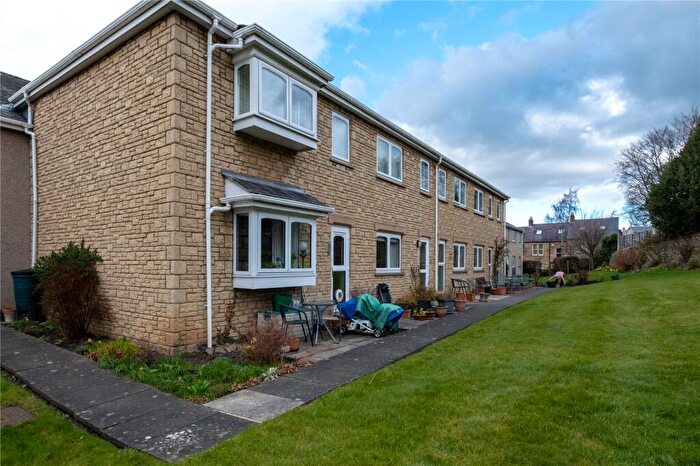
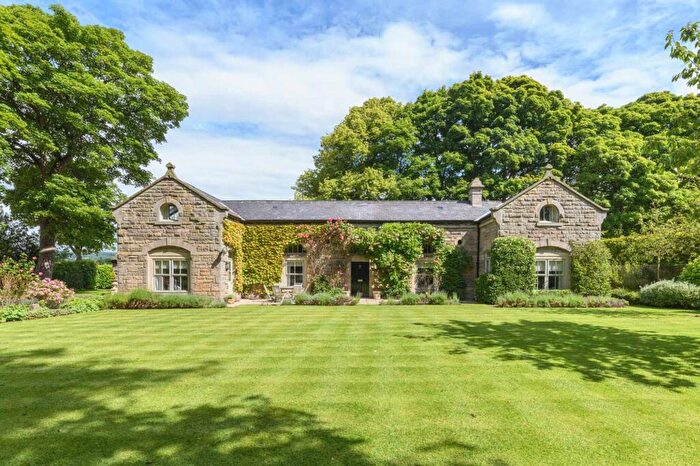
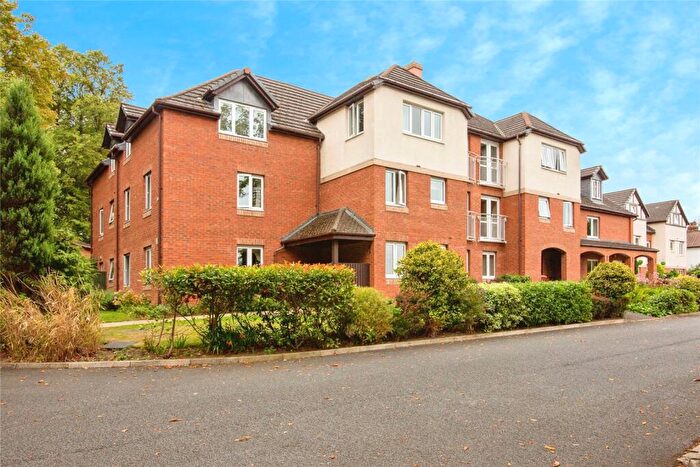
Properties in Corbridge have an average house price of £413,585.00 and had 139 Property Transactions within the last 3 years¹.
Corbridge is an area in Corbridge, Northumberland with 1,671 households², where the most expensive property was sold for £1,500,000.00.
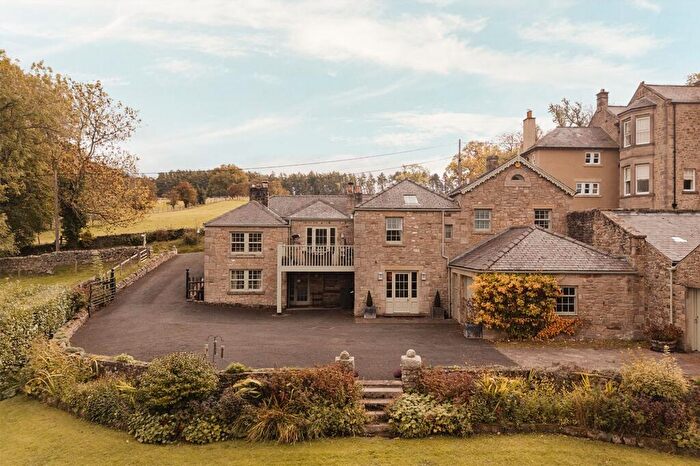
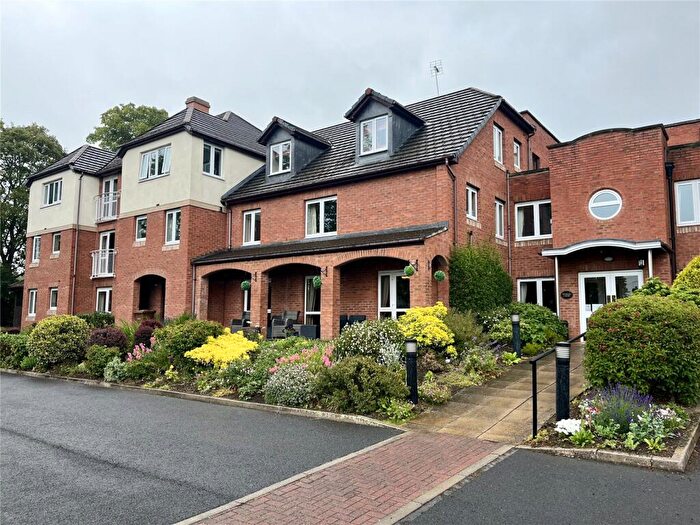
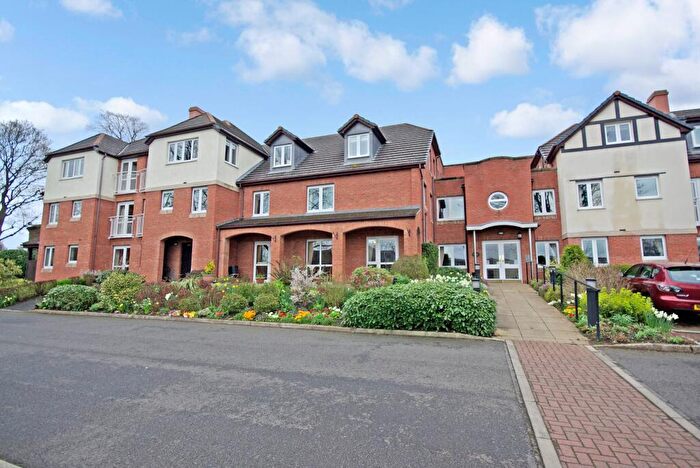
Properties for sale in Corbridge
Roads and Postcodes in Corbridge
Navigate through our locations to find the location of your next house in Corbridge, Corbridge for sale or to rent.
| Streets | Postcodes |
|---|---|
| Angus Gardens | NE45 5SL |
| Appletree Lane | NE45 5DN NE45 5LL |
| Appletree Rise | NE45 5HD |
| Aydon Avenue | NE45 5DY |
| Aydon Court | NE45 5ER |
| Aydon Crescent | NE45 5EB |
| Aydon Drive | NE45 5ED |
| Aydon Gardens | NE45 5DX |
| Aydon Grove | NE45 5DZ |
| Aydon Road | NE45 5DL NE45 5DP NE45 5DR NE45 5DT NE45 5DU NE45 5EF NE45 5EG NE45 5EH NE45 5EJ NE45 5ES NE45 5PW NE45 5EN NE45 5EP |
| Aydon Way | NE45 5EE |
| Beech Drive | NE45 5EW |
| Bilberry Way | NE45 5EA |
| Carham Close | NE45 5NA |
| Carrsfield | NE45 5LJ |
| Chains Drive | NE45 5BP |
| Chantry Estate | NE45 5JH |
| Chillingham Court | NE45 5SD |
| Colliery Cottages | NE45 5QB |
| Constable Place | NE45 5ET |
| Cookson Close | NE45 5HB |
| Coopers Court | NE45 5TA |
| Corchester Avenue | NE45 5HU NE45 5NR |
| Corchester Terrace | NE45 5NS |
| Cow Lane | NE45 5HX NE45 5HY |
| Cragside | NE45 5EU |
| Crofts Avenue | NE45 5LY NE45 5LZ |
| Crofts Close | NE45 5ND |
| Crofts Way | NE45 5NB |
| Deadridge Lane | NE45 5EQ |
| Dilston High Town Cottages | NE45 5RQ |
| Dilston West Cottages | NE45 5RL |
| Dunkirk Terrace | NE45 5AQ |
| Eastfield Cottages | NE45 5LR |
| Farnley | NE45 5RW |
| Friesian Drive | NE45 5SN |
| Front Street | NE45 5AP |
| Galloway Gardens | NE45 5SH |
| Garden Terrace | NE45 5BJ |
| Glebelands | NE45 5DS |
| Gloucester Close | NE45 5SG |
| Greencroft Avenue | NE45 5DW |
| Hallgarth Close | NE45 5BS |
| Hereford Close | NE45 5SQ |
| Hill Street | NE45 5AA |
| Hippingstones Lane | NE45 5JP |
| Holstein Close | NE45 5SJ |
| Jameson Drive | NE45 5EX |
| Kiln Place | NE45 5NJ |
| Kiln View | NE45 5AF |
| Ladycutter Lane | NE45 5RR NE45 5RZ |
| Leazes Lane | NE45 5QE |
| Leazes Terrace | NE45 5HS |
| Lincoln Lane | NE45 5SP |
| Longhorn Gardens | NE45 5SR |
| Main Street | NE45 5LA NE45 5LE NE45 5LB NE45 5LD |
| Manor Cottages | NE45 5HJ |
| Manor Park | NE45 5JS |
| Market Place | NE45 5AW NE45 5NH |
| Middle Street | NE45 5AT |
| Milkwell | NE45 5JG |
| Milkwell Lane | NE45 5QG NE45 5QF |
| Newcastle Road | NE45 5LG NE45 5LH NE45 5LN NE45 5LP NE45 5LQ NE45 5LS NE45 5LT NE45 5LU |
| Orchard Crescent | NE45 5DH |
| Orchard View | NE45 5BH |
| Pembroke Drive | NE45 5SF |
| Princes Street | NE45 5AE NE45 5BB NE45 5BZ NE45 5DA NE45 5DB NE45 5DG NE45 5DQ |
| Princes Street View | NE45 5DJ |
| Prior Terrace | NE45 5HN |
| Priory Gardens | NE45 5HZ |
| Roman Way | NE45 5JN |
| Siskin Drive | NE45 5AB |
| Spoutwell Lane | NE45 5LF |
| St Andrews Terrace | NE45 5AL |
| St Helens Lane | NE45 5JQ NE45 5JD NE45 5JE |
| St Helens Place | NE45 5BQ |
| St Helens Street | NE45 5BE NE45 5BF NE45 5HE |
| St Wilfreds Court | NE45 5BT |
| St Wilfreds Road | NE45 5DE |
| St Wilfreds Terrace | NE45 5BL |
| Stagshaw Road | NE45 5HG NE45 5HR NE45 5HT NE45 5PA NE45 5PB NE45 5PE |
| Station Road | NE45 5AR NE45 5AX NE45 5AY |
| Station Yard | NE45 5AZ |
| Straker Gardens | NE45 5JT |
| Sussex Drive | NE45 5SE |
| Synclen Avenue | NE45 5JF |
| Synclen Road | NE45 5JJ |
| Synclen Terrace | NE45 5JL |
| The Avenue | NE45 5JB |
| The Crofts | NE45 5LW |
| The Orchard | NE45 5DD |
| The Riggs | NE45 5JX |
| The Stanners | NE45 5BA |
| Tinklers Bank | NE45 5SB |
| Town Hall Buildings | NE45 5AD |
| Trinity Terrace | NE45 5HP NE45 5HW |
| Tyne View Terrace | NE45 5AJ |
| Watling Street | NE45 5AG NE45 5AH |
| Well Bank | NE45 5AN |
| West End Terrace | NE45 5HQ |
| West End Terrace Mews | NE45 5HA |
| West Terrace | NE45 5HH |
| Willow Dyke | NE45 5JR |
| Windsor Court | NE45 5BN |
| Windsor Terrace | NE45 5BX NE45 5DF |
| Woodbine Lane | NE45 5BW |
| Woodbine Terrace | NE45 5BD |
| Woodside Avenue | NE45 5EL |
| NE45 5AU NE45 5HF NE45 5LX NE45 5NP NE45 5NU NE45 5PD NE45 5PL NE45 5PP NE45 5PT NE45 5QD NE45 5QX NE45 5RF NE45 5RH NE45 5RN NE45 5RP NE45 5RT NE45 5RU NE45 5RX NE45 5RY NE19 2LA NE45 5NT NE45 5PF NE45 5PG NE45 5PJ NE45 5PR NE45 5PS NE45 5PY NE45 5QT NE45 5QU NE45 5QY NE45 5QZ NE45 5RA NE45 5RB NE45 5RE NE45 5RG NE45 5RJ NE45 5RS NE45 5SA |
Transport near Corbridge
- FAQ
- Price Paid By Year
- Property Type Price
Frequently asked questions about Corbridge
What is the average price for a property for sale in Corbridge?
The average price for a property for sale in Corbridge is £413,585. There are 358 property listings for sale in Corbridge.
What streets have the most expensive properties for sale in Corbridge?
The streets with the most expensive properties for sale in Corbridge are Spoutwell Lane at an average of £935,000, Appletree Rise at an average of £900,000 and The Stanners at an average of £900,000.
What streets have the most affordable properties for sale in Corbridge?
The streets with the most affordable properties for sale in Corbridge are Windsor Court at an average of £105,357, Chantry Estate at an average of £158,750 and St Wilfreds Road at an average of £196,666.
Which train stations are available in or near Corbridge?
Some of the train stations available in or near Corbridge are Corbridge, Riding Mill and Hexham.
Property Price Paid in Corbridge by Year
The average sold property price by year was:
| Year | Average Sold Price | Price Change |
Sold Properties
|
|---|---|---|---|
| 2025 | £412,855 | -6% |
50 Properties |
| 2024 | £437,520 | 11% |
47 Properties |
| 2023 | £387,670 | 7% |
42 Properties |
| 2022 | £358,784 | -42% |
54 Properties |
| 2021 | £508,052 | 34% |
86 Properties |
| 2020 | £334,873 | -7% |
53 Properties |
| 2019 | £357,596 | -1% |
49 Properties |
| 2018 | £362,623 | -3% |
63 Properties |
| 2017 | £375,264 | 13% |
71 Properties |
| 2016 | £326,759 | 9% |
104 Properties |
| 2015 | £297,860 | -23% |
66 Properties |
| 2014 | £366,721 | 12% |
76 Properties |
| 2013 | £323,141 | 20% |
53 Properties |
| 2012 | £257,916 | -40% |
57 Properties |
| 2011 | £361,094 | -9% |
63 Properties |
| 2010 | £394,937 | 23% |
58 Properties |
| 2009 | £304,630 | -8% |
42 Properties |
| 2008 | £328,999 | -2% |
56 Properties |
| 2007 | £336,634 | 12% |
87 Properties |
| 2006 | £297,164 | 9% |
96 Properties |
| 2005 | £269,279 | 2% |
82 Properties |
| 2004 | £262,624 | 12% |
68 Properties |
| 2003 | £231,911 | 15% |
55 Properties |
| 2002 | £197,959 | 18% |
76 Properties |
| 2001 | £163,255 | 32% |
88 Properties |
| 2000 | £110,616 | -24% |
59 Properties |
| 1999 | £137,141 | 17% |
78 Properties |
| 1998 | £113,771 | 4% |
72 Properties |
| 1997 | £109,598 | 5% |
71 Properties |
| 1996 | £103,817 | 3% |
78 Properties |
| 1995 | £100,214 | - |
56 Properties |
Property Price per Property Type in Corbridge
Here you can find historic sold price data in order to help with your property search.
The average Property Paid Price for specific property types in the last three years are:
| Property Type | Average Sold Price | Sold Properties |
|---|---|---|
| Flat | £193,287.00 | 27 Flats |
| Semi Detached House | £414,382.00 | 34 Semi Detached Houses |
| Detached House | £617,750.00 | 42 Detached Houses |
| Terraced House | £339,864.00 | 36 Terraced Houses |

