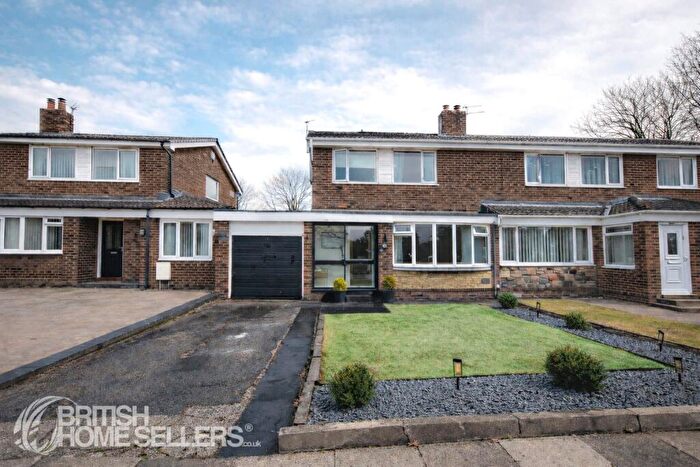
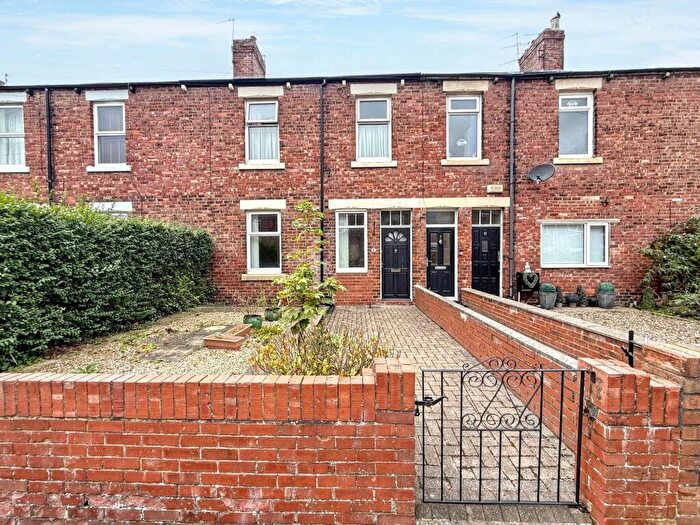
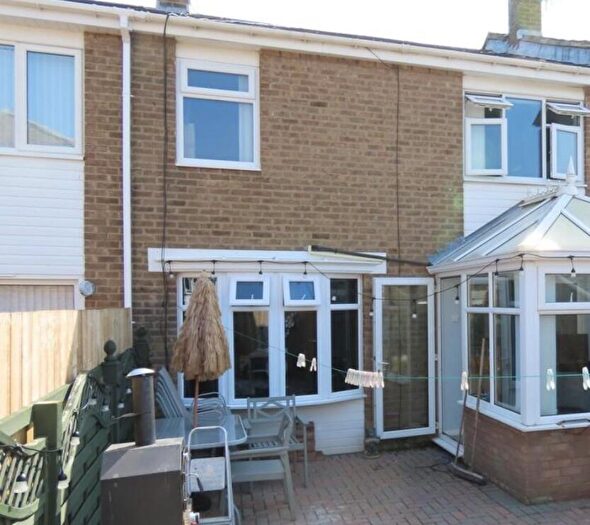
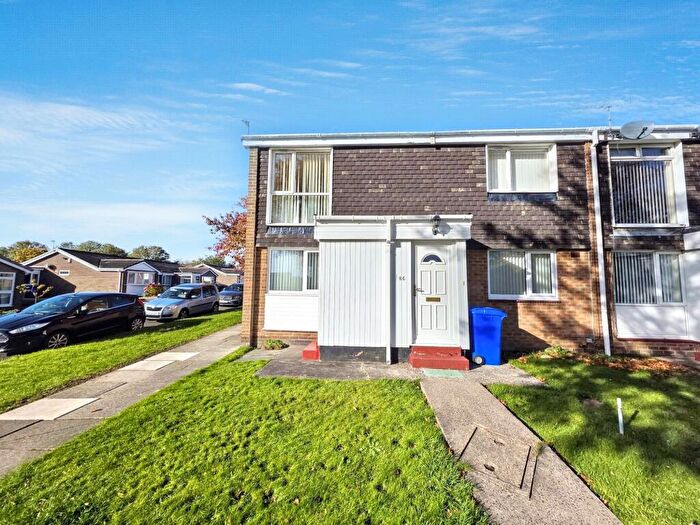
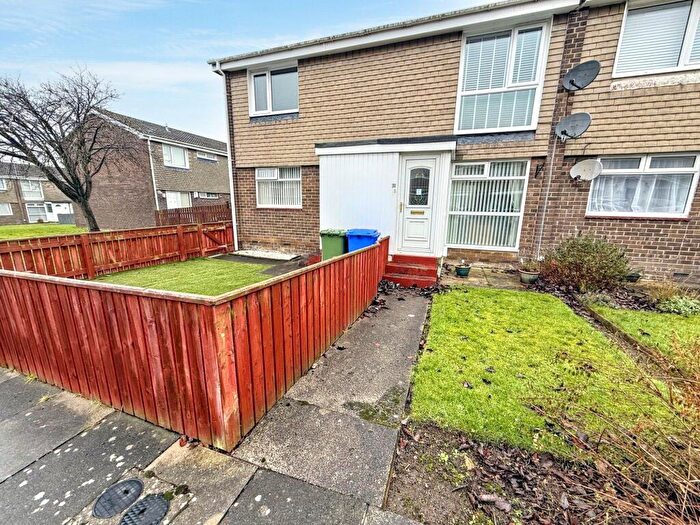
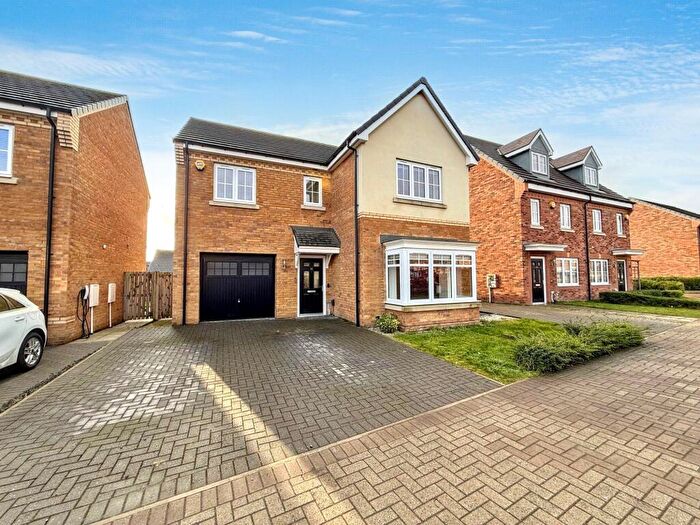
Houses for sale & to rent in Cramlington East, Cramlington
House Prices in Cramlington East
Properties in Cramlington East have an average house price of £158,219.00 and had 149 Property Transactions within the last 3 years¹.
Cramlington East is an area in Cramlington, Northumberland with 1,828 households², where the most expensive property was sold for £585,000.00.
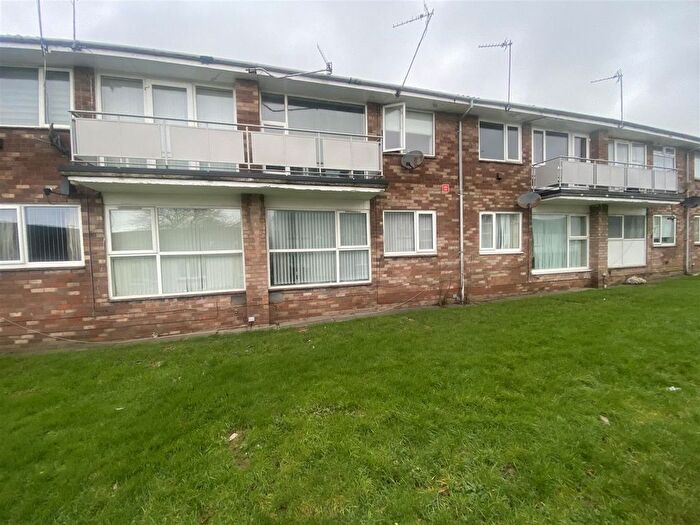
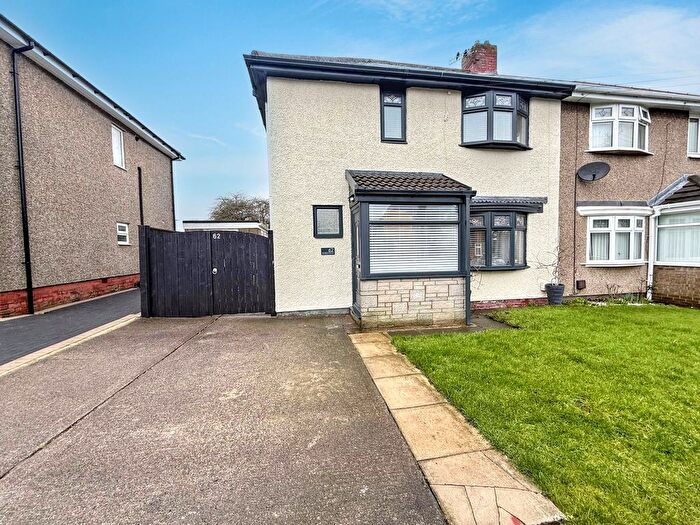
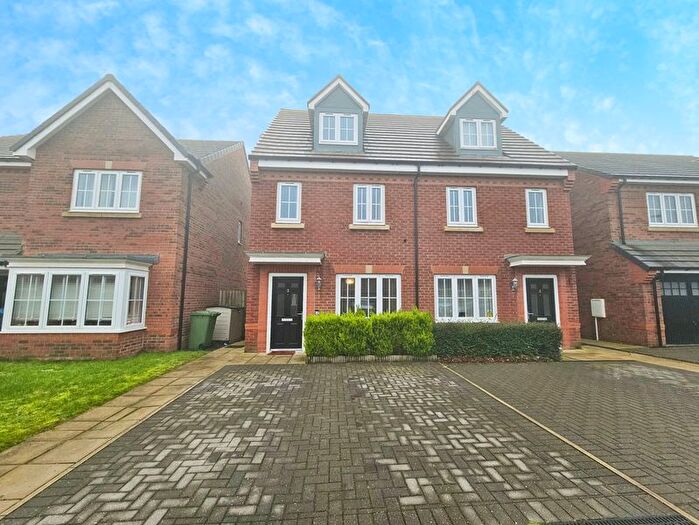
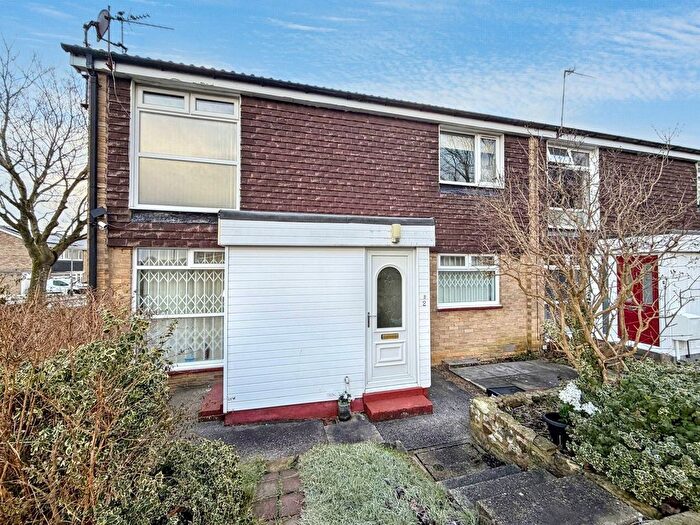
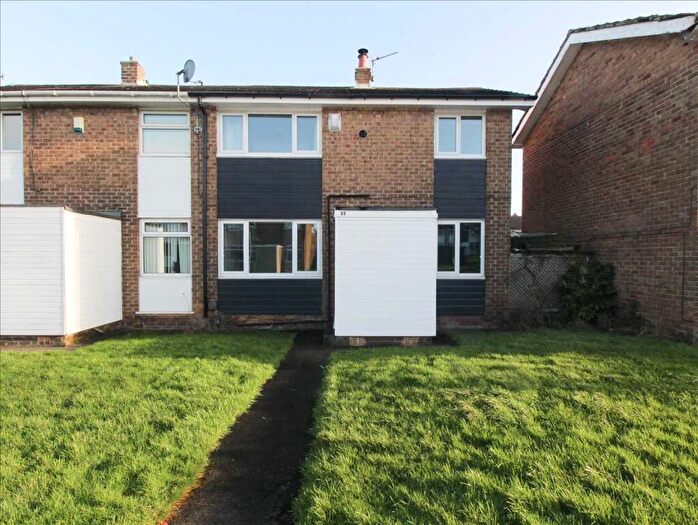
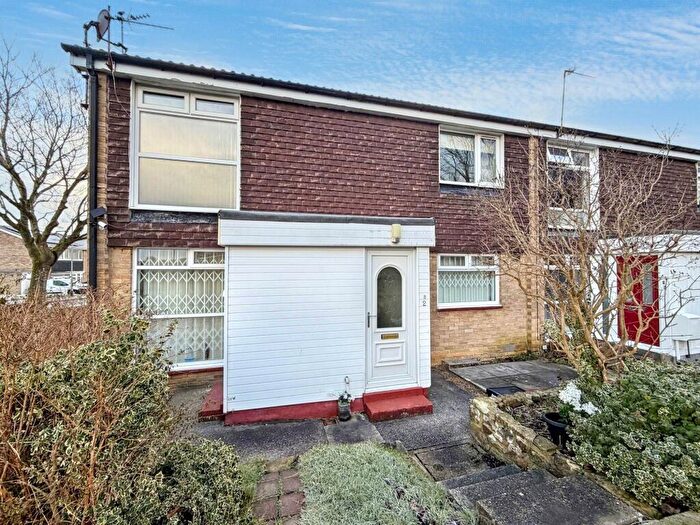
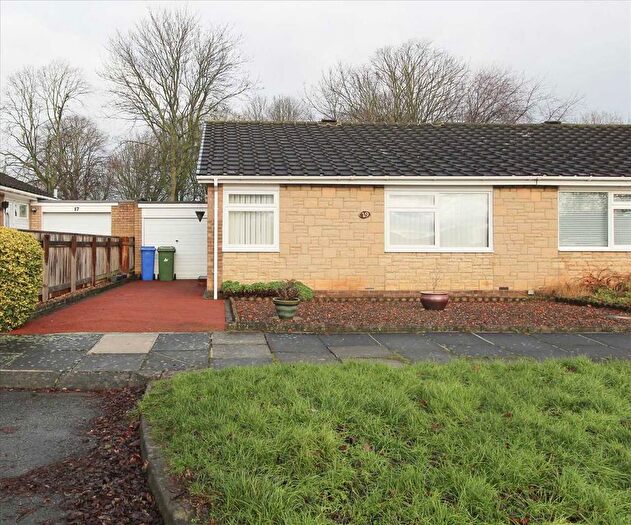
Properties for sale in Cramlington East
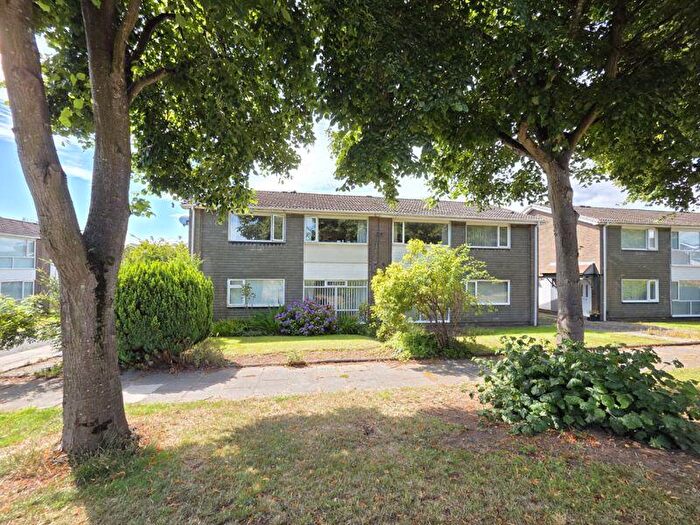
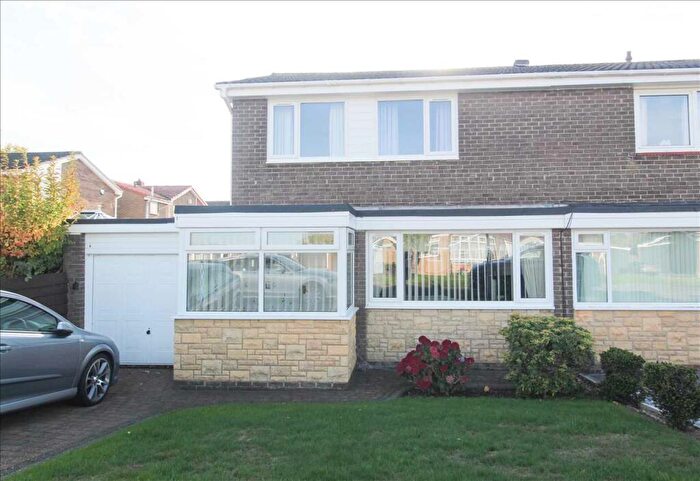
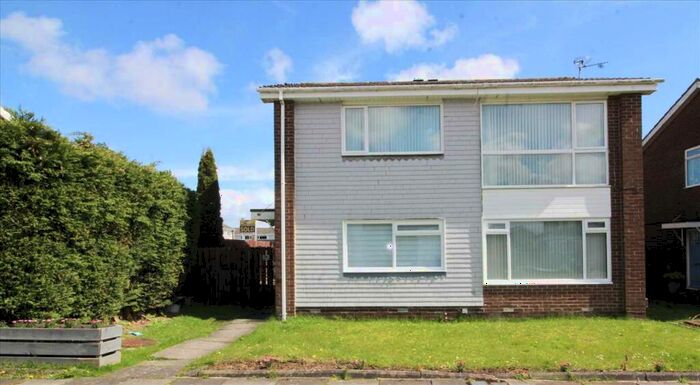
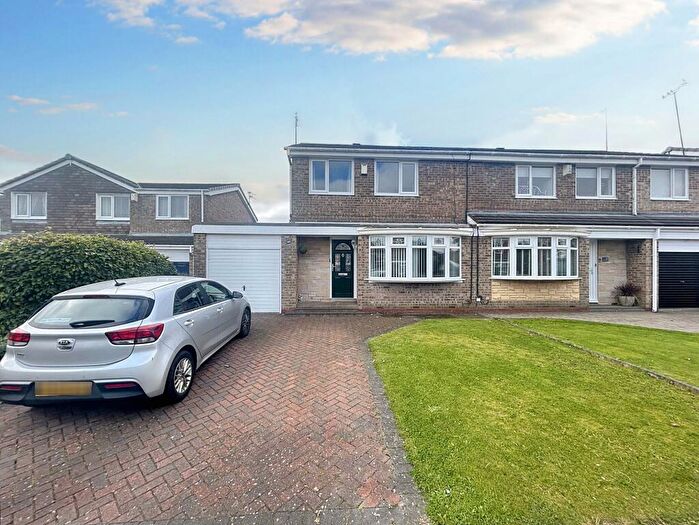
Previously listed properties in Cramlington East
Roads and Postcodes in Cramlington East
Navigate through our locations to find the location of your next house in Cramlington East, Cramlington for sale or to rent.
| Streets | Postcodes |
|---|---|
| Aged Miners Homes | NE23 6RE |
| Alston Avenue | NE23 6RP |
| Appleyard Grove | NE23 6AB |
| Aylesbury Grange | NE23 6BS |
| Barbary Way | NE23 6BP |
| Barrasford Road | NE23 6TD NE23 6TE |
| Beech Avenue | NE23 6XS |
| Blue Top Cottages | NE23 2EF |
| Brinkburn Avenue | NE23 6TB |
| Brownrigg Drive | NE23 6TF NE23 6UN |
| Callaly Avenue | NE23 6TP |
| Callerton Close | NE23 6TR |
| Cambo Drive | NE23 6TN NE23 6TW |
| Carham Avenue | NE23 6TT |
| Chatton Avenue | NE23 6TA |
| Chipchase Avenue | NE23 6TS |
| Clifton Road | NE23 6TG NE23 6TH NE23 6TJ NE23 6TQ |
| Coanwood Drive | NE23 6TL NE23 6UG |
| Coldbeck Court | NE23 6UQ |
| Cornhill Road | NE23 6SZ |
| East Cramlington Industrial Estate | NE23 6XW |
| Elizabeth Street | NE23 6XJ |
| Evergreen Court | NE23 6BT |
| Fernley Villas | NE23 2AG |
| Front Street | NE23 6RF |
| Gladwall Close | NE23 6BZ |
| Gressingham Close | NE23 6AD |
| Hastings Street | NE23 6RQ |
| Hawthorn Villas | NE23 2AE |
| Helen Street | NE23 6XG |
| High Pit Road | NE23 6RA NE23 6RB |
| Lamb Street | NE23 6XF NE23 6XP |
| Lanercost Park | NE23 6RU NE23 6RX NE23 6QU NE23 6RY |
| Mallard Street | NE23 6DA |
| Marjorie Street | NE23 6XQ |
| Mayfield Avenue | NE23 2AA NE23 2AB |
| Merganser Crescent | NE23 6FF |
| Northumbria Way | NE23 6NZ |
| Percy Street | NE23 6RG |
| Pickering Close | NE23 6QB |
| Reedswood Crescent | NE23 6RW |
| Ridley Street | NE23 6RH |
| Rosedene Villas | NE23 2AF |
| Rouen Crescent | NE23 6FE |
| Rowan Grove | NE23 6XT |
| Sea View Park | NE23 2DL |
| Sea View Villas | NE23 2AD |
| Storey Street | NE23 6RL |
| Tangmere Close | NE23 2EJ NE23 2EL |
| Teal Grove | NE23 6BF |
| The Paddock | NE23 6XR |
| Thirston Drive | NE23 2BX NE23 2BY NE23 2DF NE23 2DE |
| Thornley Avenue | NE23 2BT NE23 2BU |
| Tindale Avenue | NE23 2BP NE23 2BS NE23 2DA NE23 2DB |
| Torwood Court | NE23 2BZ |
| Turnberry Way | NE23 2DD |
| Village Road | NE23 2AJ NE23 2AQ NE23 2AH NE23 2EE |
| Watervale Gardens | NE23 6BY |
| Weldon Road | NE23 6RR |
| West View | NE23 6RJ |
| NE23 6RN NE23 6RD NE23 2AL |
Transport near Cramlington East
-
Cramlington Station
-
Morpeth Station
-
Pegswood Station
-
Manors Station
-
Newcastle Station
-
Heworth Station
-
MetroCentre Station
-
Dunston Station
-
Blaydon Station
- FAQ
- Price Paid By Year
- Property Type Price
Frequently asked questions about Cramlington East
What is the average price for a property for sale in Cramlington East?
The average price for a property for sale in Cramlington East is £158,219. This amount is 17% lower than the average price in Cramlington. There are 835 property listings for sale in Cramlington East.
What streets have the most expensive properties for sale in Cramlington East?
The streets with the most expensive properties for sale in Cramlington East are The Paddock at an average of £585,000, Barbary Way at an average of £291,250 and Aylesbury Grange at an average of £289,499.
What streets have the most affordable properties for sale in Cramlington East?
The streets with the most affordable properties for sale in Cramlington East are Tangmere Close at an average of £70,000, Brinkburn Avenue at an average of £82,400 and Storey Street at an average of £84,500.
Which train stations are available in or near Cramlington East?
Some of the train stations available in or near Cramlington East are Cramlington, Morpeth and Pegswood.
Property Price Paid in Cramlington East by Year
The average sold property price by year was:
| Year | Average Sold Price | Price Change |
Sold Properties
|
|---|---|---|---|
| 2025 | £174,766 | 16% |
51 Properties |
| 2024 | £146,436 | -5% |
54 Properties |
| 2023 | £153,499 | 11% |
44 Properties |
| 2022 | £137,374 | -21% |
57 Properties |
| 2021 | £165,695 | -7% |
98 Properties |
| 2020 | £177,428 | 2% |
69 Properties |
| 2019 | £173,556 | 8% |
83 Properties |
| 2018 | £160,033 | 17% |
85 Properties |
| 2017 | £132,367 | 22% |
75 Properties |
| 2016 | £102,894 | -8% |
54 Properties |
| 2015 | £110,762 | 10% |
45 Properties |
| 2014 | £99,385 | 15% |
47 Properties |
| 2013 | £84,517 | -33% |
40 Properties |
| 2012 | £112,210 | 22% |
64 Properties |
| 2011 | £87,186 | -11% |
27 Properties |
| 2010 | £96,878 | 7% |
33 Properties |
| 2009 | £90,260 | -18% |
23 Properties |
| 2008 | £106,889 | -3% |
37 Properties |
| 2007 | £109,738 | -11% |
69 Properties |
| 2006 | £121,278 | 24% |
88 Properties |
| 2005 | £92,517 | 3% |
42 Properties |
| 2004 | £89,541 | 22% |
64 Properties |
| 2003 | £70,217 | 26% |
81 Properties |
| 2002 | £52,115 | 18% |
86 Properties |
| 2001 | £42,510 | -0,2% |
76 Properties |
| 2000 | £42,607 | -7% |
59 Properties |
| 1999 | £45,497 | 5% |
79 Properties |
| 1998 | £43,045 | 24% |
75 Properties |
| 1997 | £32,616 | 8% |
39 Properties |
| 1996 | £29,945 | 14% |
36 Properties |
| 1995 | £25,634 | - |
33 Properties |
Property Price per Property Type in Cramlington East
Here you can find historic sold price data in order to help with your property search.
The average Property Paid Price for specific property types in the last three years are:
| Property Type | Average Sold Price | Sold Properties |
|---|---|---|
| Semi Detached House | £149,167.00 | 74 Semi Detached Houses |
| Detached House | £275,807.00 | 26 Detached Houses |
| Terraced House | £109,277.00 | 48 Terraced Houses |
| Flat | £119,950.00 | 1 Flat |

