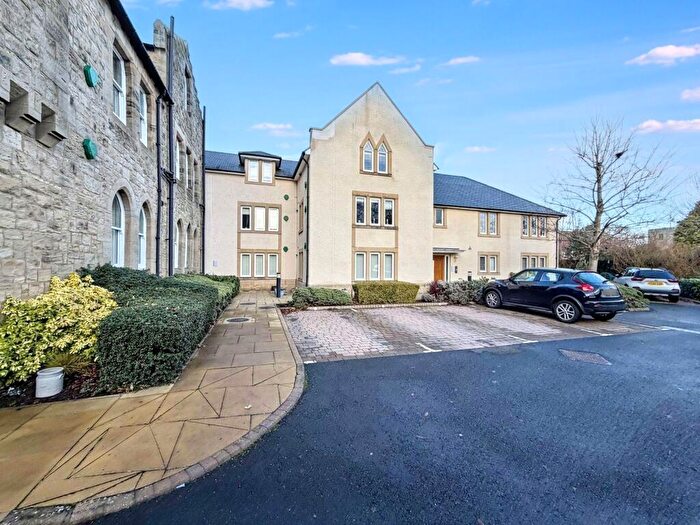
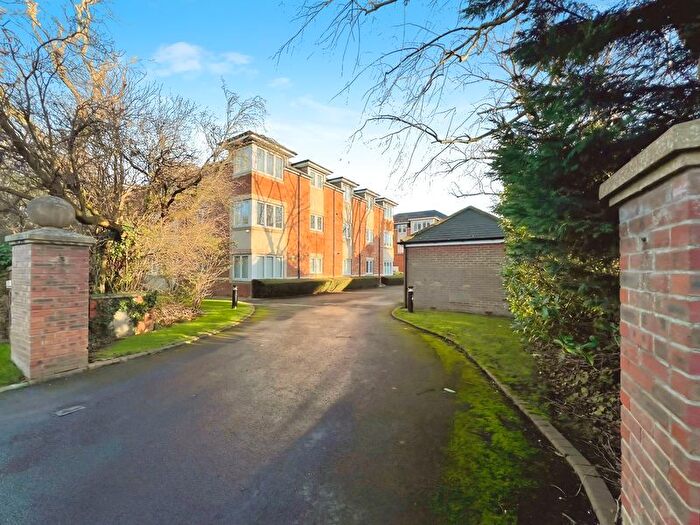
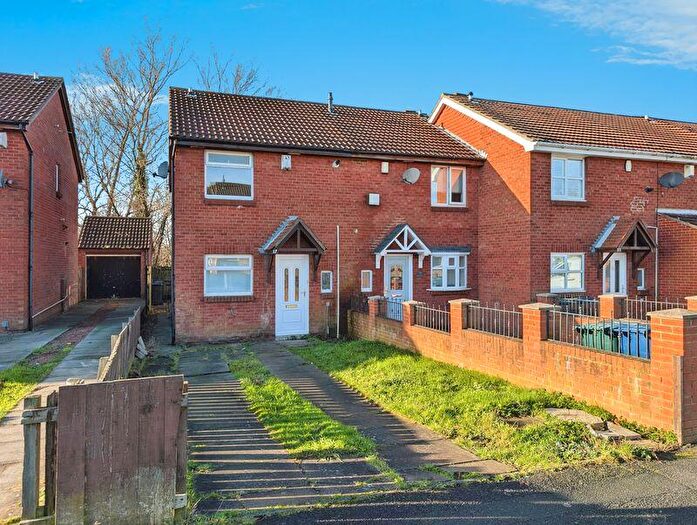
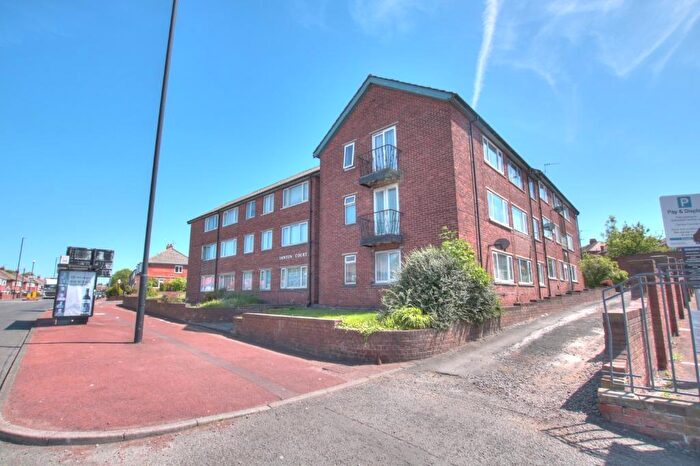
Houses for sale & to rent in Ponteland East And Stannington, Newcastle Upon Tyne
House Prices in Ponteland East And Stannington
Properties in Ponteland East And Stannington have an average house price of £418,805.00 and had 161 Property Transactions within the last 3 years¹.
Ponteland East And Stannington is an area in Newcastle Upon Tyne, Northumberland with 1,198 households², where the most expensive property was sold for £1,500,000.00.
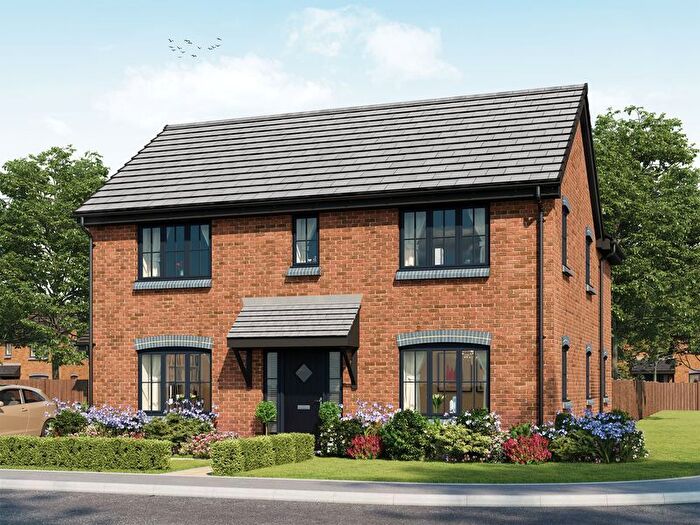
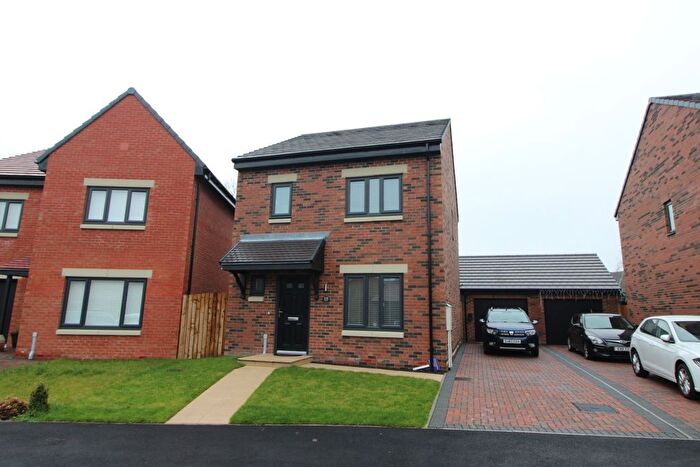
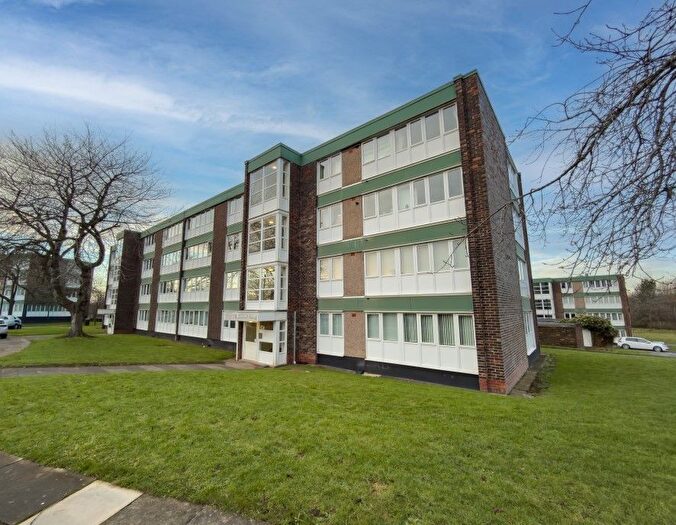
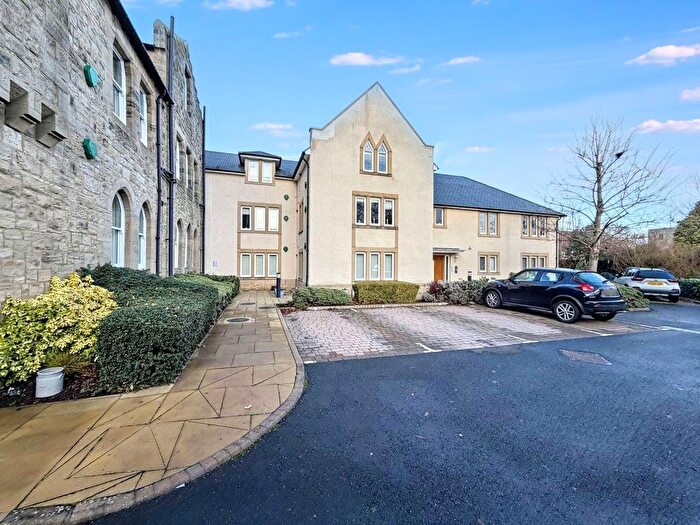
Properties for sale in Ponteland East And Stannington
Roads and Postcodes in Ponteland East And Stannington
Navigate through our locations to find the location of your next house in Ponteland East And Stannington, Newcastle Upon Tyne for sale or to rent.
| Streets | Postcodes |
|---|---|
| Barony Grove | NE20 0FZ |
| Bell Villas | NE20 9BD NE20 9BE |
| Berwick Hill | NE20 0BJ NE20 0JX NE20 0JY |
| Berwick Hill Cottages | NE20 0JZ |
| Berwick Hill Road | NE13 6BX NE13 6BY NE13 6BU NE13 6DA |
| Blagdon | NE13 6DD |
| Blagdon Estate | NE13 6DB NE13 6BF |
| Callerton Court | NE20 9EN |
| Callerton Lane | NE20 9EG NE20 9EL NE20 9EY |
| Carr Field | NE20 9XR |
| Carr View | NE20 9TZ |
| Cecil Court | NE20 9EE |
| Cheviot View | NE20 9BH NE20 9BP NE20 9BW |
| Church Chare | NE20 9XT |
| Church Flatt | NE20 9XQ |
| Click Em In | NE20 9DD |
| Dunsgreen | NE20 9EH NE20 9EJ |
| Dunsgreen Court | NE20 9EX |
| Eastern Way | NE20 9RD NE20 9RE NE20 9RH |
| Edge Hill | NE20 9RN |
| Eland Edge | NE20 9AY |
| Eland View | NE20 9EQ |
| Elm Road | NE20 9BS |
| Fairney Close | NE20 9ED |
| Fairney Edge | NE20 9EF |
| Fisher Lane | NE13 6BP |
| Great North Road | NE13 6DF |
| Green Lane | NE13 6BZ |
| Greystoke Place | NE20 0FX |
| Low Haugh | NE20 9XN |
| Mayfair Gardens | NE20 9EZ |
| Meadow Court | NE20 9RA NE20 9RB |
| Middle Drive | NE20 9DH |
| Old Great North Road | NE13 6BS NE13 6DG |
| Paddock Hill | NE20 9XL |
| Pont Haugh | NE20 9XD |
| Ponteland | NE20 9BQ NE20 9TP NE20 9TR NE20 9BB NE20 0AL |
| Prestwick Park | NE20 9SJ |
| Prestwick Road Ends | NE20 9BX |
| Ridgely Close | NE20 9BN |
| Ridgely Drive | NE20 9BJ NE20 9BL |
| Rivermede | NE20 9XA |
| Ryehaugh | NE20 9BA |
| Somerville Road | NE20 0FY |
| Street Houses | NE20 9BT |
| The Crofts | NE20 9AZ |
| The Square | NE20 9TY |
| Willow Place | NE20 9RL |
| Willow Way | NE20 9RF NE20 9RG NE20 9RJ |
| Wood Fields | NE20 9XP |
| NE20 9TT NE20 9TU NE20 9TX NE20 9UA NE20 9UB NE20 9UD NE13 6DE NE20 9TS NE20 0AJ NE20 0AN NE20 0AR NE20 0AS NE20 0AU NE20 0AX NE20 0AZ NE20 0AP NE20 0AT NE20 0AW NE20 0AY NE20 0BH NE20 0DP NE20 0DR NE20 0DW |
Transport near Ponteland East And Stannington
-
Cramlington Station
-
Blaydon Station
-
Wylam Station
-
Morpeth Station
-
MetroCentre Station
-
Newcastle Station
-
Manors Station
-
Prudhoe Station
-
Dunston Station
-
Pegswood Station
- FAQ
- Price Paid By Year
- Property Type Price
Frequently asked questions about Ponteland East And Stannington
What is the average price for a property for sale in Ponteland East And Stannington?
The average price for a property for sale in Ponteland East And Stannington is £418,805. This amount is 17% lower than the average price in Newcastle Upon Tyne. There are 9,939 property listings for sale in Ponteland East And Stannington.
What streets have the most expensive properties for sale in Ponteland East And Stannington?
The streets with the most expensive properties for sale in Ponteland East And Stannington are Middle Drive at an average of £1,008,333, Eastern Way at an average of £788,112 and Willow Place at an average of £767,500.
What streets have the most affordable properties for sale in Ponteland East And Stannington?
The streets with the most affordable properties for sale in Ponteland East And Stannington are Dunsgreen Court at an average of £121,944, The Square at an average of £149,000 and Green Lane at an average of £162,000.
Which train stations are available in or near Ponteland East And Stannington?
Some of the train stations available in or near Ponteland East And Stannington are Cramlington, Blaydon and Wylam.
Property Price Paid in Ponteland East And Stannington by Year
The average sold property price by year was:
| Year | Average Sold Price | Price Change |
Sold Properties
|
|---|---|---|---|
| 2025 | £438,330 | 7% |
31 Properties |
| 2024 | £409,303 | -8% |
47 Properties |
| 2023 | £442,871 | 10% |
35 Properties |
| 2022 | £397,950 | 3% |
48 Properties |
| 2021 | £385,915 | -10% |
53 Properties |
| 2020 | £426,176 | 28% |
54 Properties |
| 2019 | £307,683 | -34% |
43 Properties |
| 2018 | £410,843 | 16% |
46 Properties |
| 2017 | £346,200 | 6% |
41 Properties |
| 2016 | £324,778 | -2% |
60 Properties |
| 2015 | £332,369 | 4% |
56 Properties |
| 2014 | £320,333 | 9% |
43 Properties |
| 2013 | £291,915 | -8% |
49 Properties |
| 2012 | £314,482 | 11% |
44 Properties |
| 2011 | £280,429 | -12% |
36 Properties |
| 2010 | £312,820 | 18% |
48 Properties |
| 2009 | £256,599 | -14% |
36 Properties |
| 2008 | £292,637 | -13% |
36 Properties |
| 2007 | £330,625 | 8% |
52 Properties |
| 2006 | £303,534 | -6% |
59 Properties |
| 2005 | £321,107 | 20% |
41 Properties |
| 2004 | £257,811 | 0,1% |
44 Properties |
| 2003 | £257,503 | 29% |
48 Properties |
| 2002 | £182,273 | 16% |
65 Properties |
| 2001 | £153,025 | -14% |
77 Properties |
| 2000 | £175,088 | 30% |
77 Properties |
| 1999 | £123,062 | 12% |
67 Properties |
| 1998 | £107,986 | -15% |
41 Properties |
| 1997 | £124,241 | 4% |
72 Properties |
| 1996 | £119,300 | 13% |
62 Properties |
| 1995 | £103,475 | - |
66 Properties |
Property Price per Property Type in Ponteland East And Stannington
Here you can find historic sold price data in order to help with your property search.
The average Property Paid Price for specific property types in the last three years are:
| Property Type | Average Sold Price | Sold Properties |
|---|---|---|
| Semi Detached House | £364,328.00 | 32 Semi Detached Houses |
| Detached House | £550,456.00 | 82 Detached Houses |
| Terraced House | £339,048.00 | 16 Terraced Houses |
| Flat | £167,965.00 | 31 Flats |

