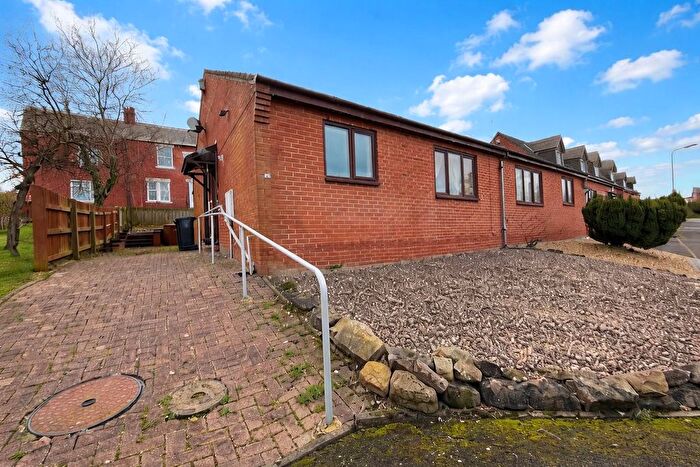
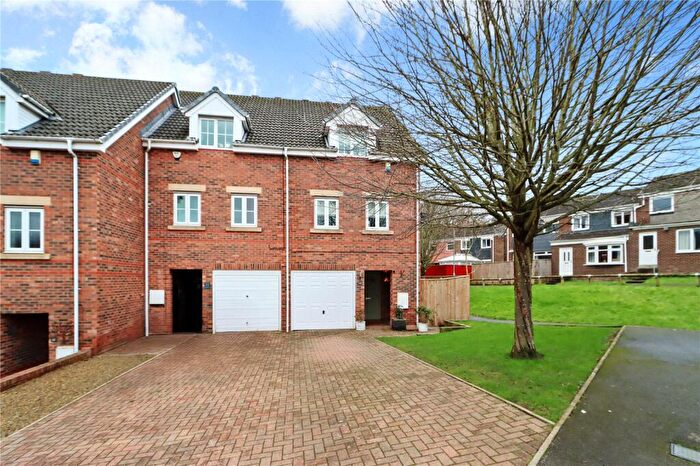
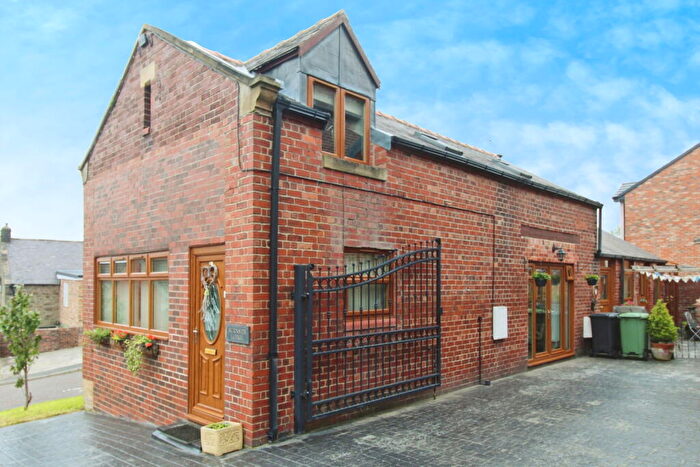
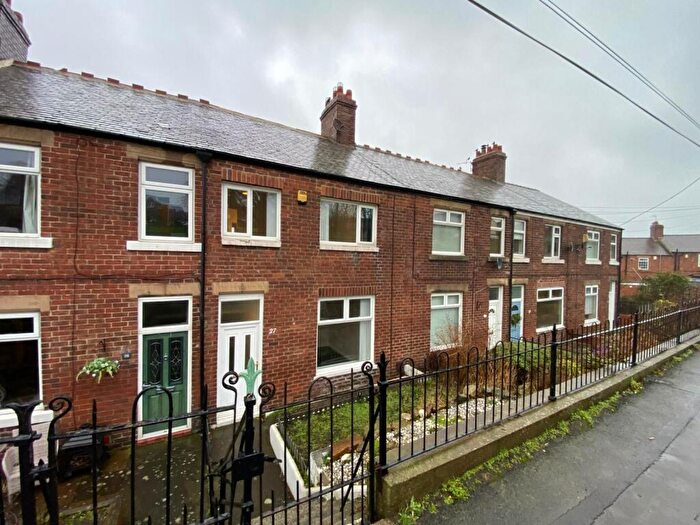
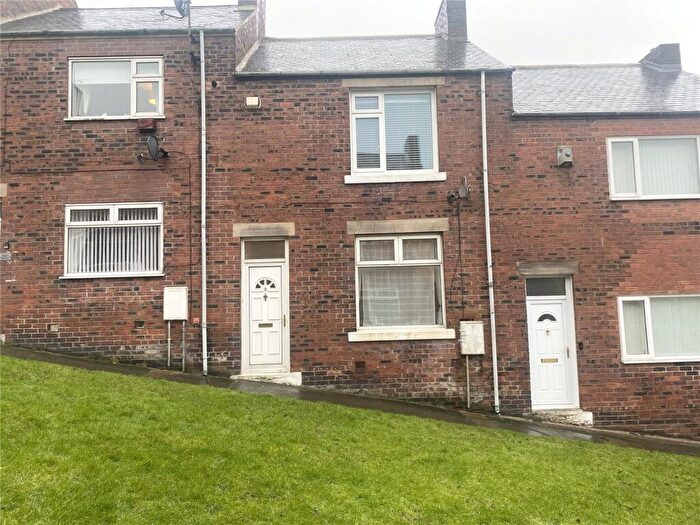
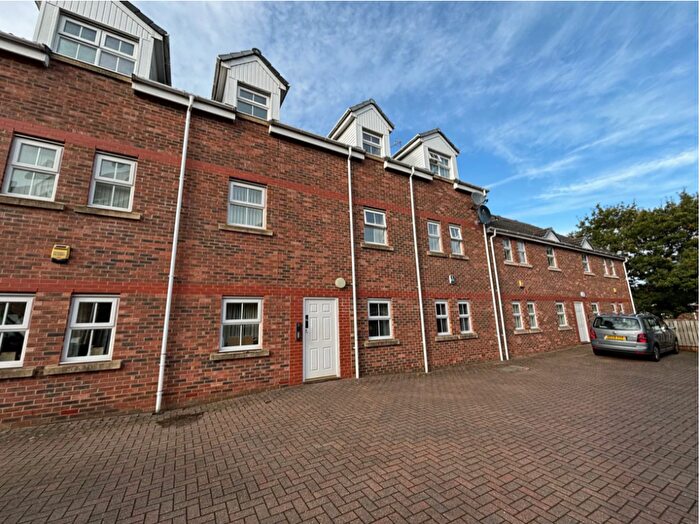
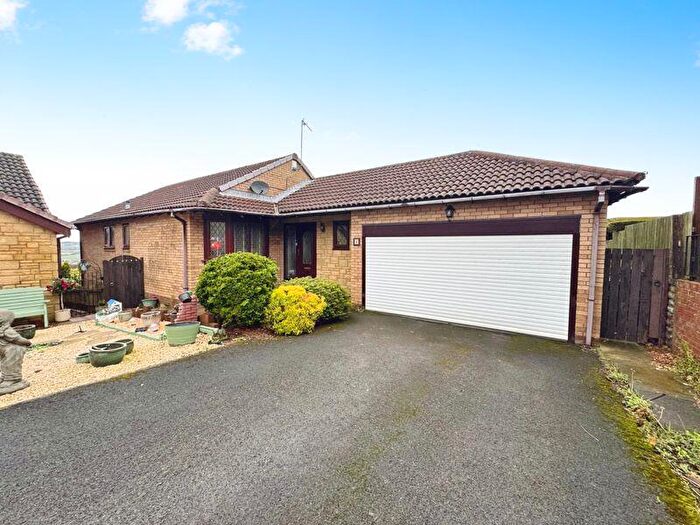
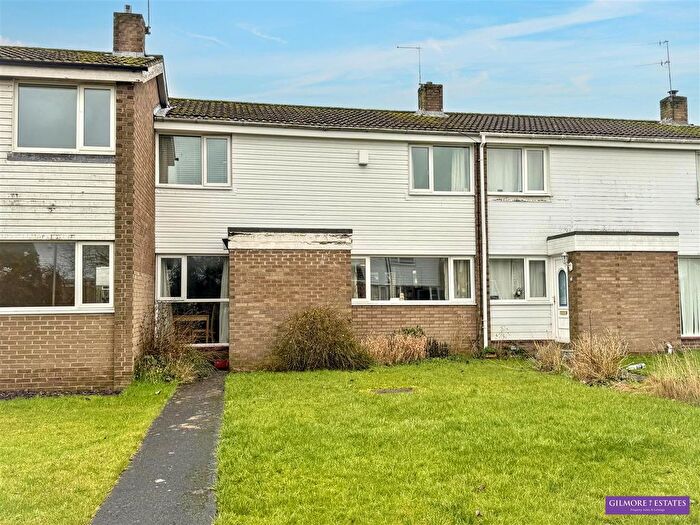
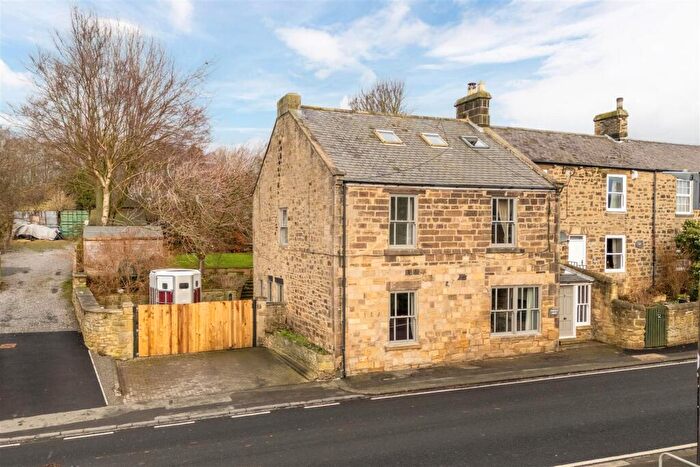
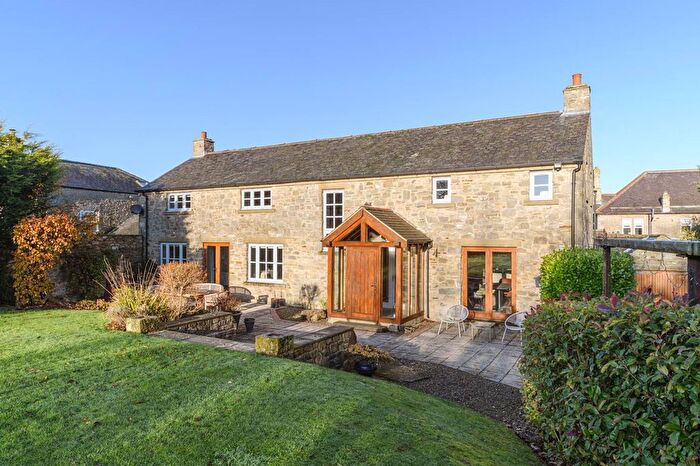
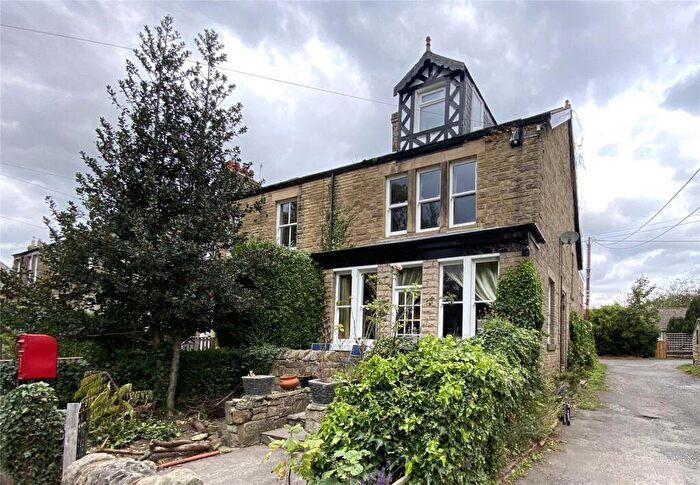
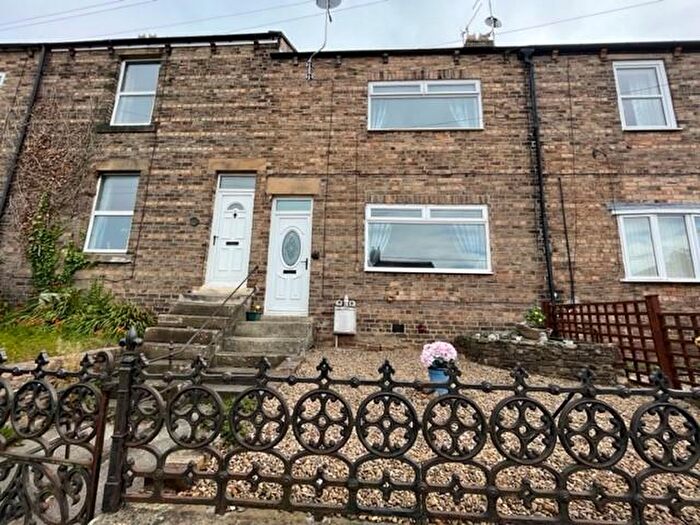
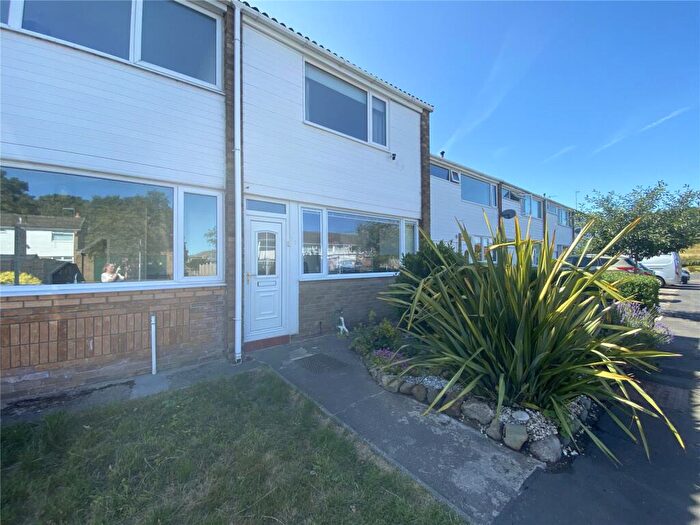
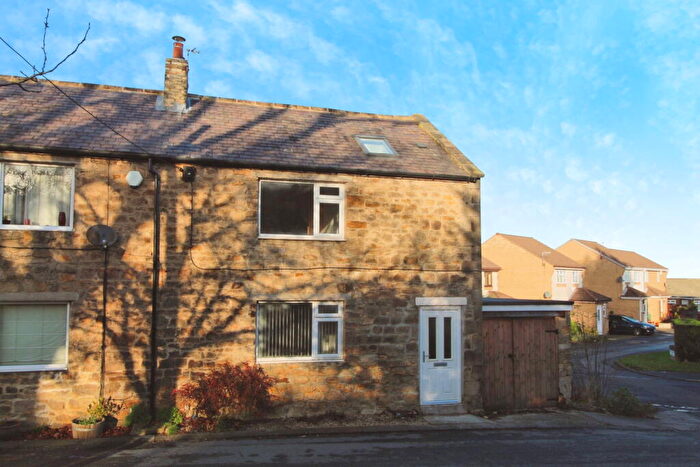
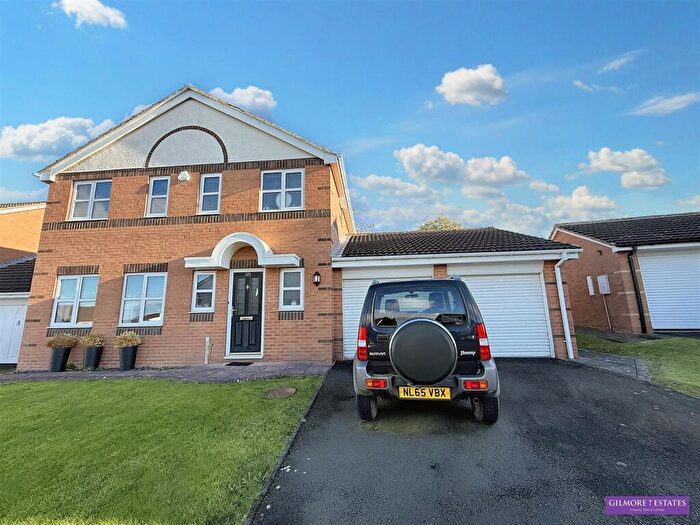
Houses for sale & to rent in Bywell, Prudhoe
House Prices in Bywell
Properties in Bywell have an average house price of £261,660.00 and had 53 Property Transactions within the last 3 years¹.
Bywell is an area in Prudhoe, Northumberland with 754 households², where the most expensive property was sold for £880,000.00.
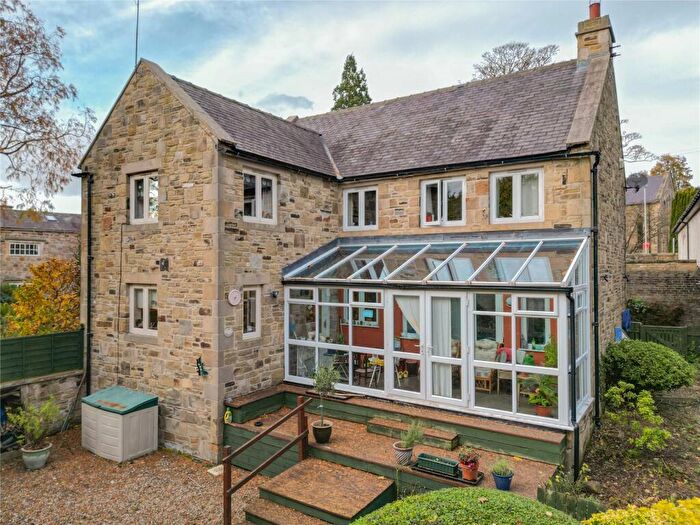
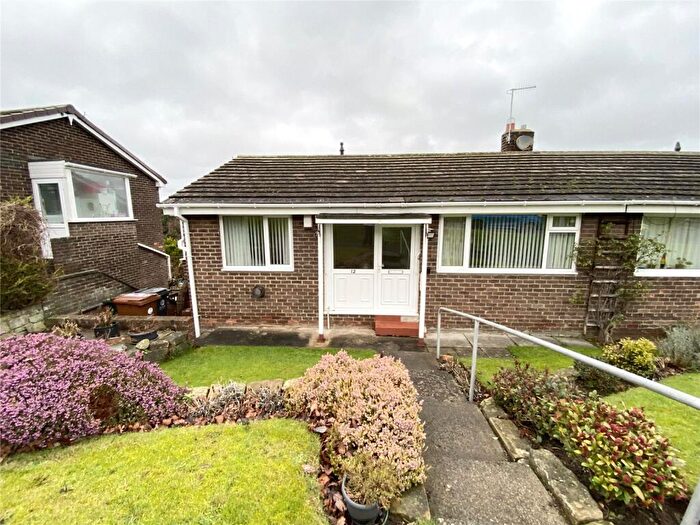
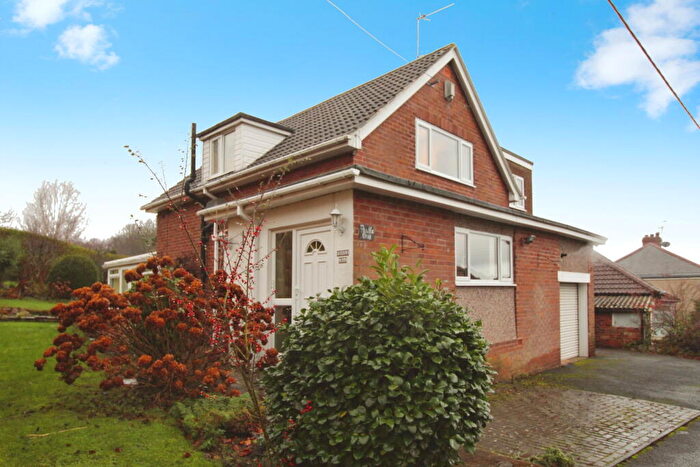
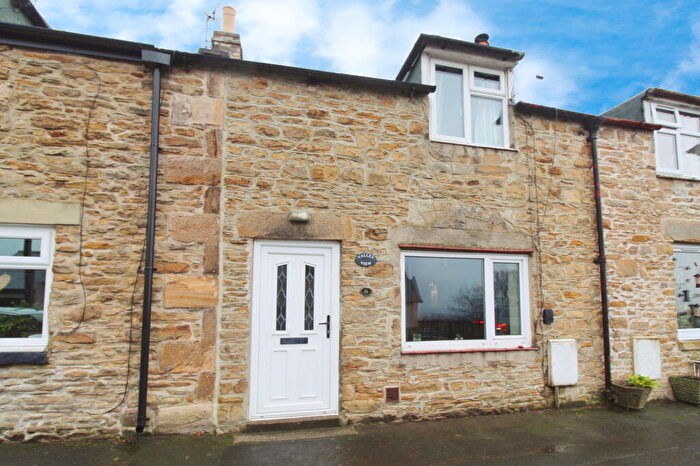
Properties for sale in Bywell
Roads and Postcodes in Bywell
Navigate through our locations to find the location of your next house in Bywell, Prudhoe for sale or to rent.
| Streets | Postcodes |
|---|---|
| Bewick Lane | NE42 6BT |
| Burnside | NE42 6DY |
| Burnside Close | NE42 6BS |
| Castle View | NE42 6AT NE42 6AU |
| Croft View | NE42 6AN |
| Dene Close | NE42 6BE |
| Dene Garth | NE42 6AP NE42 6AW |
| Dene Terrace | NE42 6DL |
| Dene View | NE42 6DJ |
| Dukes Cottages | NE42 6AD |
| Dyer Close | NE42 6BF |
| Green Rising | NE42 6DX |
| Hawthorn Gardens | NE42 6BR |
| Horsley Road | NE42 6AL NE42 6BG |
| Irving Place | NE42 6DB |
| Jubilee Road | NE42 6EA |
| Leazes View | NE42 6DU |
| Little Buildings | NE42 6DS |
| Main Road | NE42 6AA NE42 6AG NE42 6HH |
| North Meadow | NE42 6QH |
| Nunnykirk Close | NE42 6BP |
| Piper Road | NE42 6AX NE42 6AY NE42 6AZ |
| River View | NE42 6AH |
| South View | NE42 6DR |
| Springfield | NE42 6EH NE42 6EQ |
| Springfield Close | NE42 6EL |
| The Green | NE42 6DZ |
| The Hill | NE42 6AB |
| The Terrace | NE42 6AJ |
| Tyne Gardens | NE42 6AR |
| Welburn Close | NE42 6BD |
| West Road | NE42 6AQ NE42 6BN NE42 6BW |
| Wheatfield Close | NE42 6BA NE42 6BB |
| Windsor Crescent | NE42 6AS |
| NE42 6BJ NE42 6BL NE42 6DE NE42 6DH NE42 6DN NE42 6DQ NE42 6DW NE42 6EB NE42 6ED NE42 6EF NE42 6HJ NE42 6HL NE42 6HQ NE42 6BH NE42 6BQ NE42 6DF NE42 6DG NE42 6DT NE42 6EE |
Transport near Bywell
- FAQ
- Price Paid By Year
- Property Type Price
Frequently asked questions about Bywell
What is the average price for a property for sale in Bywell?
The average price for a property for sale in Bywell is £261,660. This amount is 34% higher than the average price in Prudhoe. There are 663 property listings for sale in Bywell.
What streets have the most expensive properties for sale in Bywell?
The streets with the most expensive properties for sale in Bywell are Main Road at an average of £672,500, The Terrace at an average of £500,000 and Springfield at an average of £465,000.
What streets have the most affordable properties for sale in Bywell?
The streets with the most affordable properties for sale in Bywell are Green Rising at an average of £162,333, Dene Close at an average of £175,000 and Windsor Crescent at an average of £177,166.
Which train stations are available in or near Bywell?
Some of the train stations available in or near Bywell are Prudhoe, Stocksfield and Wylam.
Property Price Paid in Bywell by Year
The average sold property price by year was:
| Year | Average Sold Price | Price Change |
Sold Properties
|
|---|---|---|---|
| 2025 | £292,088 | -14% |
17 Properties |
| 2024 | £332,880 | 40% |
13 Properties |
| 2023 | £198,915 | -54% |
23 Properties |
| 2022 | £306,190 | 19% |
25 Properties |
| 2021 | £249,009 | 4% |
26 Properties |
| 2020 | £238,510 | 6% |
24 Properties |
| 2019 | £224,605 | 16% |
18 Properties |
| 2018 | £188,225 | -20% |
20 Properties |
| 2017 | £225,456 | 4% |
23 Properties |
| 2016 | £216,932 | 7% |
23 Properties |
| 2015 | £202,598 | 7% |
30 Properties |
| 2014 | £187,613 | -5% |
30 Properties |
| 2013 | £196,156 | -28% |
16 Properties |
| 2012 | £250,246 | 1% |
14 Properties |
| 2011 | £246,573 | 26% |
13 Properties |
| 2010 | £181,306 | -12% |
16 Properties |
| 2009 | £203,088 | -22% |
18 Properties |
| 2008 | £247,066 | -12% |
27 Properties |
| 2007 | £277,545 | 34% |
31 Properties |
| 2006 | £182,572 | 8% |
34 Properties |
| 2005 | £167,772 | -2% |
20 Properties |
| 2004 | £170,497 | 7% |
23 Properties |
| 2003 | £159,306 | 19% |
40 Properties |
| 2002 | £128,447 | 17% |
34 Properties |
| 2001 | £107,202 | -9% |
45 Properties |
| 2000 | £117,062 | 21% |
36 Properties |
| 1999 | £92,078 | -9% |
32 Properties |
| 1998 | £100,318 | 32% |
37 Properties |
| 1997 | £68,331 | 1% |
31 Properties |
| 1996 | £67,804 | 6% |
22 Properties |
| 1995 | £63,519 | - |
21 Properties |
Property Price per Property Type in Bywell
Here you can find historic sold price data in order to help with your property search.
The average Property Paid Price for specific property types in the last three years are:
| Property Type | Average Sold Price | Sold Properties |
|---|---|---|
| Semi Detached House | £219,976.00 | 13 Semi Detached Houses |
| Detached House | £489,450.00 | 10 Detached Houses |
| Terraced House | £203,793.00 | 30 Terraced Houses |

